Original link: https://www.zhangxinxu.com/wordpress/2023/08/js-performanceobserver-api/
by zhangxinxu from https://www.zhangxinxu.com/wordpress/?p=10950Xin Space-Xin Life
This article is welcome to share and aggregate, there is no need to reprint the full text, respect copyright, the circle is so big, if you need it urgently, you can contact for authorization.

1. Observer family
Unexpectedly, the Observer family also has a PerformanceObserver, which is a bit unbelievable. That is, I clearly sorted out the Observers currently supported by browsers before, but it is already 2023. The sudden appearance of a PerformanceObserver is very unreal. What happened before? Didn’t see it?

MutationObserver can be used to observe changes in DOM elements , ResizeObserver can be used to observe changes in the size of DOM elements , and IntersectionObserver can observe the intersection of elements and browser windows .
The PerformanceObserver to be introduced in this article can observe various performance indicators of the page.
2. About Performance API
Performance API is a huge family, and you can’t learn it at all. Take a look at the following (refer to the MDN document ), the knowledge density is not generally high.
PerformanceEntry
PerformanceMark
PerformanceMeasure
PerformancePaintTiming
PerformanceResourceTiming
PerformanceNavigationTiming
PerformanceElementTiming
PerformanceLongTaskTiming
PerformanceEventTiming
TaskAttributionTiming
LargestContentfulPaint
Performance
Performance Observer
LayoutShift
VisibilityStateEntry
PerformanceObserver is a very important part of it.
3. Included performance indicators
PerformanceObserver contains a series of performance indicators as shown in the following table (it can be returned through PerformanceObserver.supportedEntryTypes, and the support of different browsers may vary):
| index | paraphrase | |||
|---|---|---|---|---|
| back-forward-cache-restoration | – |  |
✘ | ✘ |
| element | Element loading time, instance item is PerformanceElementTiming object. |  |
✘ | ✘ |
| event | Event delay, instance item is PerformanceEventTiming object. |  |
 |
✘ |
| first-input | The time from the user’s first interaction with the website (that is, when clicking a link, clicking a button, or using a custom JavaScript control) to the time when the browser can actually respond to the interaction is called First input delay – FID. |  |
 |
✘ |
| largest-contentful-paint | The largest drawing element triggered on the screen, the instance item is LargestContentfulPaint object. |  |
✘ | ✘ |
| layout-shift | Layout stability when elements are moved, the instance item is a LayoutShift object. |  |
✘ | ✘ |
| long-animation-frame | Long animation keyframes. |  |
✘ | ✘ |
| long task | The long task instance belongs to the PerformanceLongTaskTiming object. |  |
✘ | ✘ |
| mark | User-defined performance flags. The instance items are PerformanceMark objects. |  |
 |
 |
| measure | User-defined performance measurements. Instance items are PerformanceMeasure objects. |  |
 |
 |
| navigation | The time when the page is navigated out, the instance item is the PerformancePaintTiming object. |  |
 |
 |
| paint | The key moment of content rendering when the page is loaded (the first drawing, the first drawing with content, the instance item is the PerformancePaintTiming object. |  |
 |
 |
| resources | The timing information of the resource on the page, the instance item is the PerformanceResourceTiming object. |  |
 |
 |
| task attribution | The type of work that the long-running task contributes significantly to, the instance item is a TaskAttributionTiming object. | ✘ | ✘ | ✘ |
| soft-navigation | – |  |
✘ | ✘ |
| visibility-state | When the page visibility state changes, i.e. when the tab changes from foreground to background and vice versa. Instance entries are VisibilityStateEntry objects. |  |
✘ | ✘ |
PS: Tested browsers, Chrome 114, Firefox 116 and Safari 16.5.2.
It can be seen that, basically, each performance indicator has a corresponding dedicated object type.
Among them, some indicators are core indicators.
Web Performance Core Indicators
- LCP, Largest Contentful Paint, corresponding to the largest-contentful-paint type, is a loading performance indicator.
- FID, First Input Delay, corresponding to the first-input type, is an interactive performance indicator.
- CLS, Cumulative Layout Shift, corresponding to the layout-shift type, is an indicator of visual stability.
You can focus on it. As for some other time types and their corresponding objects, ahem…there are too many contents, and you can’t finish learning them. So, skip them and wait until the day you really need them. Take another look.
4. Paint type and first rendering time
Let’s look at the results of ‘paint’ in PerformanceObserver.
Look at the following code and examples, write in the page header:
 const observer = new PerformanceObserver(entryList => {

    for (const entry of entryList. getEntries()) {

        console.dir(entry);

    }

});

observer. observe({

  entryTypes: ['paint']

});
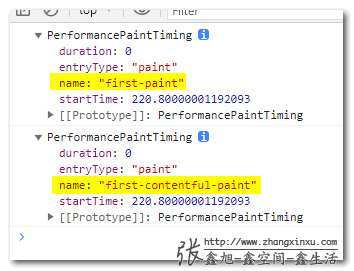
Under the Chrome browser, two entry objects are output, as shown in the screenshot below:

They are to start rendering and to start rendering with content (the DOM where the text or image is located).
For example, there is a data structure for content rendering:
 {

  "name": "first-contentful-paint",

  "entryType": "paint",

  "startTime": 220.80000001192093,

  "duration": 0

}
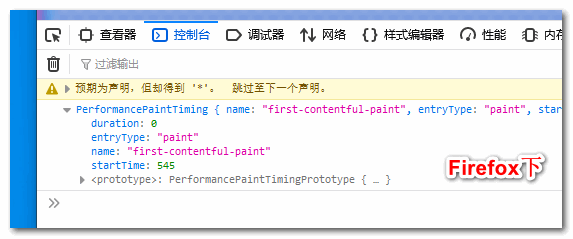
There is only one entry under Firefox, because fewer types are supported.

The indicator that can be referred to is startTime, which indicates when the content starts to be rendered. Basically, it can approximate the time when the first screen content is presented.
According to my test, when entering for the first time, the time will be relatively long, 200ms+, no matter which browser is, and then it will be refreshed very quickly, within 100ms, I guess, because resources like CSS files are blocked. It’s cached (outside CSS can block rendering), so it’s faster.
Seeing is believing, you can click here hard: PerformanceObserver first screen rendering time demo
//zxx: There are multiple types of paint under the Chrome browser, we replace entryList.getEntries() with (for example) entryList.getEntriesByName('first-contentful-paint') .
5. Look at the running results of largest-contentful-paint
Although LCP is an important performance indicator, it is currently only supported by the Chrome browser.
The running code is similar to ‘paint’ and will not be shown here. If you are interested, you can click here to visit: largest-contentful-paint running test demo
The output is very strange.
In my local (when the ad image in the upper right corner is not loaded), the largest content rendering element is the <h1> title, while online it is the ad image in the upper right corner.
And, the output is the pre element, and it is displayed after the timer triggers the content update.
According to my understanding, shouldn’t the largest rendering element be the large color frame with colorful shading below?
Later, I thought about it, the size should refer to the content, not the rendering area.
So I stuffed a lot of text content, the result is still the same.

The selection rules for this element are really puzzling.
So I checked the MDN document carefully again, and I roughly know the reason.
The LargestContentfulPaint interface provides timing information about the largest image or text paint before user input on a web page.
Needs to be an element that is rendered before the page can be interacted with, and within the bounds of the viewport (the entire area of the element).
Based on these two points, I re-modified the content of the next page, including reducing the height and increasing the content, and then refreshed, oh, it’s done!

Happy, and figured out a little knowledge.
6. First-input indicators that were inconvenient to obtain in the past
first-input refers to the first interaction time of the user page. I thought it was the interactive time at first. Fortunately, I tested it.
 const observer = new PerformanceObserver(entryList => {

    for (const entry of entryList. getEntries()) {

        console.dir(entry);

    }

});

observer. observe({

  entryTypes: ['first-input']

});
For example, the above test code has no output after the page is refreshed.
Only when you click on the page, the console statement will be executed.
This API can be used to count whether the page has been interacted with by the user, and the duration of the stay. I don’t know if it can be used to identify whether it is a machine behavior.
Have a chance to try it later.
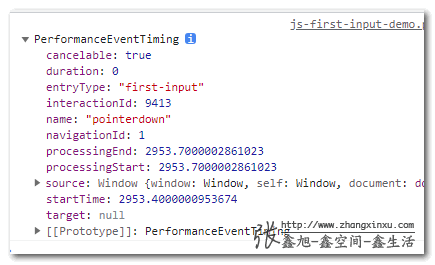
Its output shows:

 {

    "name": "pointerdown",

    "entryType": "first-input",

    "startTime": 2953.4000000953674,

    "duration": 0,

    "navigationId": 1,

    "processingStart": 2953.7000002861023,

    "processingEnd": 2953.7000002861023,

    "cancelable": true

}
Among them, startTime is the time interval from the beginning of interaction on the page to the first interaction, name is the event type, click is pointerdown, and keyboard access is keydown.
I tested it. On the PC side, it seems that only clicks and keyboard orientations can be triggered, and mouse hover control elements and mouse wheel scrolling will not be triggered.
Seeing is believing, you can click here hard: first-input first interaction time test demo
Seven, the next step is mark and measure
The performance in Performance on the Web revolves around the timeline timeline.
From the performance analysis tools of browsers such as Chrome and Firefox, it can be seen that:

To know the performance of a certain timeline, you need to know the start and end points of this timeline.
The mark of the start and end points is called mark, and the performance measurement during the period is measure.
These two actions correspond to two specialized object interfaces, the former is PerformanceMark, which can name and add marks to any position, and the latter is PerformanceMeasure, which is the time measurement between two marks.
We can precisely measure certain performance metrics with the help of these two objects.
One way is to use the Performance API, and the other is to use the PerformanceObserver.
Here is an example to demonstrate the use of each.
Assuming that there are two elements on the page, one whose id is output and the other is footer, the test code is as follows (using a timer to simulate the time interval):
 // mark mark performance.mark('test-start', {

    startTime: 0,

      detail: { htmlElement: 'output' }

});


setTimeout(() => {

    performance.mark('test-end', {

        startTime: 360,

        detail: { htmlElement: 'footer' }

    });


    const testMeasure = performance.measure(

      "test-start",

      "test-end"

    );


    console.dir(testMeasure);

}, 360);


const observer = new PerformanceObserver(entryList => {

    entryList. getEntries(). forEach((entry) => {

        var logMark = '';

        var logMeasure = '';

        if (entry.entryType === 'mark') {

              logMark = `The startTime of ${entry.name} is: ${entry.startTime}`;

              console.log(logMark);

        }

        if (entry. entryType === 'measure') {

              console.log(logMeasure = `${entry.name}'s duration time is: ${entry.duration}`);

        }

    });

});

observer. observe({

      entryTypes: ['mark', 'measure']

});
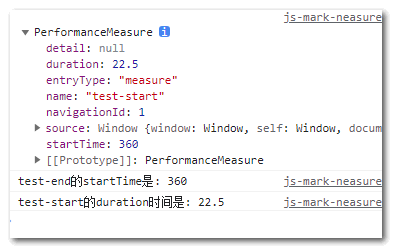
At this point, you can see information such as the execution start time and time interval.

The duration at this time should be the rendering time between two DOM elements.
Seeing is believing, you can click here hard: mark and measure type test demo
8. Okay, stop, it’s time to end
After this wave of reading, testing, and writing, I have roughly figured out the flowers and plants of PerformanceObserver… ummmm… That’s it. When you encounter a page freeze one day, you can use this row to check it out.
As for performance statistics and reporting, it is also an uncommon requirement.
So, just understand it.
Usually those projects, as long as they are developed normally, will be very smooth with the current browser performance.
In addition, you still have to test it yourself. You can’t see many things just by looking at the documentation, and many contents of the documentation are missing.
OK, it’s almost September, and it’s time to wind up the clockwork.
Well, enough content already, no more nonsense.
Thank you for reading, act hastily, if there are mistakes, please correct me.
love~


This article is an original article, welcome to share, do not reprint the full text, if you really like it, you can bookmark it, it will never expire, and will update knowledge points and correct errors in time, and the reading experience will be better.
Address of this article: https://www.zhangxinxu.com/wordpress/?p=10950
(End of this article)
This article is transferred from: https://www.zhangxinxu.com/wordpress/2023/08/js-performanceobserver-api/
This site is only for collection, and the copyright belongs to the original author.