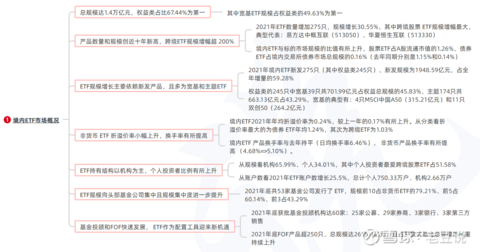
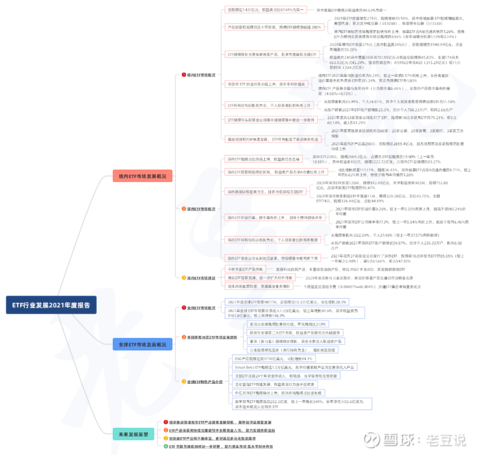
Two weeks ago (April 10), the Shenzhen Stock Exchange issued an annual report on the development of the ETF industry (2021). After reading it, I also made some simple arrangements. I will share it with you today. I have listed several points that I think are worth paying attention to. The focus is on the partial map of the ETF situation in the domestic Shanghai and Shenzhen stock markets. I have also exported it separately (see Figure 1). It is recommended to look at the following figure, which is more intuitive and the data is more detailed. In addition, I put the complete picture of Shenzhen Securities Market, Overseas Chapter, and Prospect Chapter at the end (see Figure 2). If you want to see the detailed content, you can go to the official website to find the original PDF for reading (38 pages in total).
1. The scale of domestic ETFs has reached 1.4 trillion yuan, of which the equity category accounts for more than 60%, and the equity category in the broad base accounts for nearly half.
2. The number and scale of ETFs continue to reach new highs, and the “beggar gangs” who buy more and more will increase the most in 2021. In addition, with the growth of ETF scale, the proportion of ETF in the circulating market value of A shares has also increased year by year.
3. The growth of ETF scale mainly depends on newly issued products. In 2021, the scale of newly issued products will account for nearly 60% of the annual increase. And you will find that the broad base class and the theme class account for the vast majority, in which the broad base wins by a single scale, and the theme class wins by the number of new releases.
4. The ETF holding structure is dominated by institutions, and the proportion of individual investors has increased (individuals prefer cross-border stock ETFs). The discount and premium rate of non-currency ETFs rose slightly, and the turnover rate increased.
5. The scale of ETFs is concentrated to the top fund companies and the scale concentration is further improved. 53 fund companies have issued ETFs, the top 10 of which account for 79.21% of non-currency ETFs, and the top 5 account for 60.14%.
6. The overall development of the Shenzhen Stock Exchange is similar to that of the domestic ETF Shanghai and Shenzhen stock markets, but some data are still weaker than those of the Shanghai Stock Exchange, and the Shenzhen Stock Exchange still has room for efforts.


#ETFStar Push Official# $Shanghai Composite Index(SH000001)$ $Zhongqian Internet ETF(SH513050)$ $Hang Seng Technology Index(HKHSTECH)$
@ETFstar push officer @snowball creator center @today’s topic @shenzhen stock exchange investment education base
This topic has 0 discussions in Snowball, click to view.
Snowball is an investor’s social network, and smart investors are here.
Click to download Snowball mobile client http://xueqiu.com/xz ]]>
This article is reproduced from: http://xueqiu.com/5188297436/217988153
This site is for inclusion only, and the copyright belongs to the original author.