In the previous article , the management scale of 6 trillion, the performance of thousands of fund managers is summarized! In this book, I took stock of the performance of thousands of fund managers in the A-share market, and preliminarily listed some fund managers worthy of everyone’s attention based on statistical indicators such as annualized excess returns, management scale, and information ratios.
This article goes a step further, by visually presenting the most important information of the excess return curve of each fund manager together with its management scale , supplemented by other indicators, in order to help you systematically identify the ” potential stars among fund managers” “.
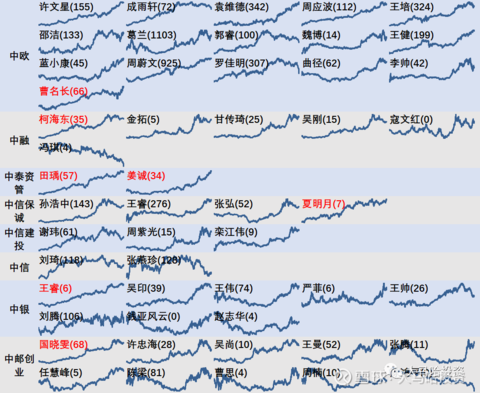
The reason why the excess return curve is important is that the excess return curve can help us observe the stability of the excess return of the fund manager. The more stable the excess return of the fund manager, the closer its excess return is to present a 45-degree sloping line. At this time, no matter how long or short the product of the fund manager is, you can get the excess return relative to the market, and the investment experience A fund manager with unstable excess returns has an irregular excess return curve. Either investors hold the fund manager for a long time without making money ( no excess acquisition ability ), or investors hold the fund for a certain period of time. Fund managers don’t make money ( excess returns are too concentrated in certain time periods ).
Of course, there are many limitations in directly using the indicator of excess return stability relative to the CSI 300 Total Return Index , mainly including: (1) The performance benchmarks of many fund managers are not CSI 300 due to contractual positions and investment directions. It is easy to be misunderstood by the Shenzhen 300 as a performance benchmark; (2) The investment style of some fund managers will show a state of high volatility, and it is too harsh to use this indicator to measure.
In view of this, without knowing other information about fund managers, I think: fund managers with unstable excess returns are not necessarily unreliable fund managers; fund managers with stable excess returns are likely to be worth a look . This is an efficient way to quickly screen fund managers, with the inevitable loss of precision.
This article lists the excess return curve data of 799 fund managers by fund company classification (from the thousand fund managers in the previous article, those with a tenure of more than 2 years and an average equity position of more than 50% during their tenure were selected).
1. Data overview
The 799 fund managers selected cover a total of 129 fund companies, and the three fund companies with the largest number of selected fund managers are Wells Fargo ( 32 ), Harvest ( 26 ) and ICBC Credit Suisse ( 24 ). Among these 129 fund companies, 61 fund companies have selected 5 or more fund managers. Here I list the performance statistics of these 61 fund companies selected as fund managers for your reference (according to the per capita management scale Sorted from high to low).
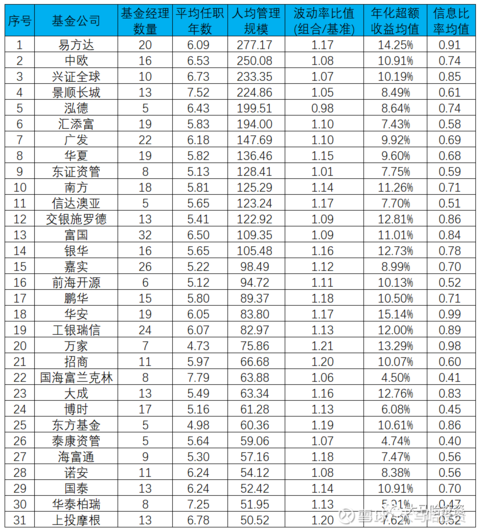
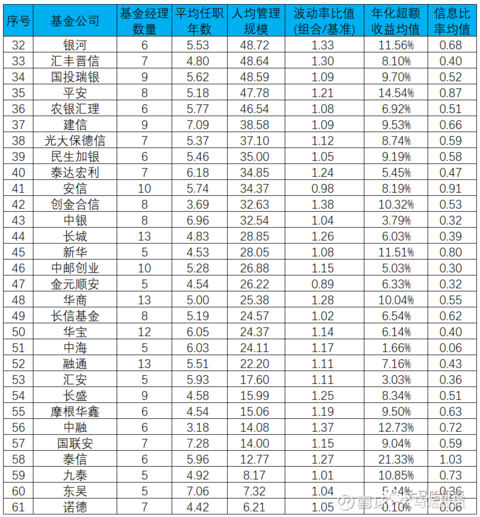
Although the above table is aggregated data, we can make some interesting findings:
(1) Head companies have strong brand effects. In other words, when the performance of fund managers is not much different, the management scale of fund managers of leading companies is significantly higher than that of non-leading companies. Companies such as E Fund, China Europe , Industrial Securities Global and Invesco Great Wall all have a per capita management scale of RMB 20 billion and above; while the overall performance of fund companies such as Huaan , ICBC Credit Suisse , Dacheng , Cathay Pacific and CCB is similar to that of leading companies The average size of management is much lower. If the scale of management is the valuation of a fund manager, then it is expected to find more cost-effective fund managers in non-leading companies.
(2) In terms of industry allocation concentration, fund companies vary greatly. If the allocation of fund products in the industry is relatively concentrated, it will have a high probability of high volatility, which will make the volatility ratio (combination/benchmark) too large, otherwise it will make the ratio too small. According to the statistics in the table above, the 4 fund companies with the highest volatility ratio (portfolio/benchmark) are Chuangjin Hexin , Zhongrong , Galaxy and HSBC Jintrust; the 5 fund companies with the lowest volatility ratio (portfolio/benchmark) are Jinyuan Shun’an , Hongde , Anxin , Orient Securities Asset Management and Jiutai .
2. A large summary of the net value curve of excess returns
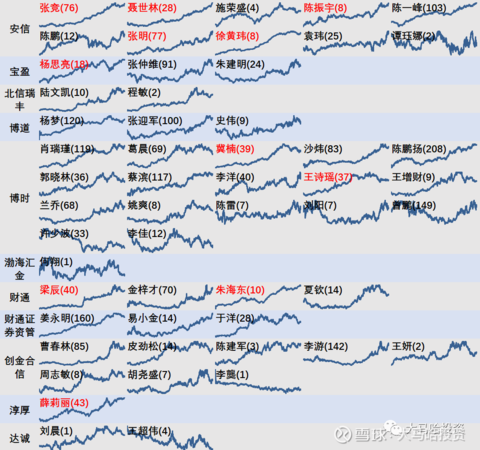
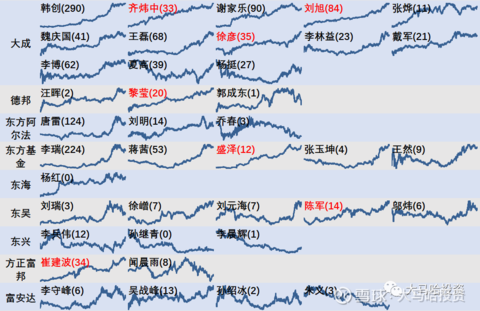
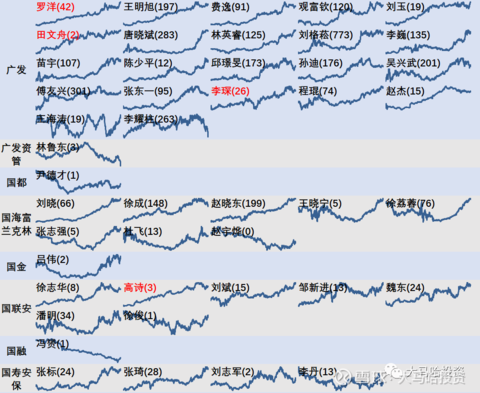
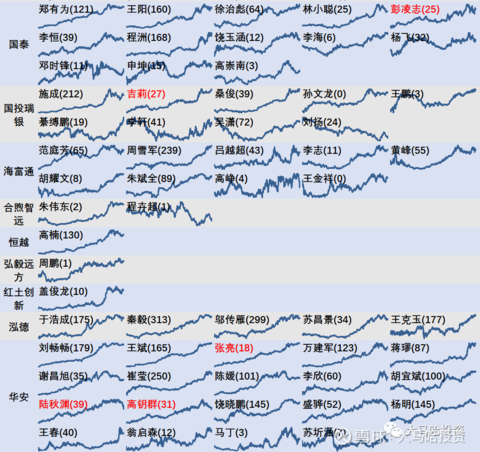
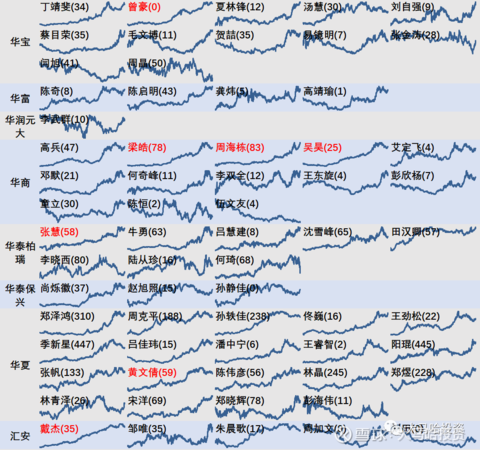
As the most important performance indicator of fund managers, the stability of excess returns can be identified by observing the smoothness of the net value curve of excess returns. To this end, I have listed the net worth curves of these 799 fund managers relative to the CSI 300 Total Return Index, which are arranged according to the initials of each fund company. Arranged from high to low , the number in parentheses after each fund manager is its current management size (20211231).
Here, I have marked red for fund managers whose excess returns are relatively stable (personal subjective judgment) and whose management scale is less than 10 billion . Of course, in view of whether the excess return curve is stable by observing the graph, there is a situation where the benevolent sees the wise and sees the wisdom, so the fund managers marked in red are for reference only .
Anxin, Baoying, Beixin Ruifeng, Bodao, Bosera, Bohai Huijin, Caitong, Caitong Securities Asset Management, Chuangjin Hexin, Chunhou, Dacheng:
Dacheng, Debon, Oriental Alpha, Oriental Fund, Donghai, Soochow, Dongxing, Founder Fubon, Fuanda:
Wells Fargo, ICBC Credit Suisse and Pramerica Everbright:
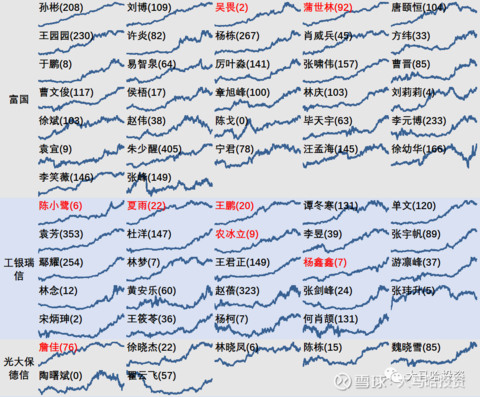
GF, GF Asset Management, Guodu, Guohai Franklin, Guojin, Guolian, Guorong, China Life Security:
Cathay Pacific, SDIC UBS, HFT, Hexu Zhiyuan, Hengyue, Hongyi Yuanfang, Red Earth Innovation, Hongde, Huaan:
Huabao, Huafu, China Resources Yuanta, Huashang, Huatai Pineapple, Huatai Baoxing, Huaxia, Hui’an:
HSBC Jintrust, Huiquan, China Universal, Jiahe, Harvest, CCB:
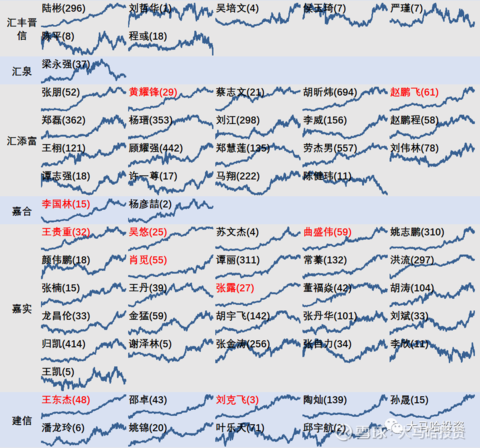
Jiangxin, Bank of Communications Schroders, Jinxin, Golden Eagle, Jinyuan Shun’an, Invesco Great Wall, Jiutai, Kaishi, Minsheng Jiayin, Morgan Huaxin:
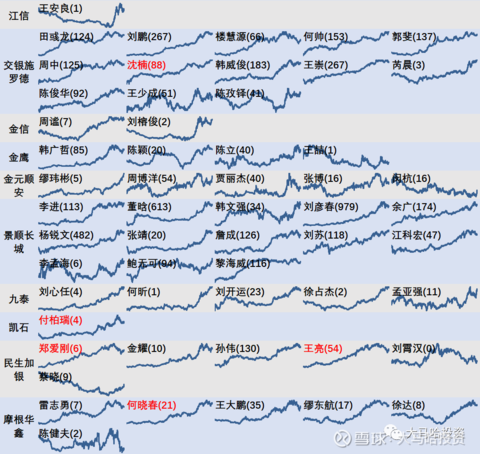
Nanfang, ABCC, Lion, Nord, Penghua, Pengyang:
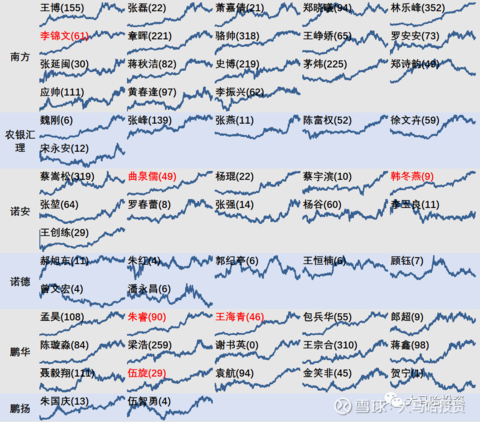
Ping An, SPDB-AXA, Qianhai Kaiyuan, Rongtong, Ruida, Ruiyuan, Shanxi Securities, Orient Securities Asset Management, Guojun Asset Management:
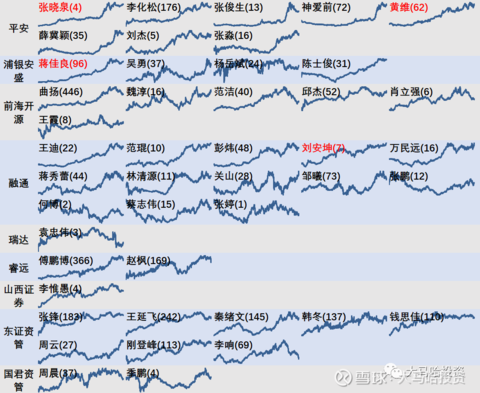
Shanghai Investment Morgan, Shanghai Bank, Shangzheng, Shenwan Lingxin, Taiping, TEDA Manulife, Taikang Asset Management, Taixin, Tianhong, Tianzhi, Wanjia:
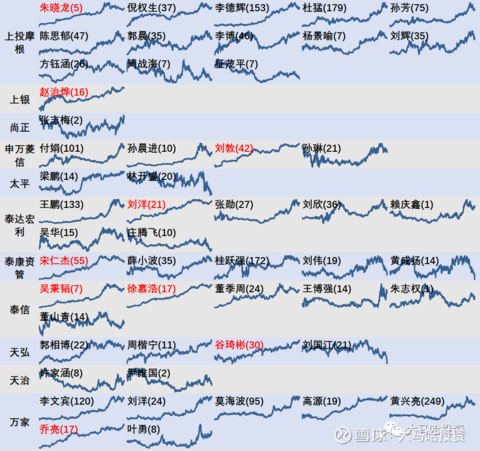
Western Profit, Pioneer, Xinhua, Qianhai United, Xinwo, Xinyuan, Cinda Australia, Industrial, Industrial Bank Fund, Industrial Securities Global, E Fund, Yimin:
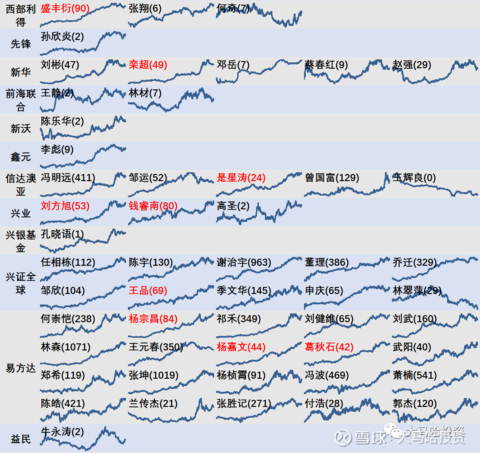
Galaxy, Yinhua, Yingda, Yongying, Yuanxin Yongfeng, Changan, Great Wall, Changsheng:
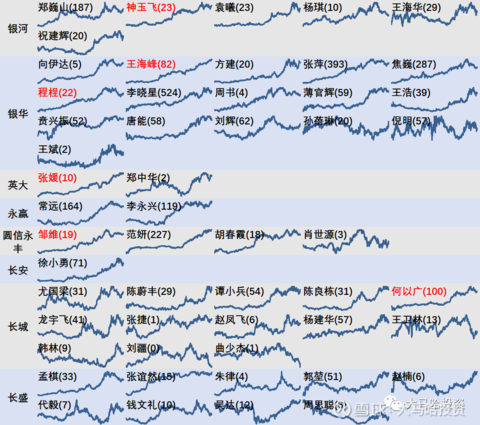
Changxin, China Merchants, China Merchants Securities, Zheshang Asset Management, Zheshang, Zhonggeng, PICC, China Shipping, China Aviation, China Canada, China Kewo:
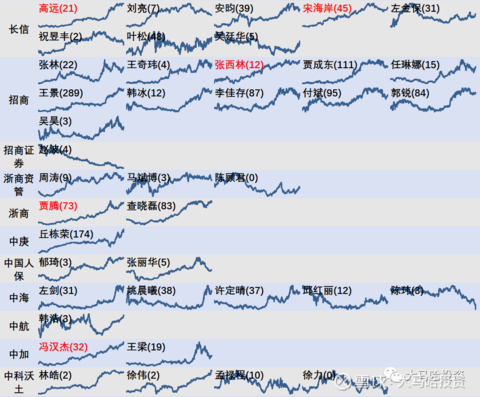
China Europe, Zhongrong, Zhongtai Asset Management, CITIC Prudential, CITIC Construction Investment, CITIC, Bank of China, China Post Ventures:
3. Summary of “Potential Stars”
In order to facilitate everyone to have a specific understanding of the situation of potential fund managers and conduct further research, the following table summarizes the performance of the 99 and 6 trillion fund managers marked in red in the above figure! The performance index data of the 9 listed fund managers totaling 108 are summarized for the convenience of everyone’s research, as shown in the following table.
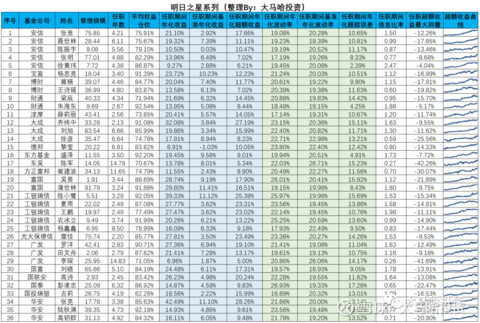
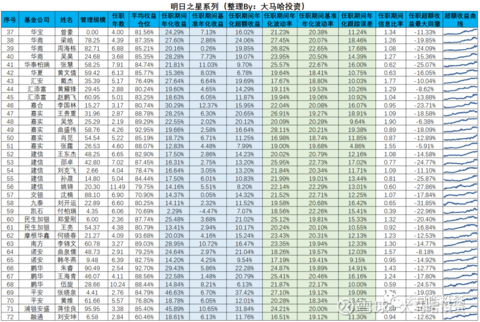
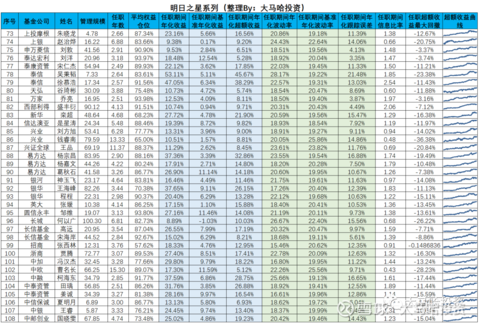
These 108 fund managers are from 68 fund companies, with an average management scale of 3.71 billion and an average tenure of 4.8 years . During their tenure, the average excess return relative to the CSI 300 Total Return Index was 15.1% , and the average tracking error was 12%. , the average information ratio is 1.2 , and the average maximum drawdown of excess returns is 15.67% .
Due to the limitations of evaluating fund managers of excess returns and the subjectivity of evaluating the stability of excess returns, it is certain that in addition to the above 108 fund managers , there will be many other potential stars worthy of your consideration. If you are interested in the performance and representative works of other fund managers, you can leave a message below and I will reply to you .
Related reading:
Which is the best active fund manager?
Which 10-year active fund manager has stable performance?
More than 100 fund managers with more than 5 years’ performance stability inventory, all here~
With a management scale of 6 trillion, the performance of thousands of fund managers is summarized!
The full text is over! All the statistics in this article are from Choice. It is not easy to be original. If this article is helpful to you, please like , comment , favorite , follow and forward in five combos. Thank you for your support~
Disclaimer: The above content is for informational purposes only and does not constitute investment advice. Funds are risky and investment should be cautious.
There are 2 discussions on this topic in Snowball, click to view.
Snowball is an investor’s social network, and smart investors are here.
Click to download Snowball mobile client http://xueqiu.com/xz ]]>
This article is reproduced from: http://xueqiu.com/7245734636/218590983
This site is for inclusion only, and the copyright belongs to the original author.