Original link: http://vis.pku.edu.cn/blog/national-classical-senic-spot-of-red-tourism/
The “National Red Tourism Classic Scenic Spots List” was jointly released by 14 central and national ministries, commissions and bureaus including the National Development and Reform Commission and China Railway Corporation on December 19, 2016. There are 300 national red tourism classic scenic spots including Tiananmen Square in the country. directory.
“A single spark can start a prairie prairie”—it is precisely every group of classic scenic spots on the map that builds a magnificent picture of in-depth development of “red tourism”. “Red tourism” has important practical significance and far-reaching historical significance for strengthening the education of revolutionary traditions, enhancing the patriotic feelings of the people across the country, promoting and cultivating the national spirit, and driving the coordinated economic and social development of the old revolutionary base areas.
Data collection and organization
The data scope of the project is the “National Red Tourism Classic Scenic Spots List” published on the official website of the National Development and Reform Commission as of 2022. A total of 300 national red tourism classic scenic spots, including Tiananmen Square, have been included in the list.
We divide it according to the two dimensions of scenic spot attributes and scenic spots , and take the red tourist scenic spots within the two administrative divisions of Beijing and Gansu Province as examples as the secondary page content. For the attributes of the scenic spots, we consider the province where the scenic spot is located, the category of the scenic spot (including battle sites, old conference sites, former residences of celebrities, martyrs’ cemeteries, etc.), the general situation of the scenic spots, tourism information, etc.; /Special administrative region as the unit of the number of scenic spots, geographical distribution, scenic spot categories, etc.; in addition, we also collected the landmark buildings of Beijing’s red tourist attractions, the historical development context and location information of the scenic spots.
Based on the open source map data, we sort out the distribution of red tourist attractions in my country according to the category of scenic spots, and supplement it with manual collection of the scenic spots, tourist information, relevant historical events, etc. A map of the distribution of red tourist attractions across the country; on the second-level page, the historical context, origin of characters, and cross-sections of the red tourist attractions in Beijing are sorted out through manual data collection, and the data sources required for visualization and interactive design are constructed. .
Visualization and Interaction Design
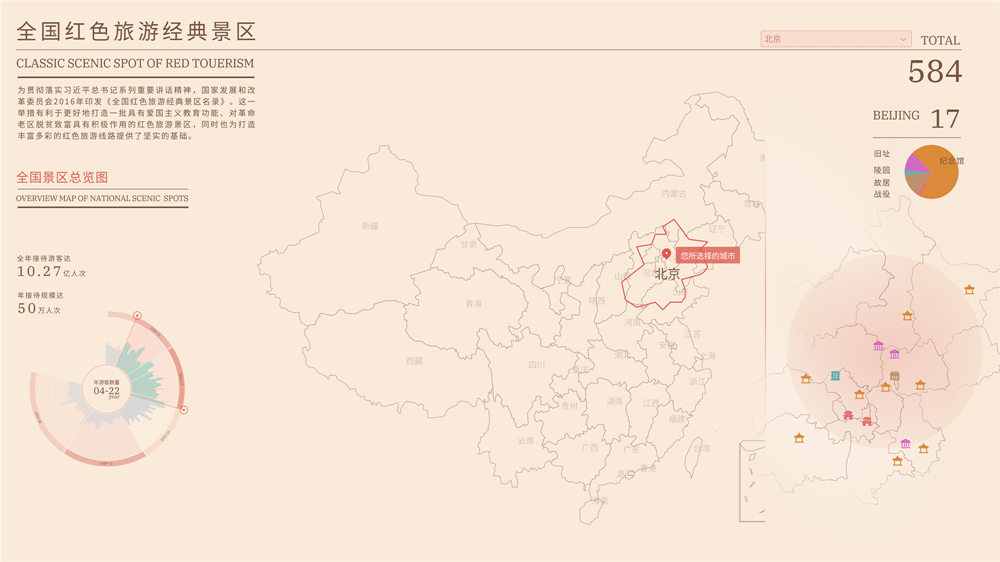
The homepage of the interface is based on the division map of my country’s geographical and administrative regions as the main visual, which can clearly see the number and distribution of red tourist attractions in each administrative region. More than 500 scenic spots have been collected and organized in 6 types of data, including the number of scenic spots, the attributes of scenic spots, and the overview of scenic spots.
By clicking the 6 attribute boxes on the right (battle, memorial, old site, conference, former residence, cemetery), you can see the information displayed in icons and colors on the map; the upper left is a brief introduction to the scenic spot list, and the lower left is 04 A data table of the annual number and scale of tourists in the national red tourism classic scenic spots from 2010 to 2019. Due to the project positioning and tourist orientation, we chose tourists as the design audience. After preliminary discussions, in order to distinguish it from ordinary tourist attractions, we focused on presenting the story and time of red scenic spots as the main content.
 Figure 1 System interface – home page
The pie chart on the left side of the system combines several bar charts to show the relationship between the number of annual tourists and the annual reception scale. From the ups and downs of the bar chart, you can see the increase in the number of tourists in the corresponding year; the attributes of the corresponding attractions on the right are different Icons and colors are marked.
 Figure 2 Statistical graph/list
When the mouse is moved to an administrative area in the map, such as Beijing, the area will be enlarged in place with a stroke frame, and the right sidebar will appear at the same time, showing the number and distribution of red tourist attractions in the city/province; if Triggering the mouse click behavior will jump to the secondary page to view the story details of the city’s attractions.
 Figure 3 System interface – sidebar
Case Study – Red Tourist Attractions in Beijing
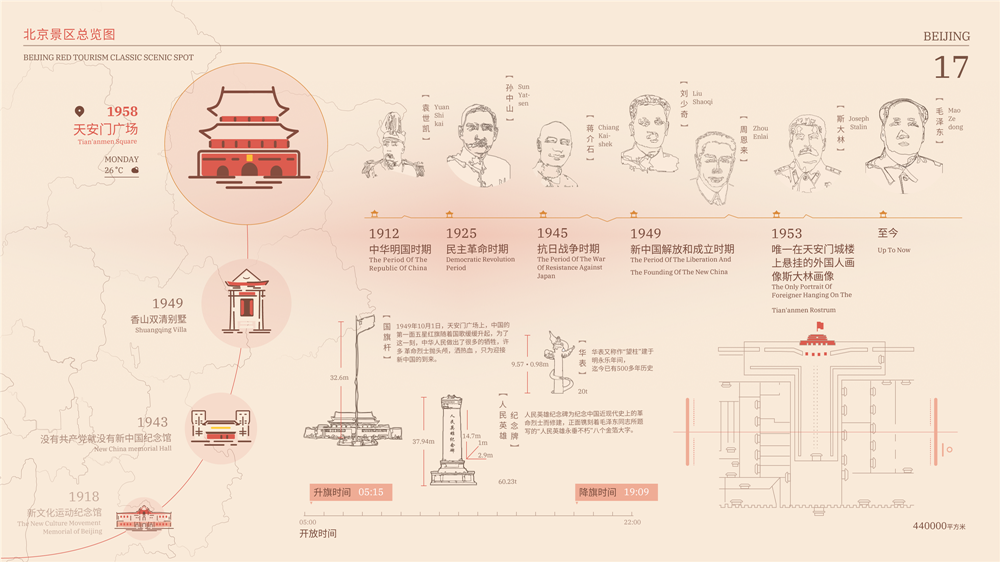
Click on the Beijing administrative area map to enter the overview map of Beijing’s red tourism classic scenic spots, including all the iconic scenic spots in the scenic spots and the classic buildings in the scenic spots, slide up and down with the roulette (from far to near according to time), click to select Tiananmen Square, which was expanded on April 22, 1958, will have a corresponding timeline, and the events and characters will be introduced according to the time of the historical story. The main events are summarized as the first year of the Republic of China (1912). The abdication of the tower was announced, and a portrait of Yuan Shikai was hung in the tower; through the period of the democratic revolution, the period of the War of Resistance Against Japanese Aggression, and the period of liberation and establishment of the People’s Republic of China (1949), the portraits showed the collective efforts of the older generation of proletarian revolutionaries headed by Mao Zedong in the Chinese Revolution and Build the milestones of each period.
 Figure 4 System interface – secondary page
The bottom of the page shows the landmark buildings such as the national flag pole and the Monument to the People’s Heroes standing in sequence from north to south along Beijing’s central axis in Tiananmen Square. As a unified visual element, the linear illustration style clearly and concisely depicts the shape and characteristics of the building; the top-down plan on the right is convenient for users to choose travel routes. It is a pity that the design here is a bit of a pity. We could have combined the two, and selected and presented the features of the scenic spots on each route map through the comprehensive expansion of the floor plan. Hope to make more changes in the future.
 Figure 5 Visualization of attractions
Aiming at the characteristics of the above 584 classic red tourist attractions in China, highlighting the unique historical evolution and cultural attributes such as character representatives of the scenic spots, a statistical map is designed based on the historical character lines and time lines of the scenic spots. The specific pages are moved to the map with the mouse. Any administrative area will display the introduction of the red tourist classic attractions included in the province/city.
Epilogue
The National Red Tourism Classic Scenic Spots List was jointly released by 14 central, national ministries, commissions and bureaus including the National Development and Reform Commission and China Railway Corporation on December 19, 2016. There are 300 national red tourism classic scenic spots including Tiananmen Square in the list. ; Summarize and organize the names and provinces of the national red tourism classic scenic spots, as well as relevant historical backgrounds, introductions and pictures of characteristic buildings, etc.; through the open source map API, obtain accurate coordinates from the names of the scenic spots, and crawl the relevant introductions of the scenic spots from the provided web pages Do information design. In this project study, we deeply realized that the development of red tourist attractions in China will be more and more worth looking forward to.
The project time is limited, and a search function has been added to the system functions for users with specific goals; however, the content displayed on the secondary page is not systematic enough in terms of data integration. How to use interaction to effectively integrate historical evolution, occurrence of representative figures, and introduction of characteristic buildings , scenic spot plan and recommended content information for tour time? How to link the places where countless major political and historical events occurred, and how to integrate the historical witness of China’s decline and rise still needs to be considered. In addition, there are unavoidable omissions in data and design. I hope to exchange valuable opinions with readers, and also look forward to experts in related fields to give me some advice and criticism.
Course design “National Red Classic Scenic Spot”
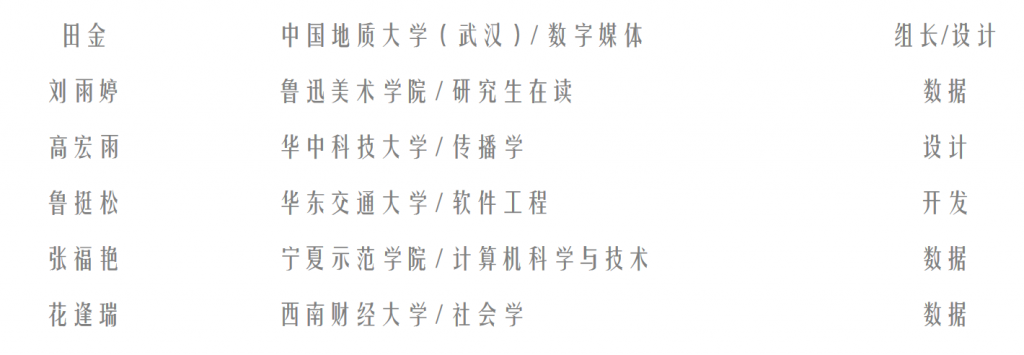
team member:

Instructors: Yuan Xiaoru of Peking University, Xu Ruige of Syracuse University
The excellent course design of the summer school will be successively included in the “Visualizing China” webpage
http://vis.pku.edu.cn/vis4china
Summer School webpage
http://www.chinavis.org/s22
This article is reprinted from: http://vis.pku.edu.cn/blog/national-classical-senic-spot-of-red-tourism/
This site is for inclusion only, and the copyright belongs to the original author.