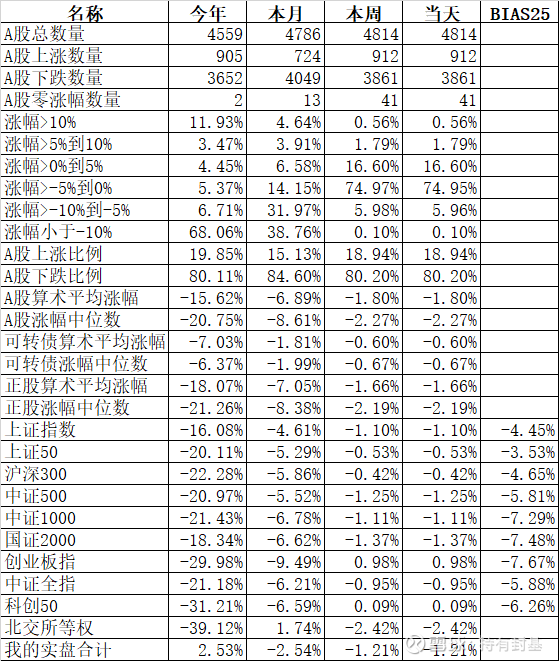
After 10:30 this morning, almost all broad-based indices turned red. I almost believed that the market went out of the independent market today. Unfortunately, the good times did not last long. By the end of the day, except for the Shuangchuang Index, which was still red, everything else turned green.

The ChiNext Index rose 0.83% today, the Kechuang 50 edged up 0.09%, the largest decliner, the National Securities 2000, fell 1.52%, the median decline of individual stocks was not 2.27%, and 3,861 stocks fell, more than the National Securities 2000 Index. . Mindray Medical, Oriental Fortune, Shanghai Pudong Development Bank, Zijin Mining, COSCO SHIPPING Holdings, Conch Cement, Pien Tze Huang, Salt Lake, Hengli Petrochemical, Sany Heavy Industry, China Communications Construction and other 515 stocks hit new lows this year.
In the industry sector, a few sectors such as hotels, catering, tourism, and winemaking rose, while most sectors such as oil, shipping, aviation, and diversified finance fell. The transaction volume continued to maintain the level of land volume. After three consecutive days of net sales, Beishang funds were net buys today. 4.277 billion.

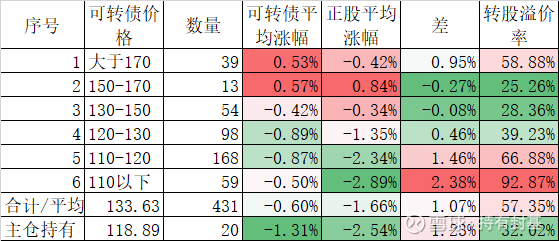
Today, the turnover of convertible bonds was 43.169 billion, which continued to remain low like stocks. High-priced convertible bonds rose on average because the underlying stock rose. Although low-priced convertible bonds below 110 yuan fell a lot, they fell not much because of debt protection. The biggest decline was the convertible bonds between 110-130 yuan. . And my position is exactly in this period. The Kao Convertible Bonds, which fell the most, fell by 3.74%, and the Zhengyu Convertible Bonds fell by 3.50%. The largest increase in Zhongxin convertible bonds, although the underlying stock rose 8.54%, but the convertible bonds rose only 2.47%. The account is down 1.21% today, significantly underperforming the equal-weight index’s -0.60%.
The market keeps falling and falling, how long will it fall, and where will it fall. While history does not simply repeat, it is always a reference.

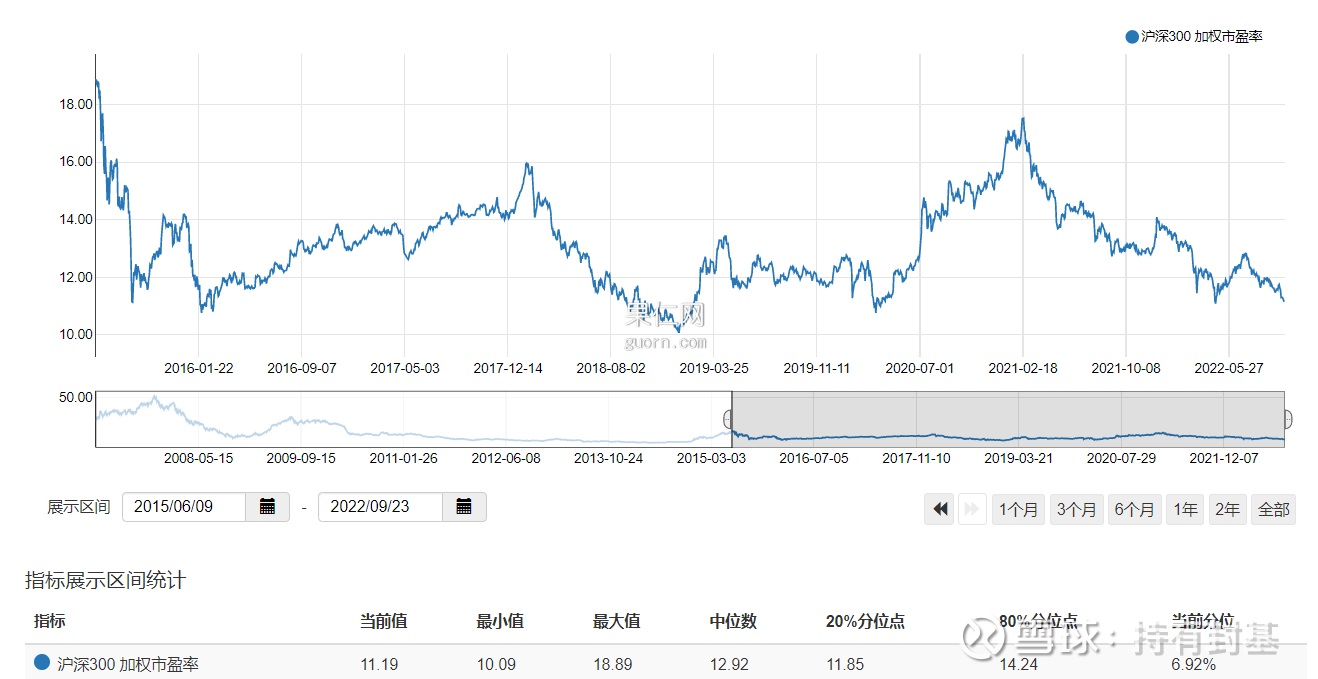
We can see that the CSI 300 Index fell 47.57% after 265 days from the intraday record of 5380.43 on June 9, 2015 to February 29, 2016, and bottomed at 2821.21, and then to January 26, 2018 The high of 4403.34, after 697 days, rose by 56.08%; after another 343 days to January 4, 2019, it fell by 33.33%; after another 776 days to the high of 5930.91 on February 18, 2021, it rose by 102.02 %, after 585 days to today, the closing price is 3836.68, down 35.31%. Compared with the previous two declines, regardless of time (585 days VS265, 343 days), declines (-35.31% VS-47.57%, 33.33%) are more than or close to the previous two declines.

Let’s look at the changes in the PE of the CSI 300 Index since June 9, 2015. The current quantile is already 6.92%, and it is very close to the historical bottom. It is relatively unlikely that it will fall further.
Of course, it is impossible to completely repeat past data in the future, but at least it is a reference. It’s not impossible to make a new low with inertia, but at least it won’t be too far from the bottom. Precise predictions are beyond our mortal ability, but vaguely correct is possible.
There are 32 discussions on this topic in Snowball, click to view.
Snowball is an investor’s social network, and smart investors are here.
Click to download Snowball mobile client http://xueqiu.com/xz ]]>
This article is reproduced from: http://xueqiu.com/6146592061/231589770
This site is for inclusion only, and the copyright belongs to the original author.