(1) Freight rate
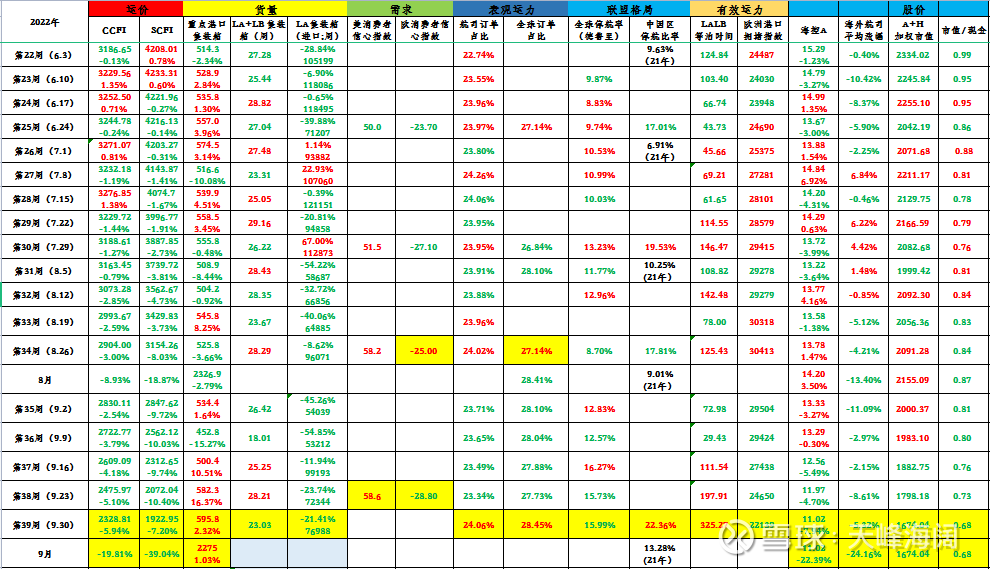
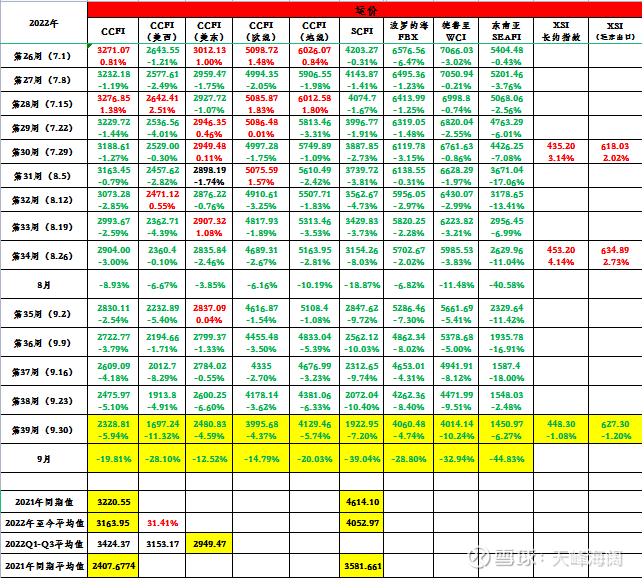
CCFI collapsed this month, dropping nearly 20%, from 2,904 in August to 2,328 at the end of September. Compared with the same period in 2021 (3220), it is already about 900 points lower. Such a rapid collapse makes the average value of CCFI not seem to be of great significance, but from the perspective of considering whether the profit relationship between CCFI and Haikong is still stable, let’s record the current average of 3163, which is higher than the average of the same period in 2021 (2407) 31%.
Since the historical peak of 3587 in February, CCFI has so far retreated 35.09%.
The collapse of SCFI was even more ferocious, with a drop of nearly 40%, which was almost the weekly limit, from 3887 in July to 1922 in September, just halfway through in two months. The current SCFI (cargo price) has been lower than CCFI (ship owner price) by about 400 points, about 17.5%.
On the spot side, both FBX and WCI have also accelerated their decline, with a drop of about 30%. Southeast Asia, as the first index to complete the halving, halved again on the basis of August, with a decline of 44.8%.
In terms of long -term contracts, the XSI long-term contract index fell for the first time in eight months, with a small decline (1%), but the XENETA report believes that the next continuous decline is inevitable.
In terms of routes , the western United States bears the brunt of the collapse in September, the eastern United States is relatively strong, and the European route may become the main force in the next round of decline.
In general, a hard landing of freight rates is a foregone conclusion. The situation in Russia and Ukraine and the monetary policies of Europe and the United States have greatly magnified people’s pessimism. The critical effect of port congestion has made freight rates “successful in the United States and West in failure”. The magnifying effect of the freight forwarder has brought about the peak season freight rate that may have fallen the worst in history. In fact, the old sailors basically know that it is inevitable that the freight rate will fall. Such strong winds and rains are really painful, but this is the only way to find a new steady state. So are freight rates bottoming out now? I don’t know, if we continue the previous thinking (from the SCFI-CCFI difference to see the freight forwarder’s affordability), the historical extreme value of (SCFI-CCFI)/CCFI appeared at about 40% in 2016, which is still 20% away from now. % distance. Of course, at the rate of September (of course I don’t think this is possible), it’s only a month away.
(2) Quantity
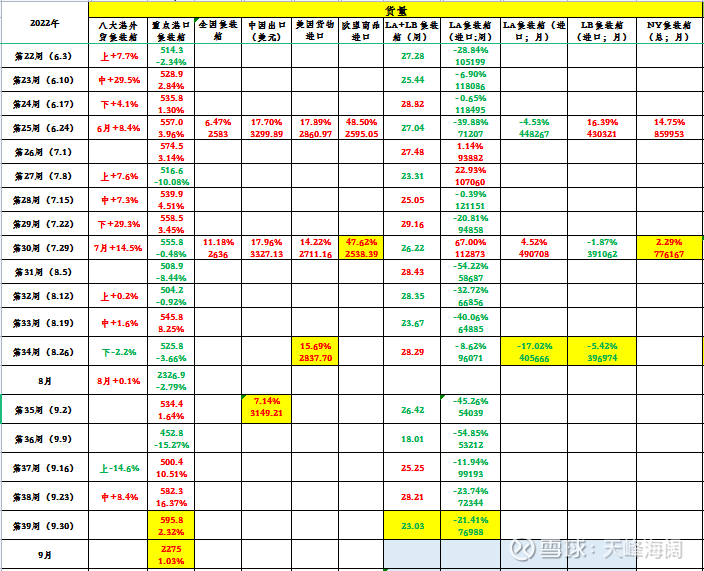
domestic data. ①In September, the container volume of key domestic ports was 22.75 million. On average, it actually increased by 1% from August. From the weekly situation and the ten-day data of the eight major ports, it can be clearly seen that there was a sharp drop in the first ten days of September (the official account of the Ministry of Communications explained that it was a typhoon factor), and it began to catch up in the middle and late ten days, and the total cargo volume was relatively stable. ②In August, my country’s export growth rate was 7.14% year-on-year, but compared with July, the growth rate dropped by about 10%.
foreign data. ①West America port. From the weekly data of LA, the volume of goods in September fell significantly year-on-year (especially in the first half of the month). Judging from the weekly data of Chuanshibao LA+LB, the weekly average in September was 242,000, which was 30,000 lower than the weekly average in August. From the monthly data, the cargo volume of LA ports in August fell by 17% year-on-year, and LB fell by 5.4% year-on-year. All in all, the lackluster ports in West America this year are the key to the changes in freight rates. ②East US port. The NY port data came out slowly, and it still maintained an increase of about 2% in July. ③ There is still no directional change in the data of US imports of goods (August) and EU imports of goods (July).
The general feeling is that, from the data point of view, the changes in the volume of goods and the changes in freight rates are not at the same level. Compared with the collapse of freight rates, the volume of goods is actually relatively stable. But why are freight rates so tragic? On the one hand, there are structural problems, mainly the existence of the success and failure of the United States and West; Taiwan Strait in August and typhoon in September) will cause the collapse of freight rates.
(3) Demand
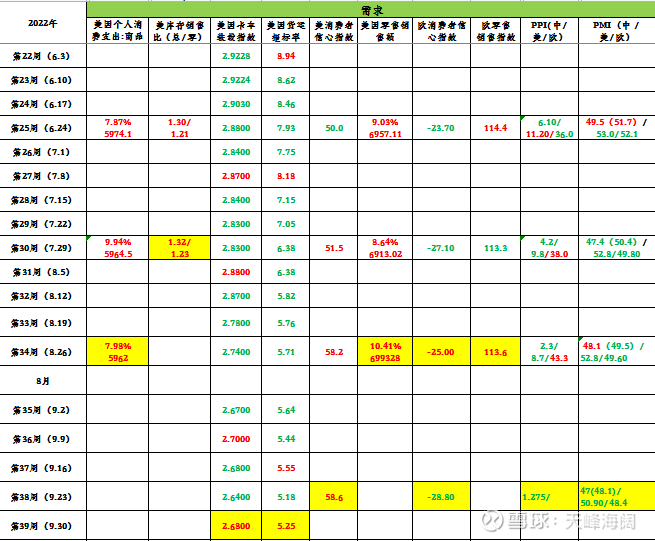
United States: ①In September, the US consumer confidence index rose to 58.6 in August, rising for the third consecutive month. ②In August, U.S. retail sales increased by 10.41% year-on-year; U.S. personal consumption expenditures on commodities (including durable goods and non-durable goods) increased by 7.98% year-on-year, which was not much different from that in July. down, the US purchasing power is still strong. ③ In August, the US inventory-to-sales ratio rose from 1.30 to 1.32, and the retail inventory-to-sales ratio rose from 1.21 to 1.23. ④ The US domestic freight indicators NTI (Truck Loading Index, which indicates the cost of trucks per mile) and OTRI (Rejection rate, which measures relative production capacity) have both increased, but it remains to be seen whether they bottom out.
Europe: ①The European consumer confidence index continued to decline, still at an ultra-low level of -20+. ②The European retail sales index remained stable.
Import substitution : ① In August, the European PPI continued to rise at a super high level, reaching an astonishing 43.3%, and the bombing of the Beixi pipeline will only add fuel to the fire. In contrast, my country’s PPI in August was only 2.3%, and it is forecast to fall further in September. ② In terms of PMI, all PMIs in China, Europe, and the United States in September fell month-on-month. As a leading indicator, this may indicate the possibility of a global economic recession.
(4) Apparent capacity (shipbuilding)
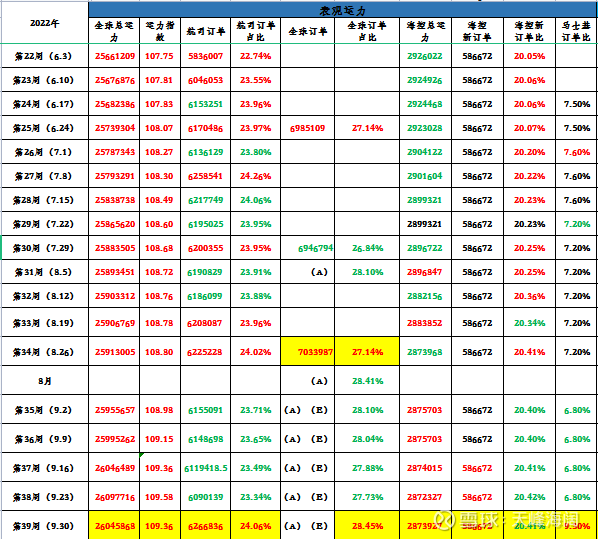
Capacity index: On June 30, 2020, the total capacity was 100. The capacity index at the end of September was 109.36, an increase of 0.56 from the August value of 108.80, which is a large increase.
Proportion of airline orders: The proportion of global airlines’ holding order capacity to total global capacity. At the end of September, the number of orders held by airlines increased by about 40,000 compared with August, accounting for 24.06%, which was a small change from the July value of 24.02%. However, it should be noted that in the first few weeks, with the delivery of new ships, hand-held orders fell, but in the last week, a large increase occurred and reversed. Among them, Maersk increased by 102,000, and the order ratio rose to 9.3%; CMA CGM increased by 72,000. Haikong remains unchanged.
Proportion of global hand-held orders: full-scale hand-held total orders, namely airline orders + ship owner orders. The original wind data was calibrated with the data provided in the official promotion materials of Haikong in early August. It is estimated that the current value will reach about 28.45%.
(5) Alliance pattern (suspended)
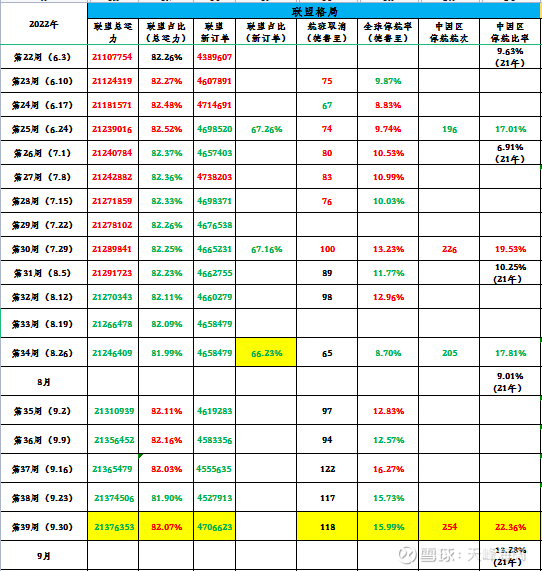
In September, the total capacity of the three major alliances accounted for 82.07%, which has increased compared with August. It is worth noting that the previous general trend is that the proportion of alliances is slowly decreasing (indicating that alliance outfield ships are increasing faster). If the trend reverses later, it may indicate that the wild ship has slowed down the pace of participation in the case of the collapse of freight rates.
Drewry’s global suspension rate in September reached the highest this year, rising from about 12% to about 16%. Compared with the first half of this year, the suspension rate has almost doubled.
It is easy to see the suspension of sailings in China . The number of suspensions increased in September, the number of suspensions reached 254, and the proportion of suspensions reached 22.36%, which has also shown an upward trend in recent months.
At present, alliances or airlines are still working hard to adopt the strategy of suspension of flights. Although it is a drop in the bucket before the collapse of freight rates, if this strategy can be maintained, it will be beneficial to the steady maintenance of freight rates.
(6) Effective capacity (port blocking)
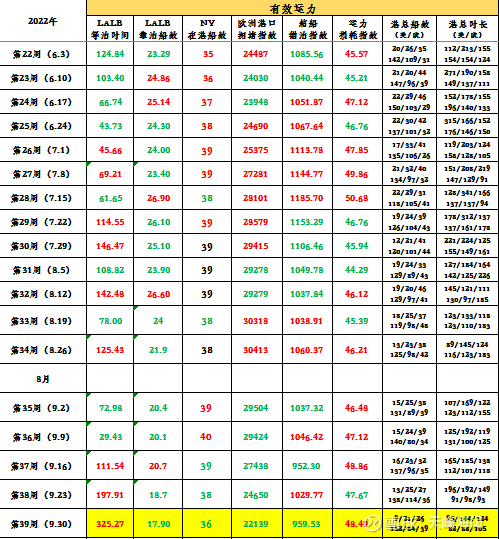
①Western America: Late August to early September is the period with the lowest congestion level. The LALB waiting time in the week of September 9 was the lowest of 29 hours this year. After late September, the waiting time increased significantly, but the number of waiting ships was reversed. decline.
②East of the United States: The congestion situation in NY is just the opposite. It is still relatively congested from late August to early September, and the number of ships in the port has decreased after late September. I wonder if it reflects the fact that ships are starting to choose more from the East to the West?
③Europe: Port congestion continues to decline rapidly, and the strike in Europe cannot become a super shortcoming like last year in the United States and West.
(7) Stock price
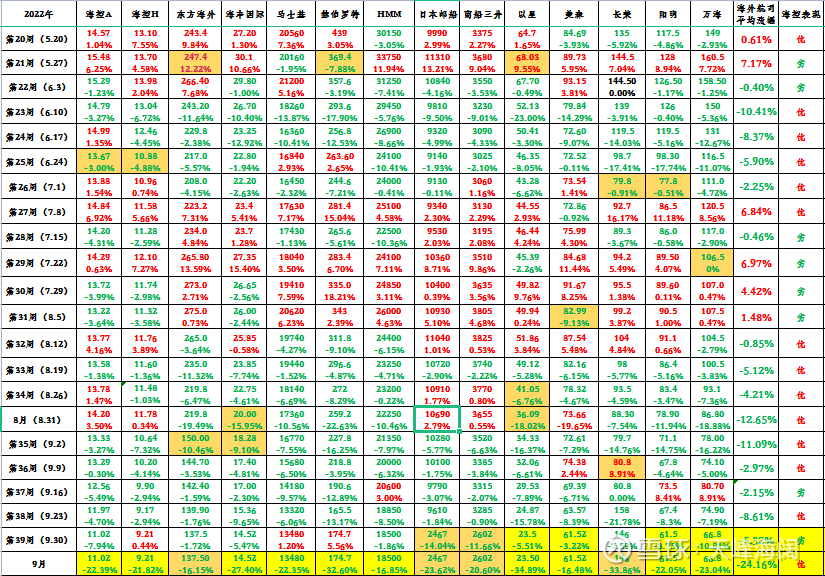
In September, Haikong A-22.39% significantly underperformed the broader market (-5.55%), which is almost the same as Haikong H (-21.82%), and it is difficult to be compared with Overseas Consolidation (-24.16% on average). During the National Day, the external market ushered in a rebound, and I hope Haikong will follow after the A festival. . .
With the collapse of freight rates, overseas airlines are also big bears and bears. The monthly decline of 20% is the starting level (including the stock split of Nippon Yusen and the 10-to-4 shares of Evergreen, which have been considered in the calculation), the rise and fall of this year and the rise and fall of one year. All panels have been pulled green.
Changes this year: Haikong A fell by 36%, Haikong H fell by 32%, and overseas airlines fell by an average of 19%.
One-year change: Haikong A fell by 31%, Haikong H fell by 14%, and overseas airlines fell by an average of 5%.
On September 30, the actual total market value of Haikong was 167.4 billion (A share price * A share capital + H share price * H share capital * Hong Kong dollar exchange rate).
The balance of financing was 7.543 billion, a decrease of more than 700 million in a single month.
AH premium 24%. Dongfang / Haikong H ratio narrowed to 59%.
Calculated based on the interim report data:
The current cash on the account is 247.863 billion yuan; the net assets are 186.653 billion yuan; and the interest-bearing liabilities are 65.150 billion yuan. Net profit in the last four quarters was 116.697 billion yuan; EBIT in the last four quarters was 215.823 billion yuan.
Calculate this:
At present, Haikong PE (TTM) is 1.43 times; PB is 0.90 times, EV (enterprise value = equity value + interest-bearing liabilities – cash) is already negative, EV/EBITDA is -0.19, and the market value to cash ratio is 0.68.
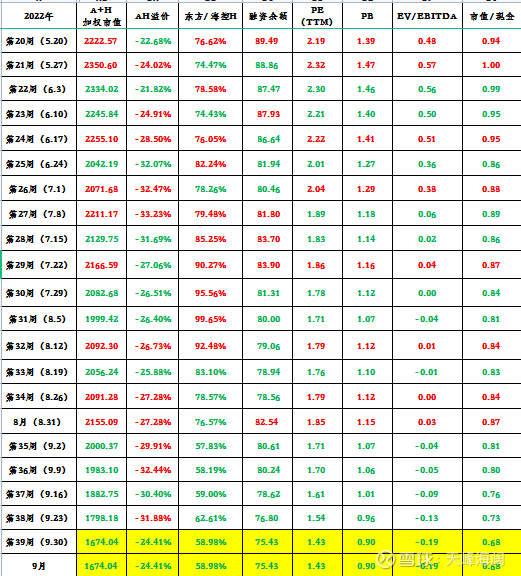
The big A’s advance game and the hard landing of freight rates have jointly created an unprecedented oversold stock price. The cash on the account has already been discounted by 30%, do you want to get a 50% discount next?
@沙神波黑东@张平平@陳平@鳳館 eld @Red Scarf Legend @王永52 @雪絊@海韓場海手@海天一色@外语录terryshi @rexmei @FAT brother 99 @There are mines in the opposite heights @Run Brother @博文Invested Xiaoqiang @calm like water_rongda@雪山飞虎包@top_gun888 @fight it Jarvis
$COSCO SHIPPING Holdings(SH601919)$ $COSCO SHIPPING Holdings(01919)$ $Orient Overseas International(00316)$
This topic has 154 discussions in Snowball, click to view.
Snowball is an investor’s social network, and smart investors are here.
Click to download Snowball mobile client http://xueqiu.com/xz ]]>
This article is reproduced from: http://xueqiu.com/7423053705/232177408
This site is for inclusion only, and the copyright belongs to the original author.