
In yesterday’s “Tsinghua University Press” video conversation, the host asked me what simple and easy investment strategies ordinary people have. I talked about an annual rebalancing strategy for stocks and bonds, because it is difficult to show more in the video The data, also because of the time relationship did not expand. Today we will discuss it in detail.
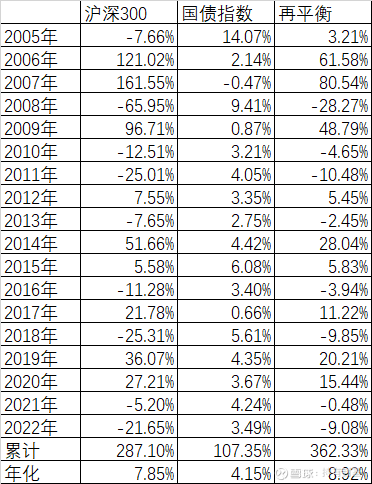
We still use two targets first, the Shanghai and Shenzhen 300 Index (000300) and the National Bond Index (000012). The Shanghai and Shenzhen 300 Index started from 1,000 points on December 31, 2004, and has risen by 287.10% in 18 years, with an annualized rate of 7.85%. In the same period, the national bond index rose by 107.35%, with an annualized rate of 4.15%.
We assume that at the close of the market on December 31, 2004, 50% of the funds were used to buy the CSI 300, and 50% of the funds were used to buy the national bond index. At the end of the year, there was only 500*(1-7.66%)=461.73 yuan, the amount of the national bond index=500*(1+14.07%)=570.34 yuan, and the total amount became 1032.06 yuan. Rebalancing is to make the ratio of stocks and bonds return to 1: 1, that is to say, the amount of both is equal to 1032.06 yuan. Then the national bond index needs to sell 570.34-516.03=54.31 yuan, and then buy the 54.31 yuan into the Shanghai and Shenzhen 300 index, so that the amount of both is 516.03 yuan, and the annual balance is reached again. Of course, for the sake of simplicity, fees such as commissions are not considered here.
In this way, a brainless rebalancing is done at the end of each year, and the cumulative yield is as high as 362.33%, which not only exceeds the 107.35% of the national debt, but also exceeds the 287.10% of the CSI 300.
So where does this excess return come from? It still mainly comes from the sharp rise and fall of the Shanghai and Shenzhen 300 Index.
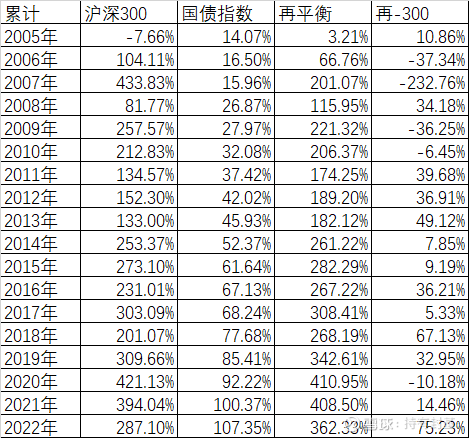
From the cumulative return rate in the above table, we can see that every time the Shanghai and Shenzhen 300 Index fell, the rebalancing obviously caught up with the Shanghai and Shenzhen 300. At the end of 2007, when the rebalancing lagged behind the most, the Shanghai and Shenzhen 300 Index was three years old. It has already risen by 422.83%, while the rebalancing strategy only rose by 201.07% in the same period, a full 232.76% behind. However, the subsequent sharp drop in the Shanghai and Shenzhen 300 Index in 2008 made the 4-year cumulative drop to 81.77%. Rebalancing because the fall is much less, the cumulative 115.95% in 4 years, which suddenly exceeded the cumulative CSI 300 Index of 34.18%. Every subsequent bear market is a process of rebalancing and continuous surpassing. Until December 2, 2022, the rebalancing strategy in the past 18 years has surpassed the Shanghai and Shenzhen 300 Index by 75.23%.
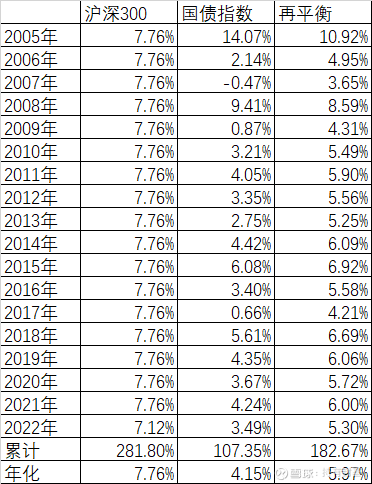
Let’s make another assumption, assuming that the Shanghai and Shenzhen 300 Index is rising at an average rate every year, then it has risen by 7.76% every year in the past 17 years. This year, because there are still 4 weeks of trading, it has risen by 7.12%. Unchanged, in this way, the result of rebalancing is that the accumulated rate of return for the past 18 years has dropped to 182.67%, while the 18-year average of the Shanghai and Shenzhen 300 and the national bond index is (281.80%+107.35%)/2=194.58%, The result of rebalancing is worse than not doing it.
So we can know from the discussion here that the large fluctuations of the Shanghai and Shenzhen 300 Index have brought excess returns to rebalancing. Without volatility, there is no excess return.
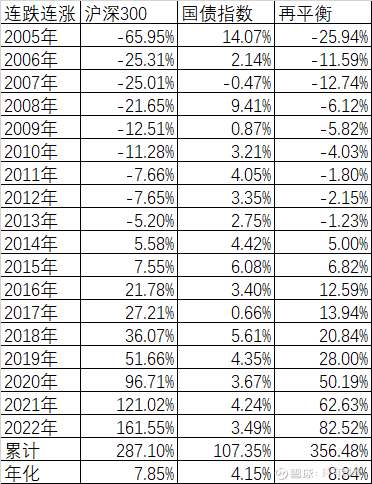
Let’s discuss another question, if there is a continuous rise and fall, will it change the conclusion? In the past 18 years, the Shanghai and Shenzhen 300 Index has risen in 9 years and declined in 9 years. Assuming that the annual increase remains the same, it is just that the annual rise and fall are sorted according to the increase. For example, assume that 2005 is the year with the largest decline (In fact, it is the decline in 2008), year by year, and so on, the cumulative increase in the past 18 years is still 287.10%, and the annualized rate is still 7.85%. After calculation, we found that the cumulative rebalancing is still 356.48%, still It has not changed, but the key is that if the real rise and fall is like this, almost no one can persist in the 9-year consecutive decline, and the 9-year consecutive rise, there must be people who continue to increase their positions to high levels.
The above assumption is to rise after falling. If it rises first and then falls, the result is the same, so I won’t repeat it here.
But whether it is the Shanghai and Shenzhen 300 Index or the National Bond Index, it is just an index and cannot be invested. Let’s choose two real funds with a long time to replace the index and see how the effect is?
Here, the Bosera CSI 300 Index A (050002) is used to replace the CSI 300 Index, and the Huabao Health Bond (240003) is used to replace the national bond index. The calculation results are as follows:
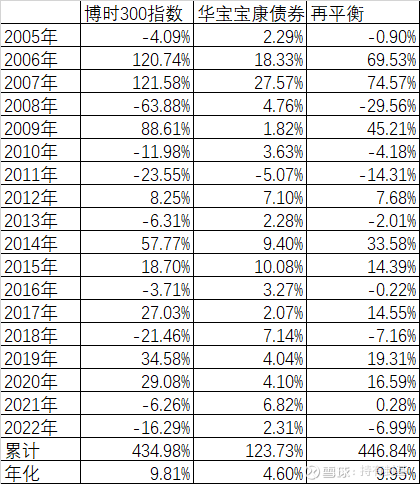
First of all, we can see that the cumulative yield of Bosera 300 is 434.98%, which exceeds the 287.10% of the CSI 300 in the same period, and the cumulative yield of Hwa Baokang bonds is 123.73%, which exceeds the 107.35% of the national bond index in the same period. 446.84%, which is also higher than 434.98%, but not much. The main reason for the small excess is that the index fund’s decline is less than the index’s decline when it falls.
What if we swapped index funds for active actives? Here is the Huabao Health Consumption (240001) that takes a long time:
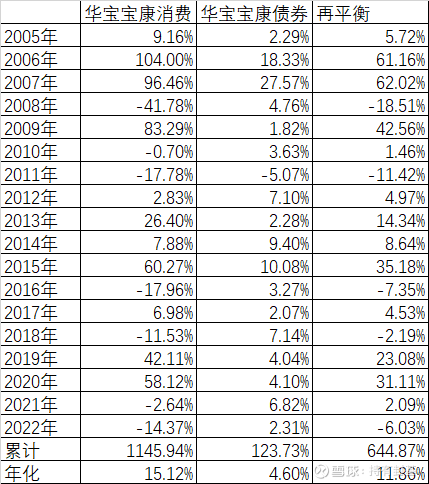
This time we finally found that the cumulative return of rebalancing was 644.87%, which did not outperform the 1145.94% of active funds in the same period, but still outperformed the average of 634.83% without rebalancing. The reason is that active funds did not fall much in the big bear market. For example, in 2008, the Shanghai and Shenzhen 300 Index fell by 65.95%, Bosera’s 300 Index Fund fell by 63.88%, and Huabao Health Consumption fell by 41.78%; In 2019, the CSI 300 Index fell by 25.31%, the Bosera 300 Index Fund fell by 21.46%, and Huabao Health Consumption fell by 11.53%. fell by 16.29%, while Huabao’s health consumption fell by 14.37%.
That is, there is a paradox in rebalancing: the worse the performance of the species, the better the rebalancing effect. Of course, this difference is not a difference that has fallen all the way, but a difference of several years. This is similar to fixed investment. The effect of fixed investment with big rise and fall and long-term upward trend is the best.
So in the long run, in addition to the broad-based index, consumption, pharmaceuticals and other long-term industries, although the adjustments have been severe in the past two years, whether it is rebalancing or fixed investment, it may be the best effect.
In addition, the purpose of rebalancing stocks and bonds is not only to increase the yield, but more importantly, to reduce the drawdown. Taking 2008, the largest bear market year in history, as an example, the Shanghai and Shenzhen 300 Index fell by 65.95%. The national debt rose by 9.41%, but it only fell by 28.27% that year, which is similar to the decline in 2018 and 2022. However, your assets have fallen by 65.95% in full, and not many people can sleep peacefully at night.
The strategy of rebalancing such a simple and mindless operation should be a strategy that ordinary people can use. Everyone can choose the method that suits them according to their own expectation of return rate and risk tolerance of retracement.
There are 93 discussions on this topic in Xueqiu, click to view.
Snowball is an investor social network where smart investors are all here.
Click to download Xueqiu mobile client http://xueqiu.com/xz ]]>
This article is transferred from: http://xueqiu.com/6146592061/236933604
This site is only for collection, and the copyright belongs to the original author.