
In fund investment, an important reason for the bad holding experience is that one’s own expectations do not match the actual situation. There are often times when the ideal is full when buying, but after holding for a period of time, the reality is found to be very weak. feel. For example, your expectation is that you can buy a luxury bag from the Internet for a few hundred dollars, but the reality is that most of what you buy is a counterfeit product. How can you buy a luxury bag for a few hundred dollars? In fund investment, the information of the buyer and the seller is seriously asymmetric. After all, from the perspective of the seller, Wang Po sells melons, sells melons, sells and boasts, and more is to promote her own benefits, and even over-promote. High returns can be achieved within a short period of time, because financial products often cannot be verified in the short term, and the authenticity of the product will be verified in time, so this phenomenon will become more common. It was too late, firstly, losses had been incurred, and secondly, time was wasted.
Therefore, the purpose of this article is to conduct statistics and analysis on historical data based on the performance evaluation benchmarks of fund investment consultants constructed before, hoping to enable you to have an objective and practical understanding of the actual returns and risks of fund investment, so as to avoid such Bad holding experience caused by cognitive bias.
different holding periods
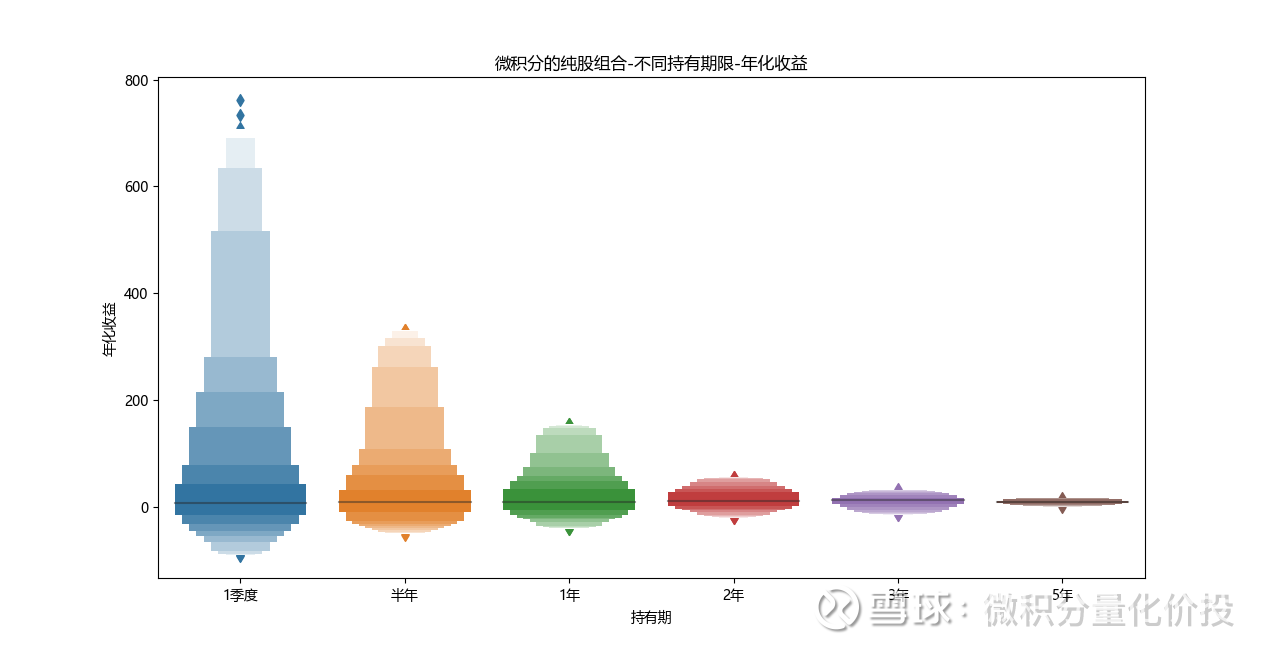
First of all, let’s look at the returns and risks of buying and holding for different periods of time in any period of time. Because the pure stock portfolio has the largest fluctuation, it is most suitable as a sample for analysis. For the pure stock portfolio of calculus, the calculation is to buy at any point in time, and then hold it for different time periods (1 quarter, three months, each month is calculated as 21 trading days, and a year is calculated as 252 trading days Calculated) the annualized return and the maximum drawdown.
First of all, from the perspective of annualized income, when the holding time is relatively short, the annualized income will be particularly large, and sometimes the annualized income may exceed 4 times. This is mainly due to good luck, buying at the bottom of the market, Then it more than doubled in a quarter, and almost quadrupled after annualization. It can be observed that as the holding time increases, the head-to-tail difference of the annualized returns purchased at different time points gradually decreases.
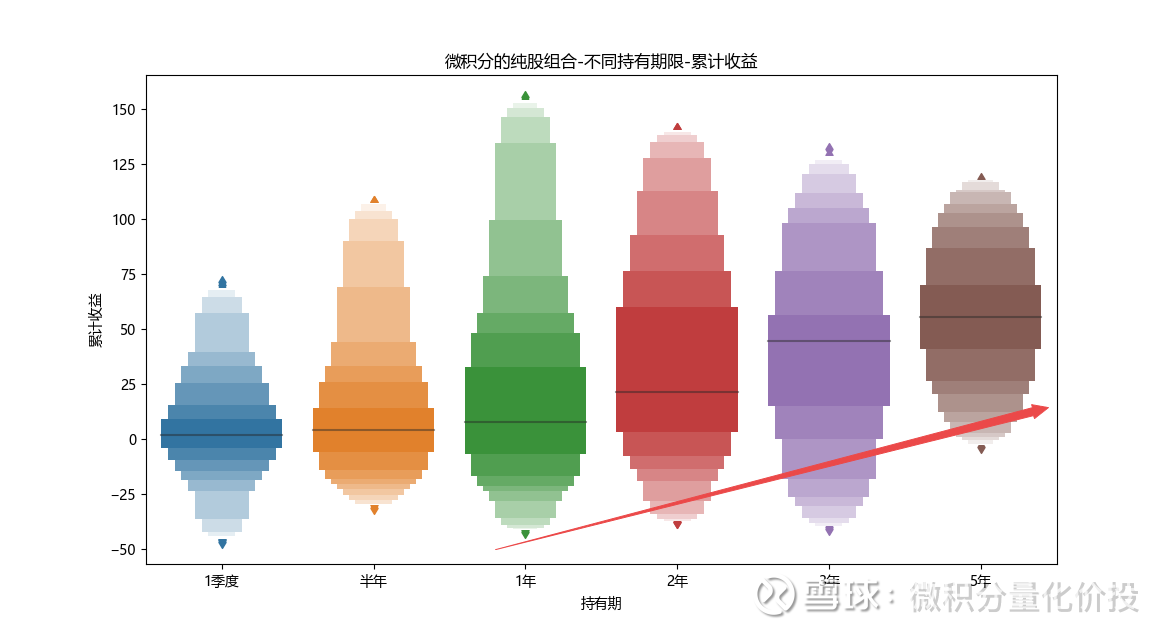
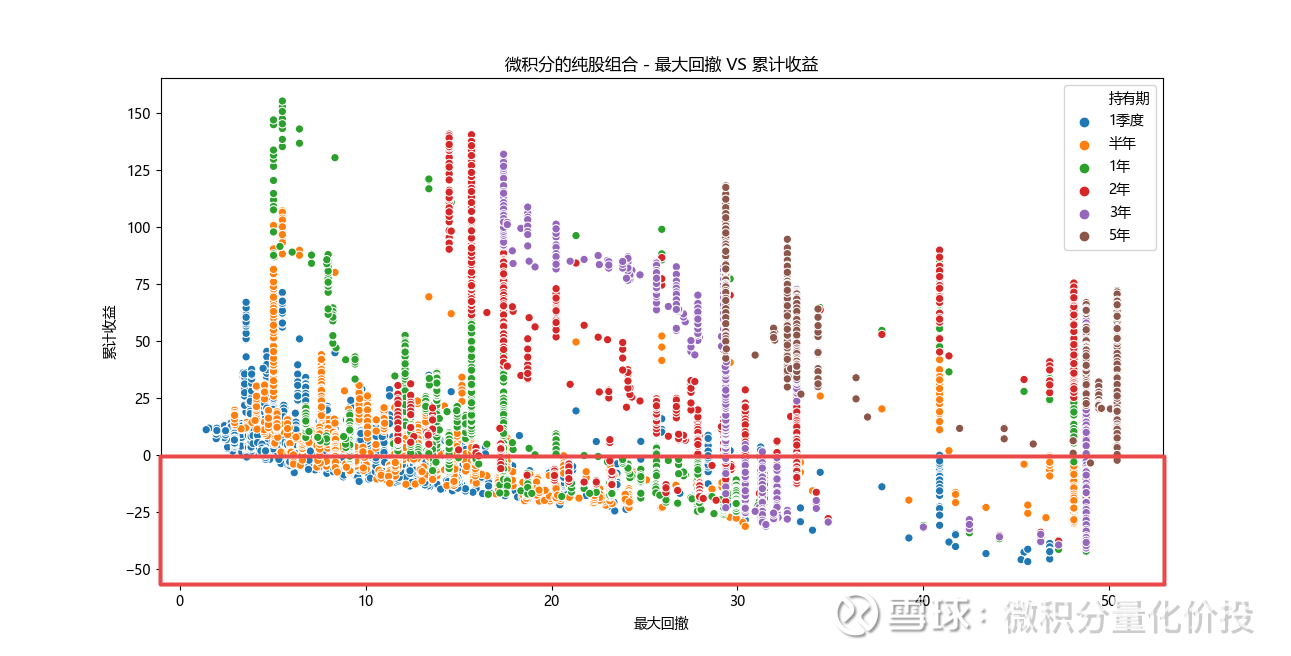
Because the income gap caused by annualization is particularly large, consider from the perspective of cumulative income: as the holding maturity time increases, the corresponding average income also increases, and the probability of loss, that is, the number of samples with cumulative income lower than 0 also increases. is decreasing. Increasing the holding time can indeed increase the cumulative return. This is also emphasized in various fund research white papers to increase the holding time, and the probability of positive returns will be higher. The more obvious comparison is the situation of holding for one quarter. Basically, the difference in the number of profit and loss samples is not large, and it is almost halved. This shows that pure stock fund investment is not suitable for short-term investment.
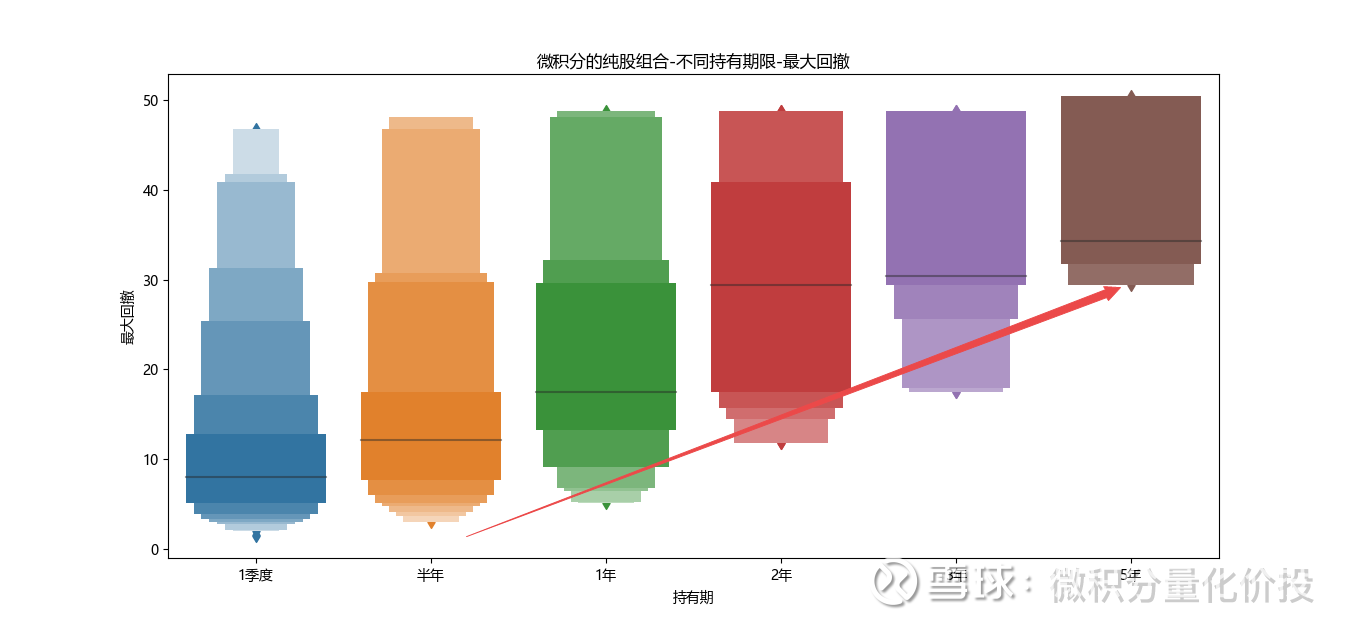
From the perspective of the maximum retracement, as the holding time increases, the corresponding maximum retracement is also increasing, because the maximum retracement only reflects the retracement of some ranges, so the maximum retracement in the first quarter may also be the highest, for example It happened to be sold at the highest point of the bull market. At this time, the maximum retracement of holding for one quarter, one year, or even two years may be the same.
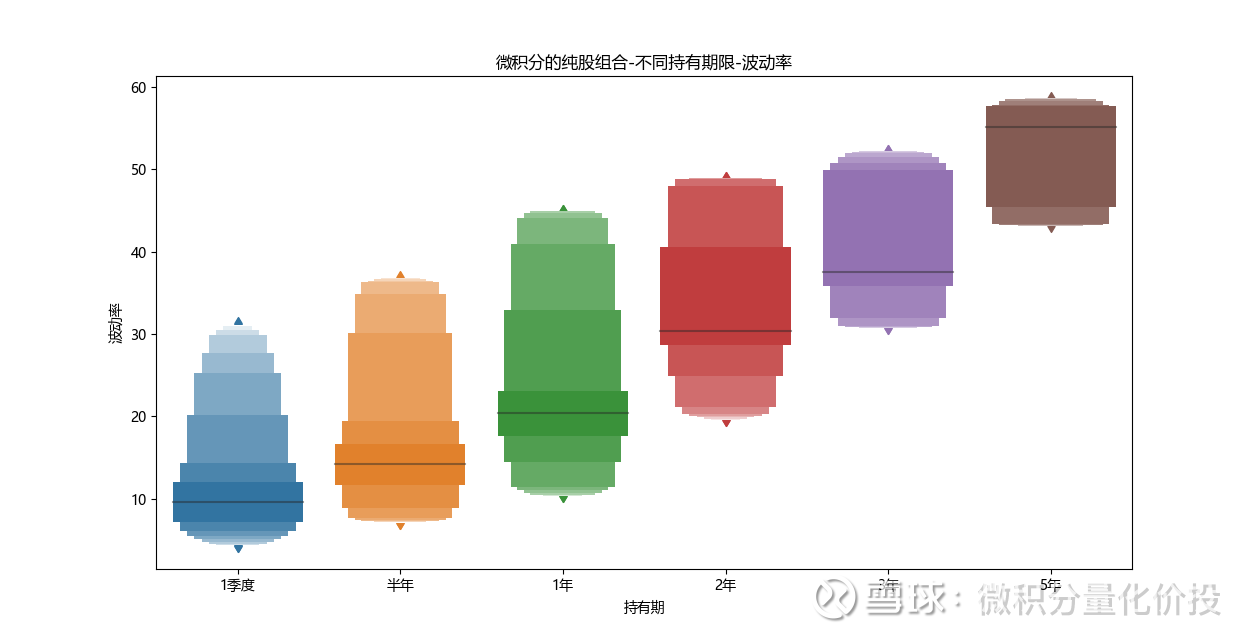
But from the perspective of volatility, the difference is obvious. As the holding time increases, the volatility of the entire portfolio also increases significantly. That is, increasing the holding time to obtain higher returns is not a free lunch. It is accompanied by an increase in the corresponding volatility. The annualized volatility is so high that not all investors can bear it.
Let’s look at the further distribution. From the perspective of the distribution of annualized returns and maximum drawdowns, first look at the blue points, that is, hold for a quarter, and the distribution on the graph is very wide, but if the holding period reaches 5 years, the entire sample point will be relatively large. Relatively concentrated.
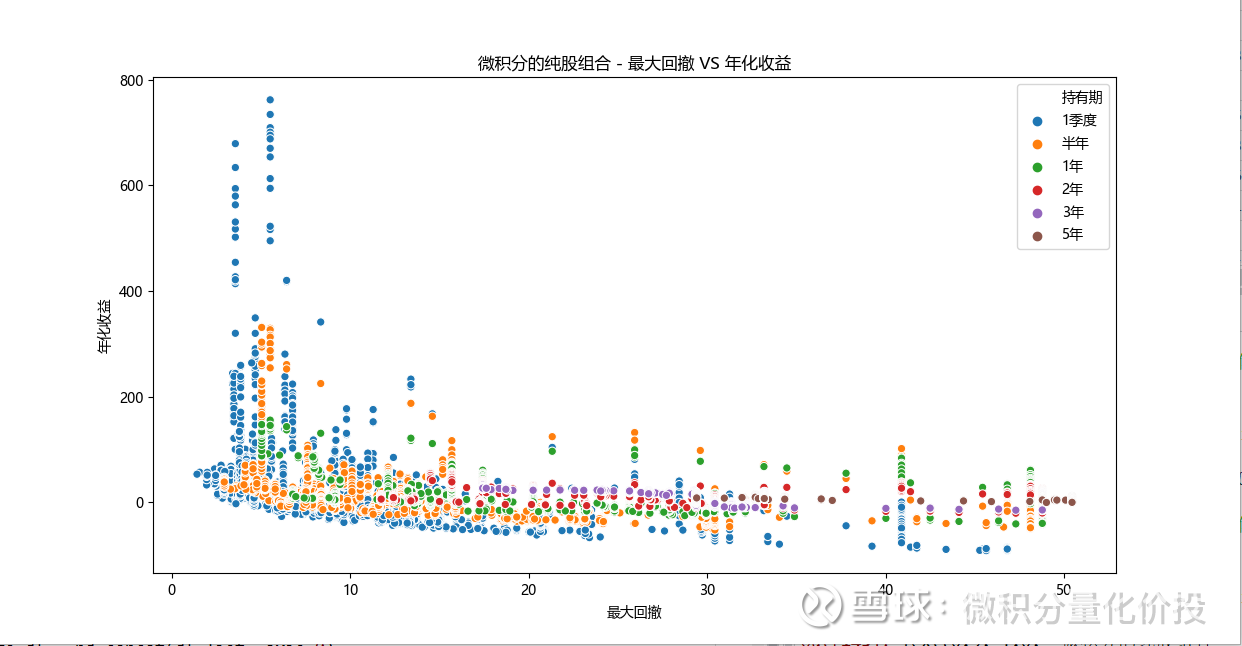
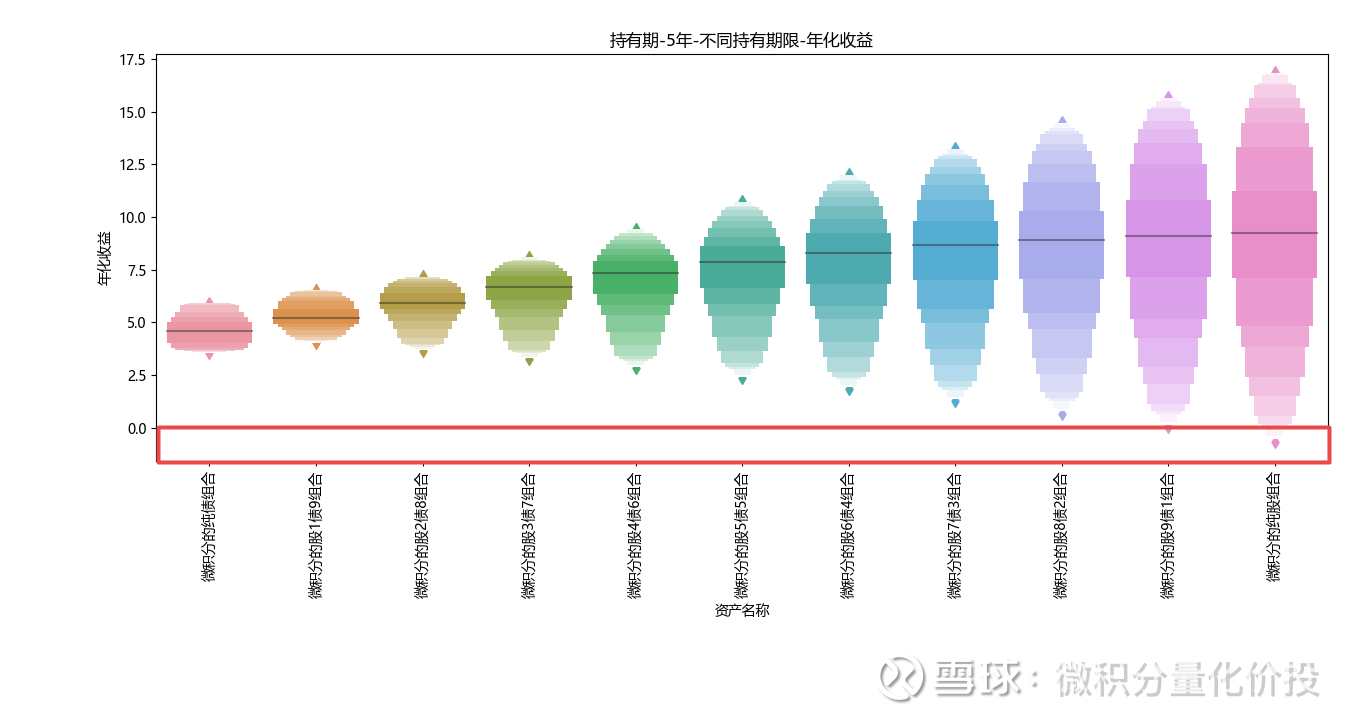
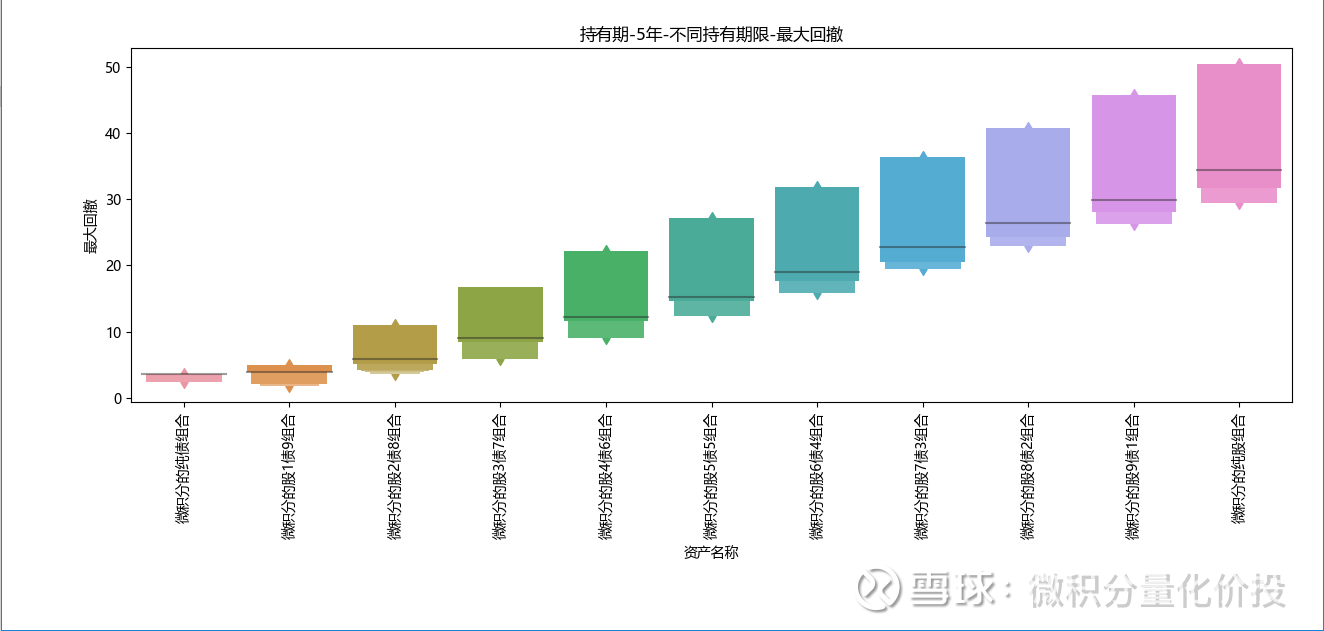
From the statistical data, the area of loss, that is, the area marked by the red rectangle, if it is held for 5 years, there are basically no sample points, but the corresponding maximum drawdown is relatively large.
If the risk evaluation indicator is replaced by volatility, the difference is even more obvious:
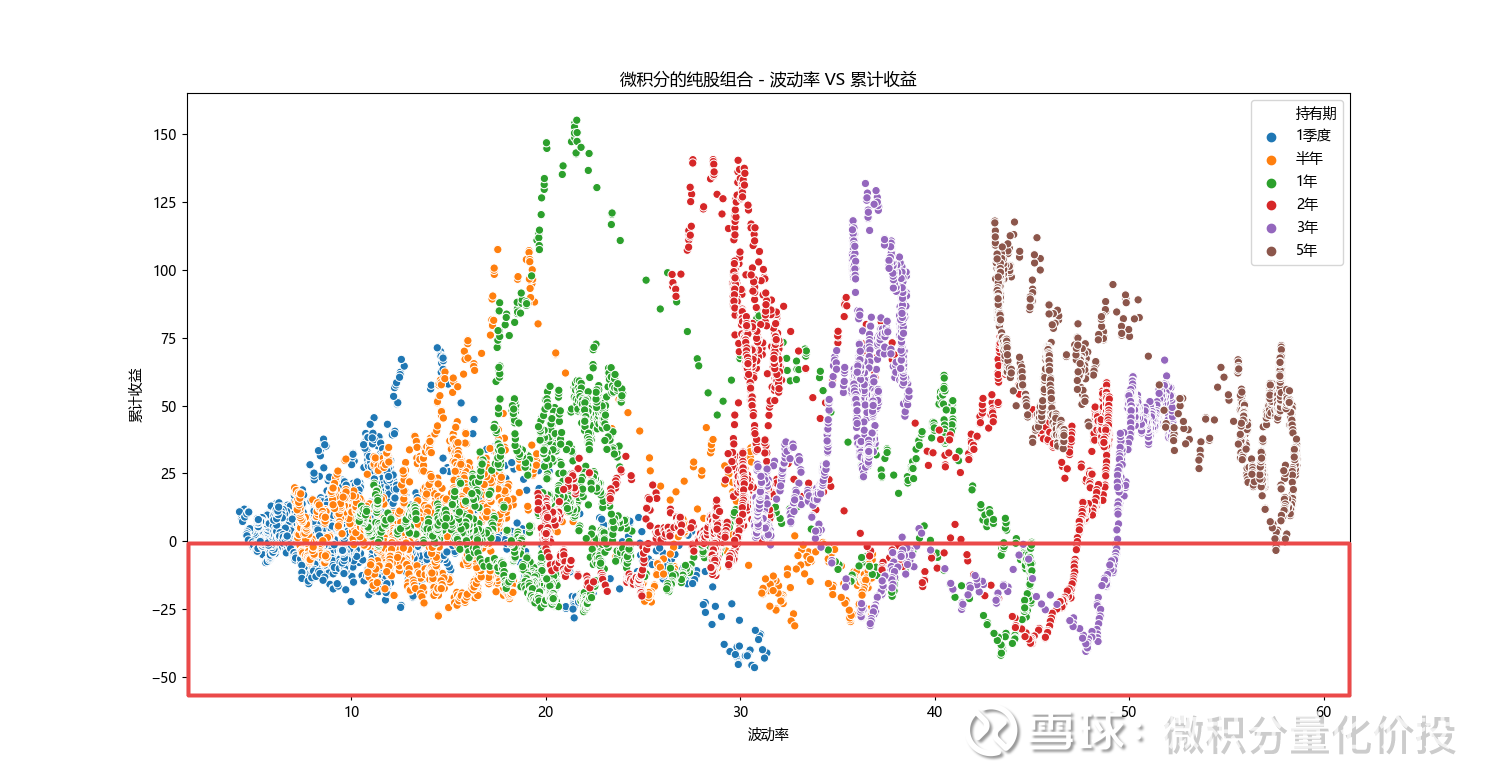
Therefore, many promotional materials are right that the longer the holding time, the higher the corresponding rate of return, but what they don’t tell you is that the increase in the holding time will also increase the corresponding volatility and maximum retracement significantly. Whether your own risk appetite can bear this kind of fluctuation needs to be carefully evaluated by yourself.
same holding period
The above considerations are the return and risk levels of the same asset in different holding periods. Let’s analyze the return and risk of different asset portfolios under the same holding period.
hold for a quarter
If you only hold it for one quarter, it is more obvious that with the increase in the proportion of equity assets, the difference between the head and the tail of the annualized return is also getting bigger and bigger.
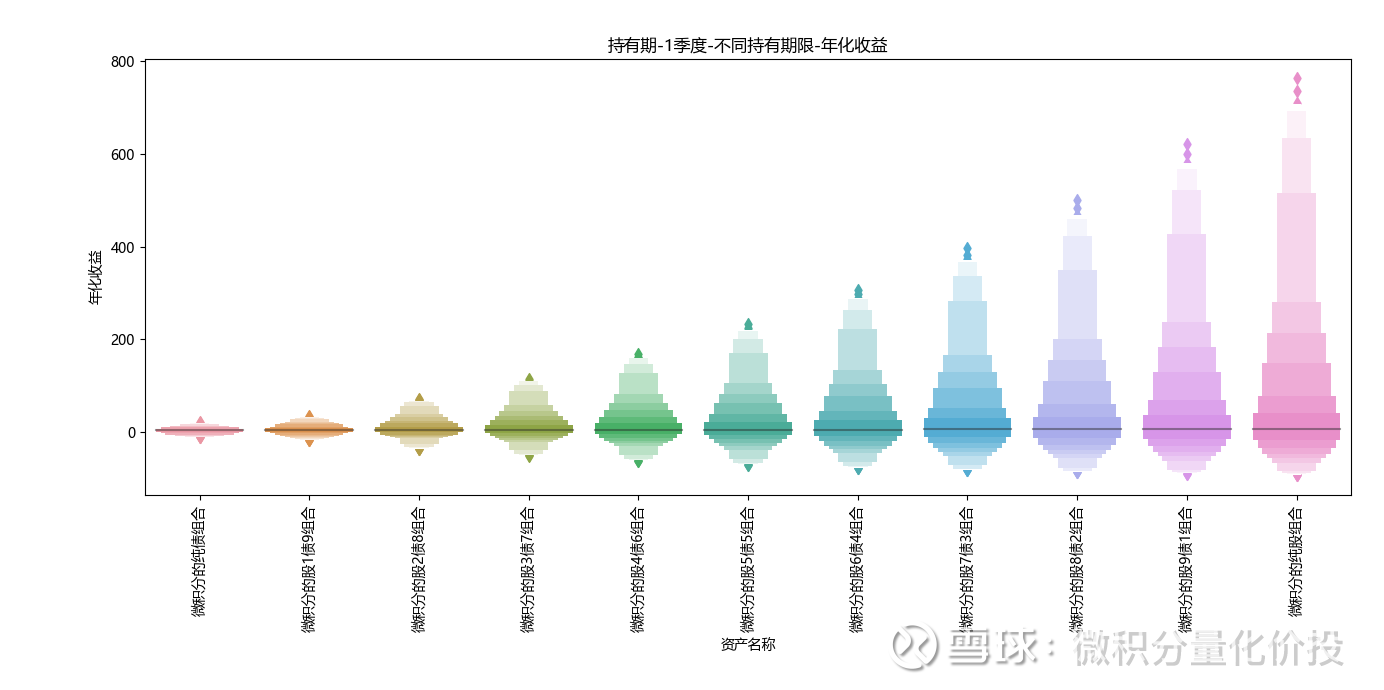
The corresponding volatility and maximum drawdown also increased overall.
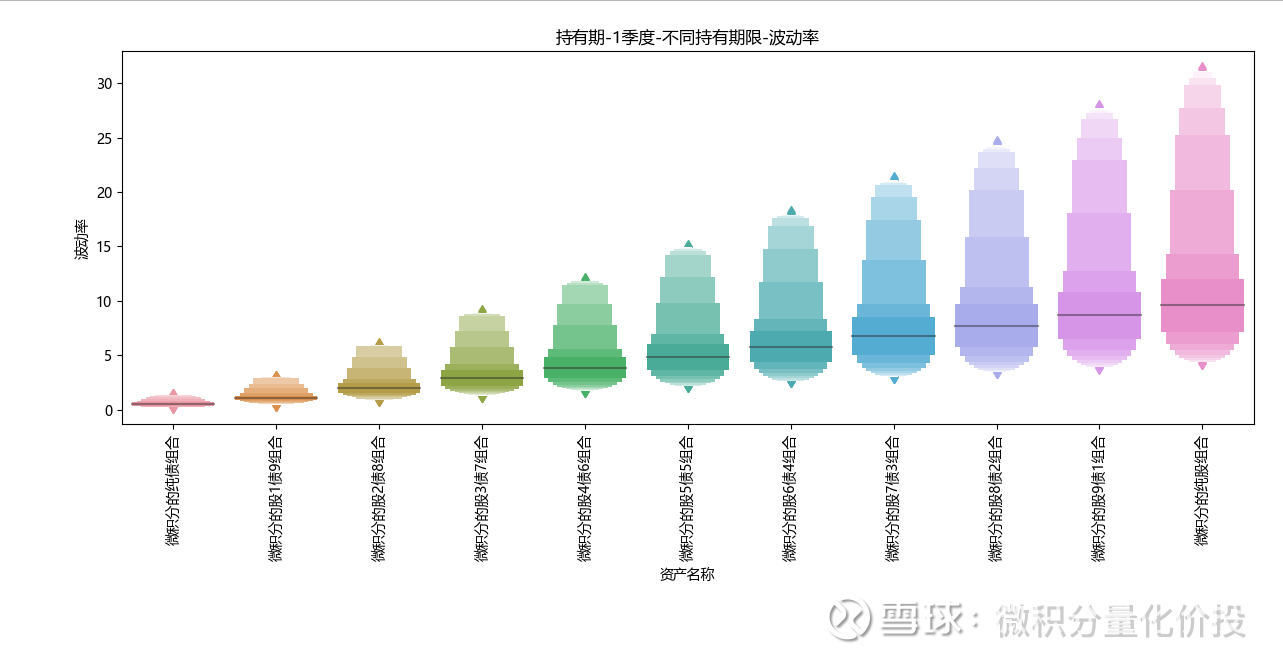
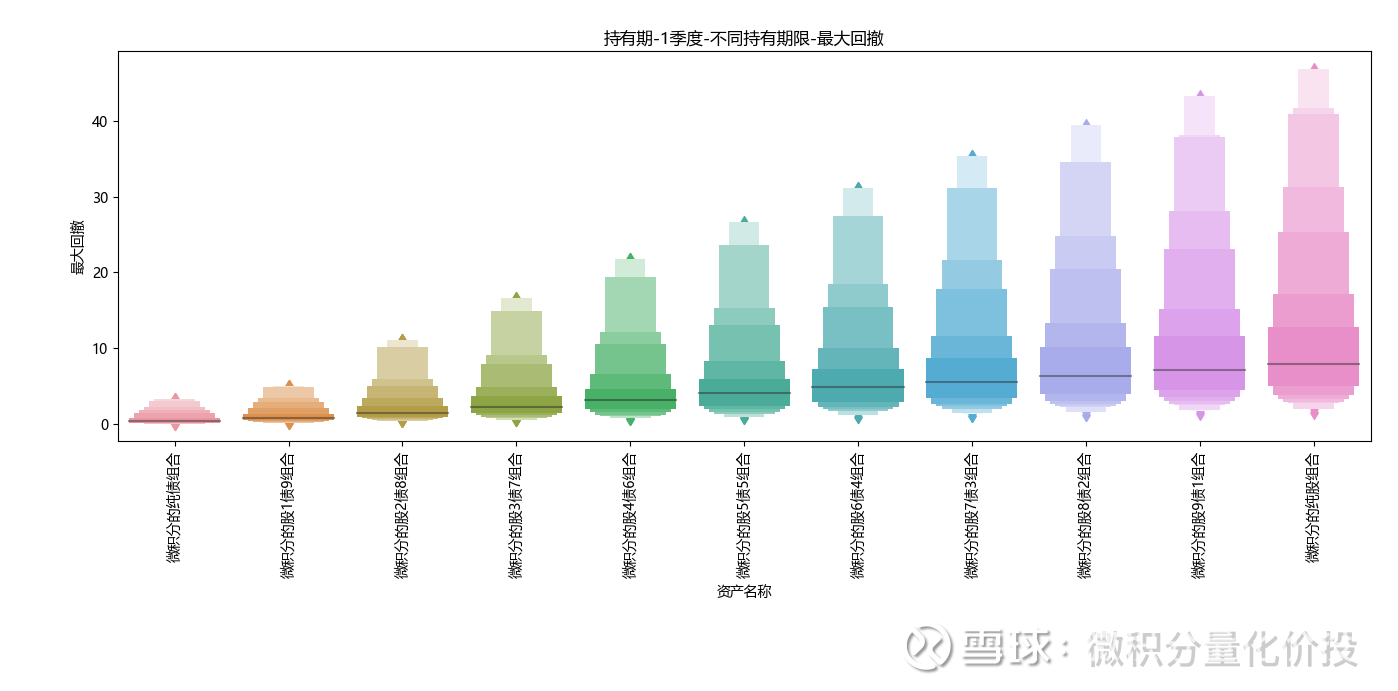
hold for 5 years
If it is held for 5 years, the overall probability of losing money is very small, and with the increase of equity assets, the median annualized income also increases significantly, and this increase is more obvious in the early stage, especially in equity When the weight of assets is below 70%.
From the perspective of volatility, with the increase of equity assets, the corresponding maximum retracement and volatility are also significantly increased.
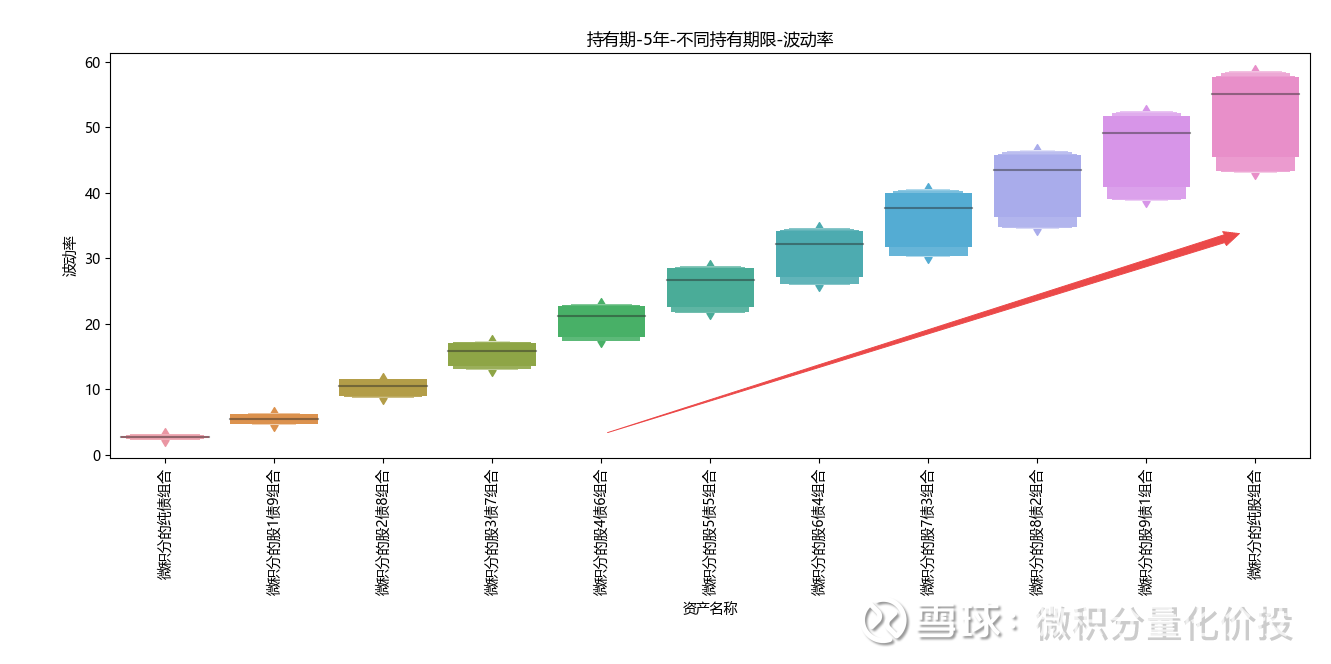
From the perspective of different holding periods, with the increase of equity assets, the overall income is increasing, and the corresponding portfolio volatility and maximum drawdown are also increasing. There is no free lunch in the world.
Investment map
Based on the above historical data and investors’ investment needs, we can analyze whether the current fund allocation can meet specific needs.
Here are a few common needs that I collected and sorted out:
Fixed income + configuration
The common fixed income + allocation type is the asset allocation type of shares 2 bonds 8. First of all, let’s look at the simplest demand, the demand of not losing money. From the perspective of different holding periods, if you only hold for one quarter, there is still a certain percentage of losses, but as the holding time increases, the probability of loss decreases. , especially if you hold it for more than 3 years, there is basically no probability of losing money.
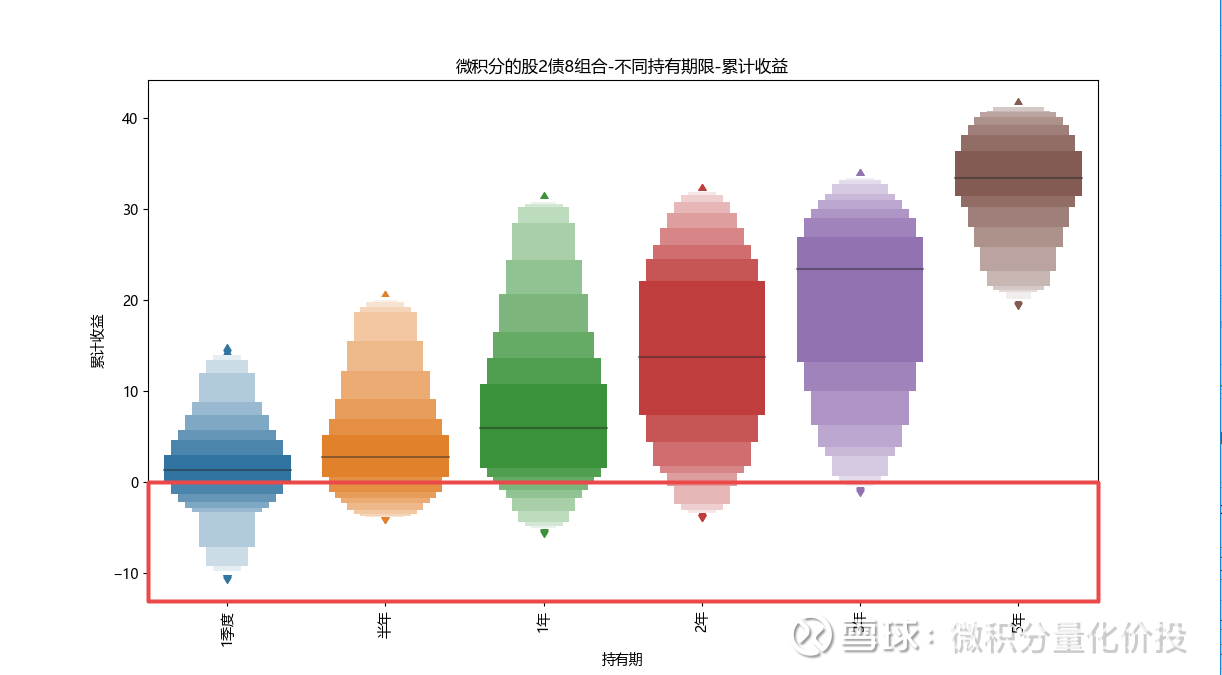
If you only look at the annualized return, the long-term annualized return is 5%-7%, and the overall return can still outperform the monetary fund.
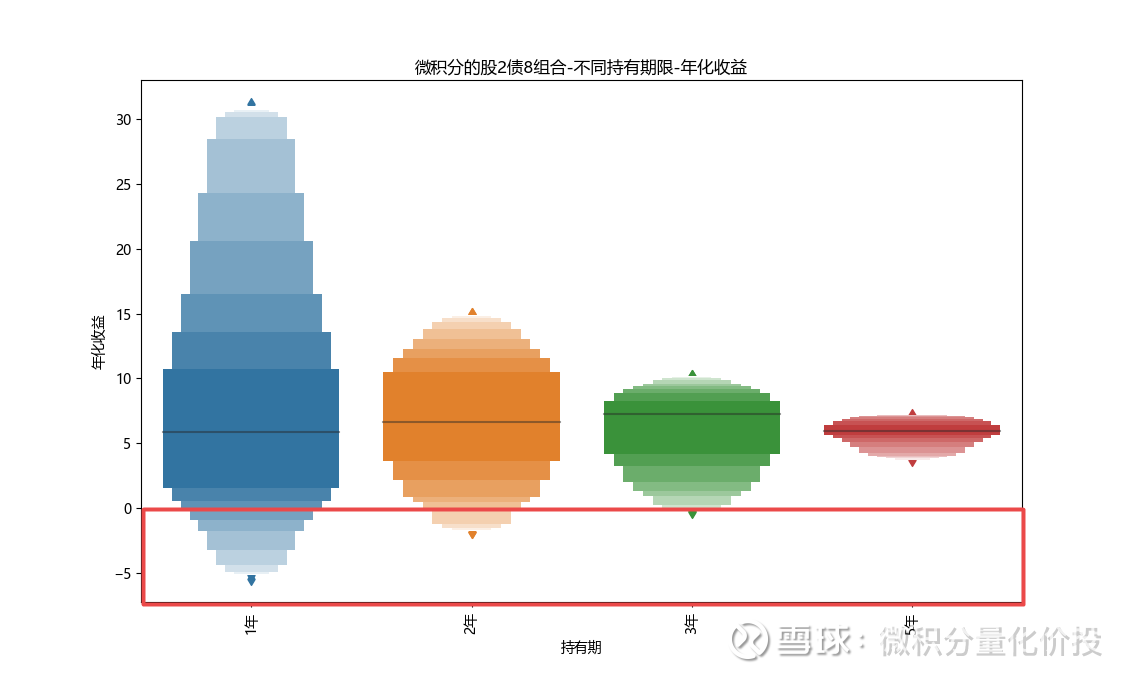
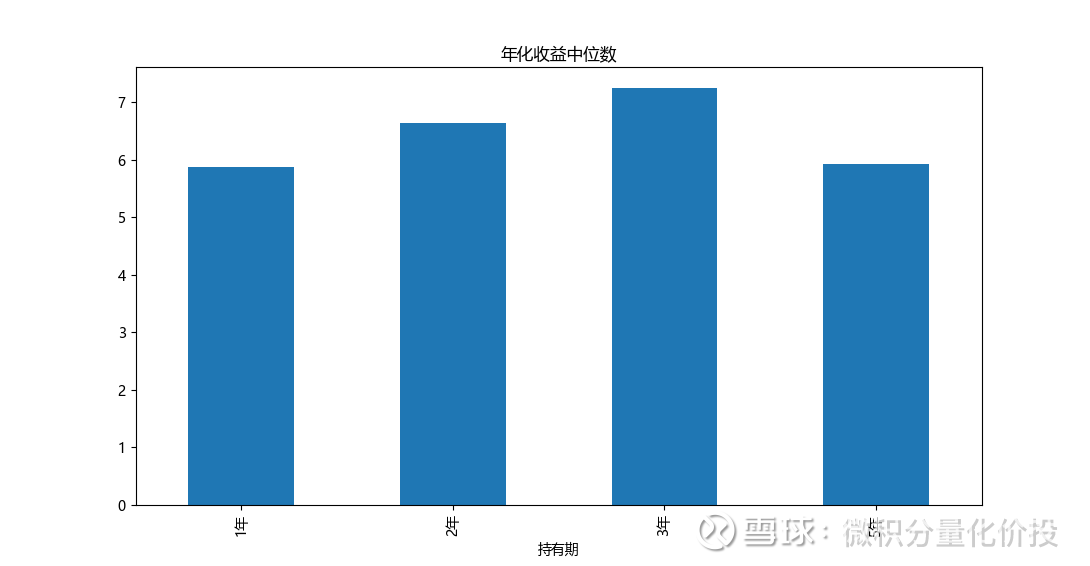
There is not much difference in the median annualized return for the holding period of 1-5 years.
From the perspective of risk, the main reference is the maximum retracement. The median maximum retracement increases significantly with the holding time. If you consider holding for 1-2 years, the median maximum retracement is around 4%.
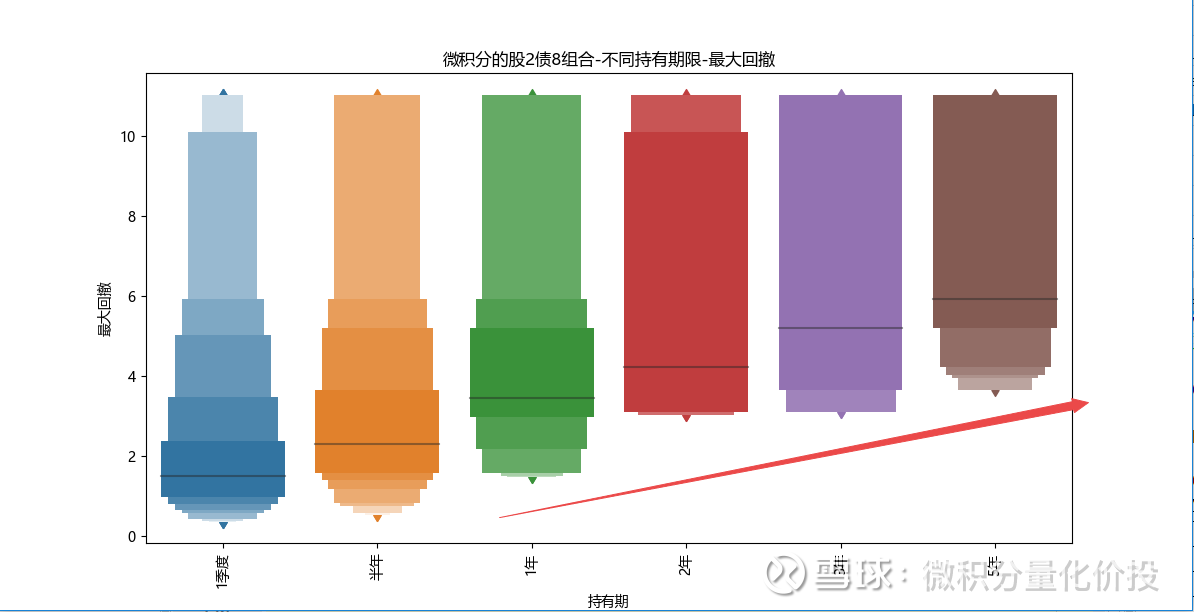
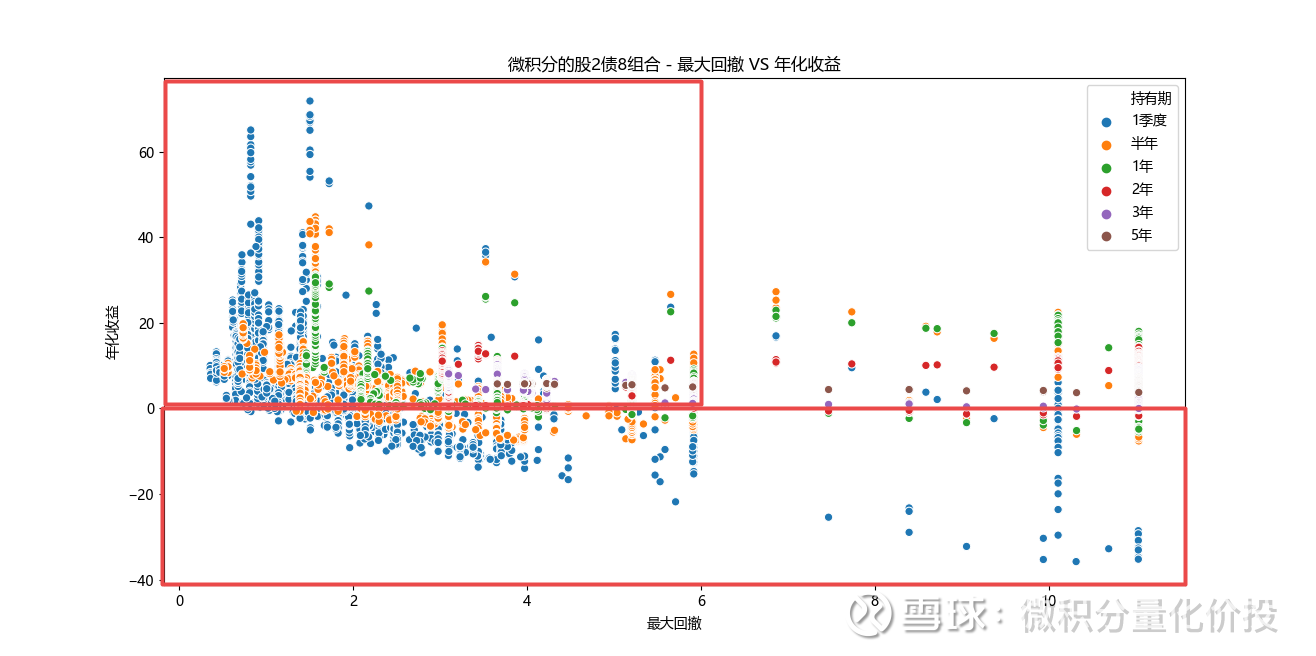
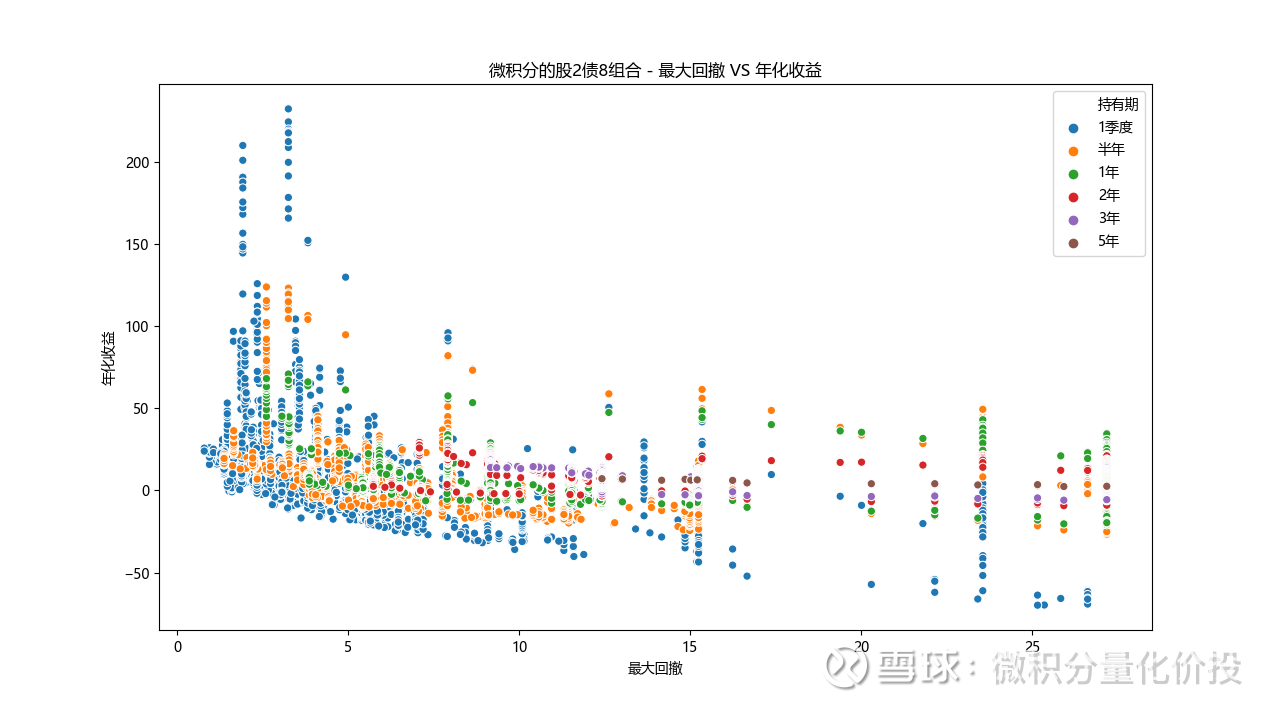
Judging from these two data, if the combination of stocks 2 bonds 8 is considered to be held for 1-2 years, the average income level is between 5-7%, and the maximum retracement is 4%. If you encounter extreme market conditions , may also be significantly magnified. If you look at the maximum retracement and scatter chart, most of the time, the maximum retracement can be controlled within 6%, while achieving certain positive returns.
Specific configuration requirements
The following is a reverse disassembly of a reasonable configuration based on specific needs. Holding for more than 1 year, the annualized return is about 4%, and the maximum drawdown is -4%. (The target annualization is more than 5%, and the maximum retracement is less than 5%.) The following is the proportion of the number of samples that meet the conditions to the total number of samples. If only the case of holding for one year is considered, the number of samples that only consider the pure bond portfolio that meets the conditions is the largest. If the holding time can be increased, the probability will be even greater.
If you consider shortening the holding time, you can consider the asset allocation of stocks 1 bonds 9, and there is a high probability that it can meet the demand. But once stocks are added, as the holding time increases, the number of effective samples decreases significantly, because the overall drawdown of stocks is particularly large, and it is easy to exceed the position of 4%.
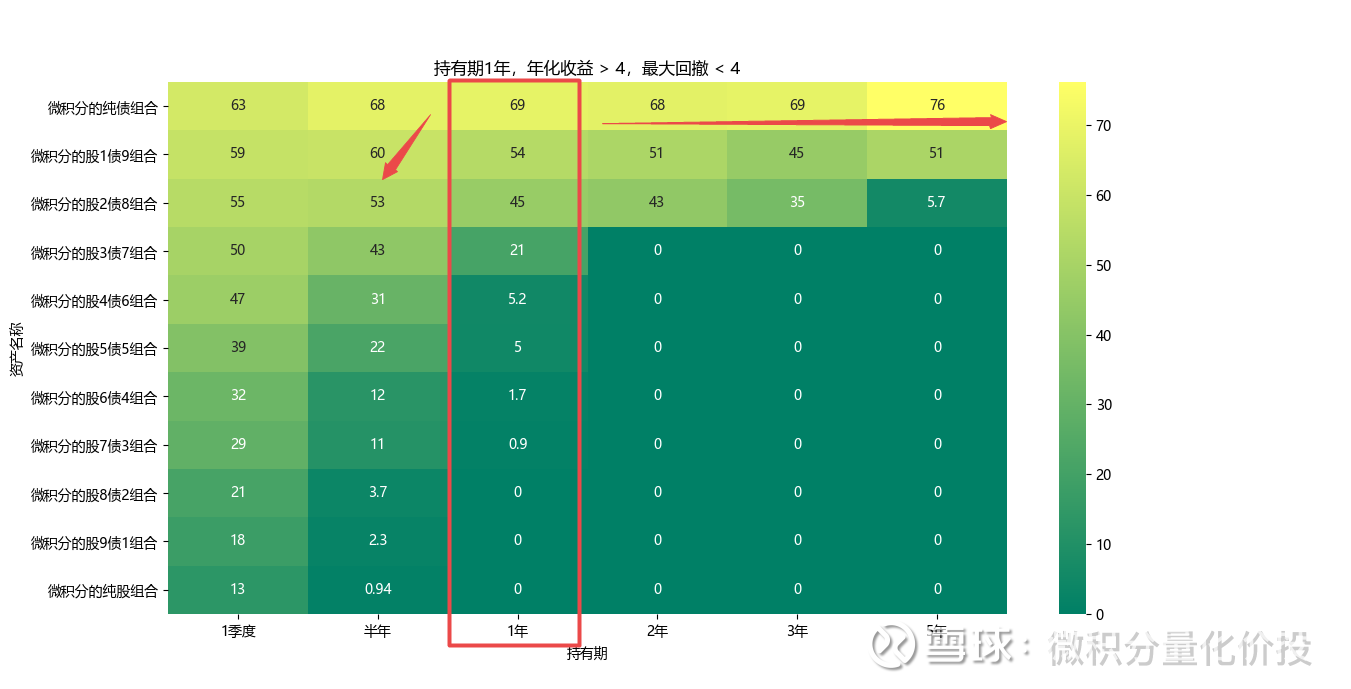
Considering that the yield of bonds is relatively high in historical data, it is expected that the yield of the entire bond market may continue to decrease in the future, so more equity assets should be included, and at the same time subject to the limit of the maximum drawdown, it cannot increase too much. In this case, it is relatively reasonable to consider the allocation of shares 1 debt 9, and there is at least a 50% probability of achieving this goal.
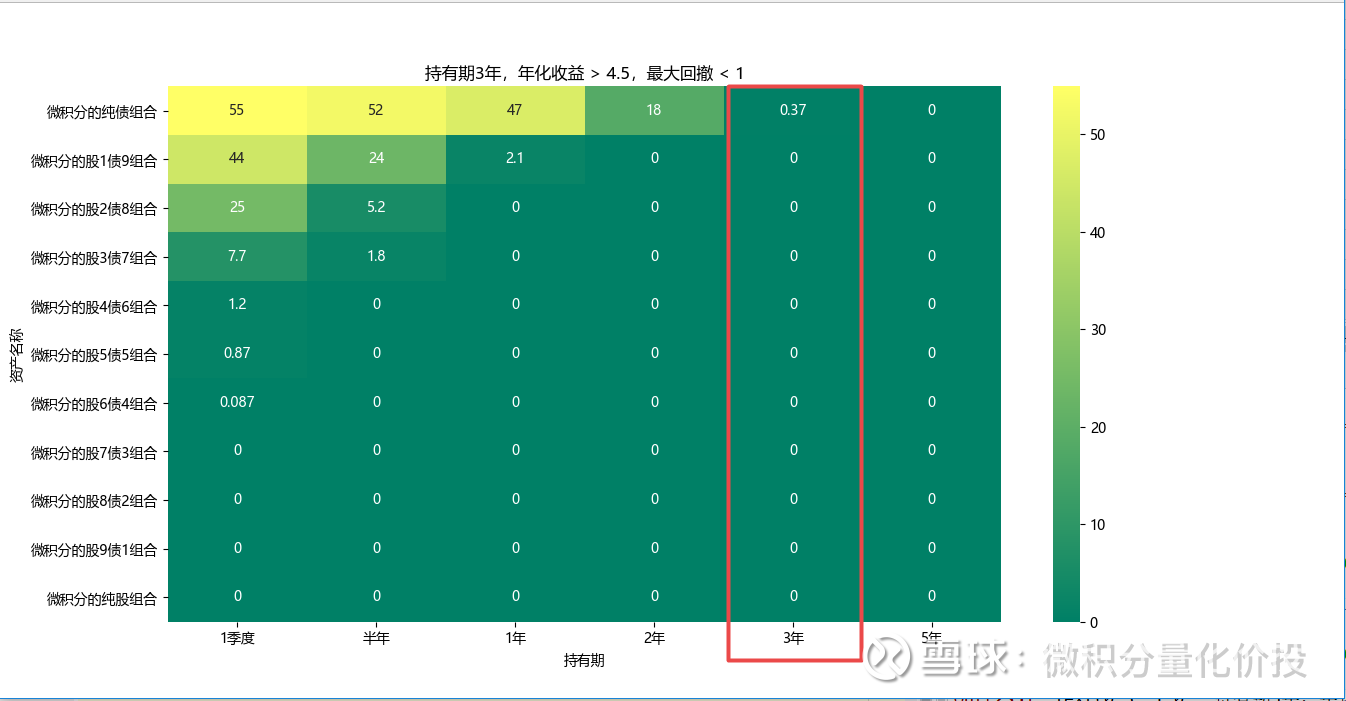
Holding for more than 3 years, the annualized return is about 4.5%, and the maximum drawdown is -1%. For this case, the maximum drawdown limit is very strict. Judging from the statistical data, there are basically no samples that can meet this constraint. Because the retracement restrictions are too strict, the number of effective samples that includes equity assets is also very small. On the whole, only when holding pure bonds, and only holding for one year, can it be possible to achieve the expected goal, but the future income of pure bonds is likely to decline. Therefore, it is relatively difficult to realize this kind of allocation demand through investment in public funds, which is a very skinny situation in reality.
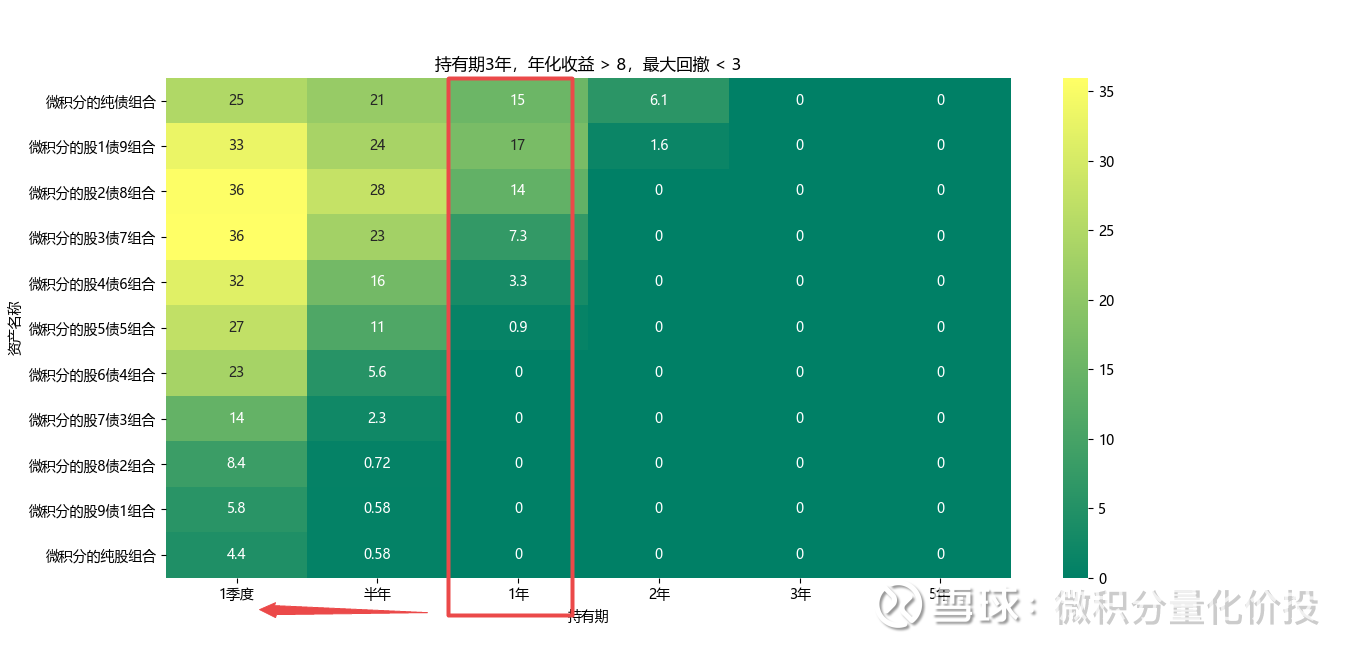
What if the target is an annualized return of more than 8%, but the maximum drawdown is less than 3%? There are basically no samples that meet this condition for holding for more than 2 years, because holding for more than 2 years is likely to encounter large fluctuations in equity, which will cause the maximum drawdown to exceed the target demand. If it is held for 1 year, the position of 8 stocks 2 bonds may be reached. In addition, the holding period is shortened. This requires timing operations. It needs to be bought at a good point, and at the same time, the position to sell is relatively good .
Equity and debt balance allocation
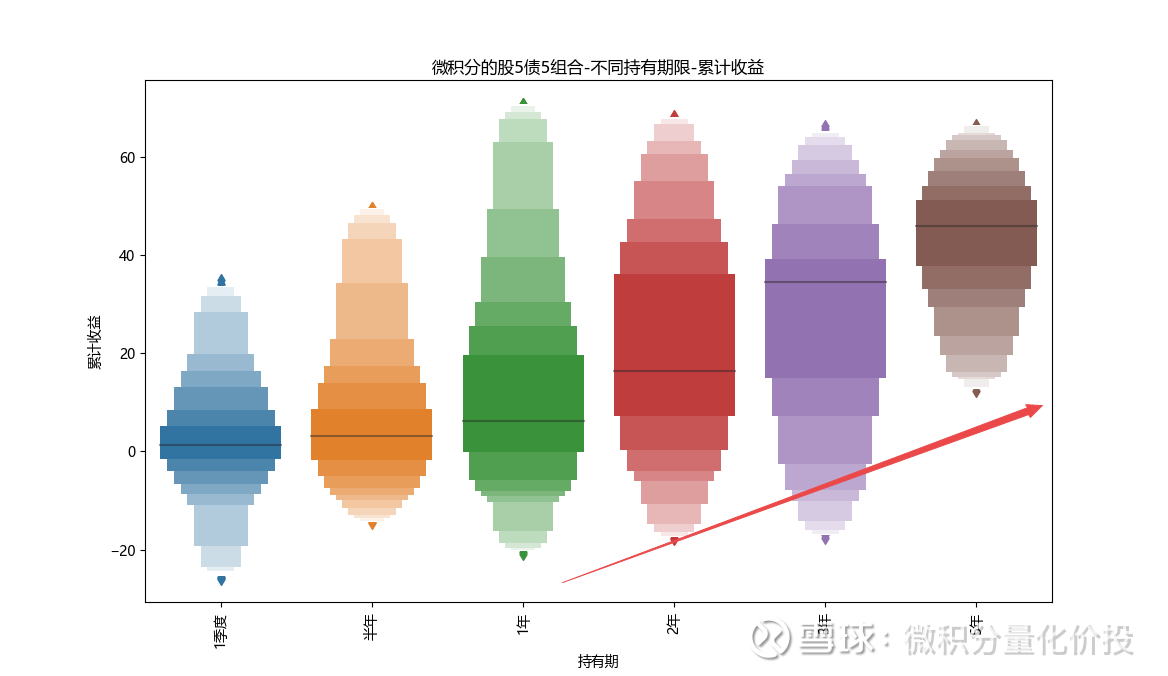
A common stock-debt balance configuration is a stock-5-debt-5 configuration. From the perspective of the median annualized income, as the holding time increases, the cumulative income of holdings increases significantly, especially after holding for 3 years, the cumulative income increases significantly.
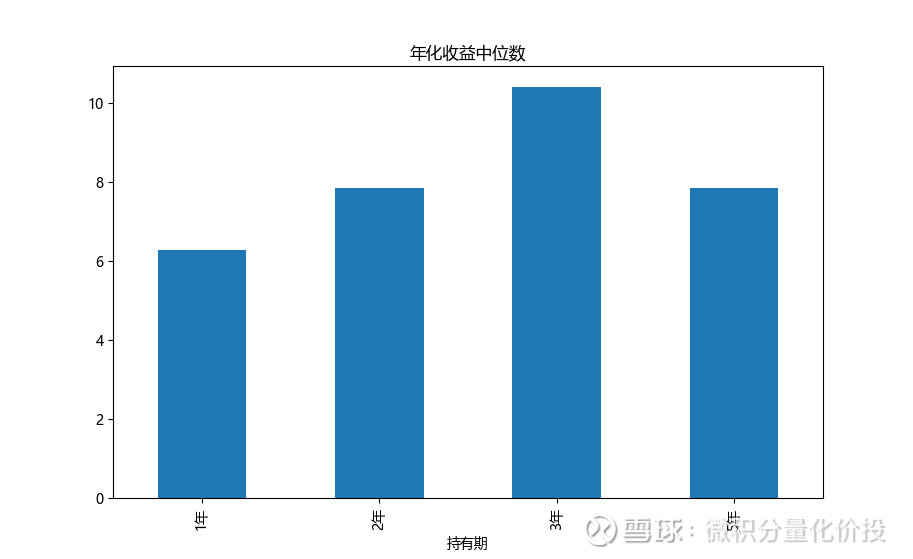
From the perspective of the annualized rate of return, the annualized rate of return for holding for 3 years is the highest, and the annualized rate of return is about 10%.
From the perspective of the retracement range, the maximum retracement is about 10%-15%.
Equity allocation
Next, consider the equity allocation combination, which is the common allocation mode of 8 stocks and 2 bonds. As the holding time increases, the overall income of the portfolio increases, and the probability of positive income proportion is getting higher and higher, and the profitability is getting stronger and stronger.
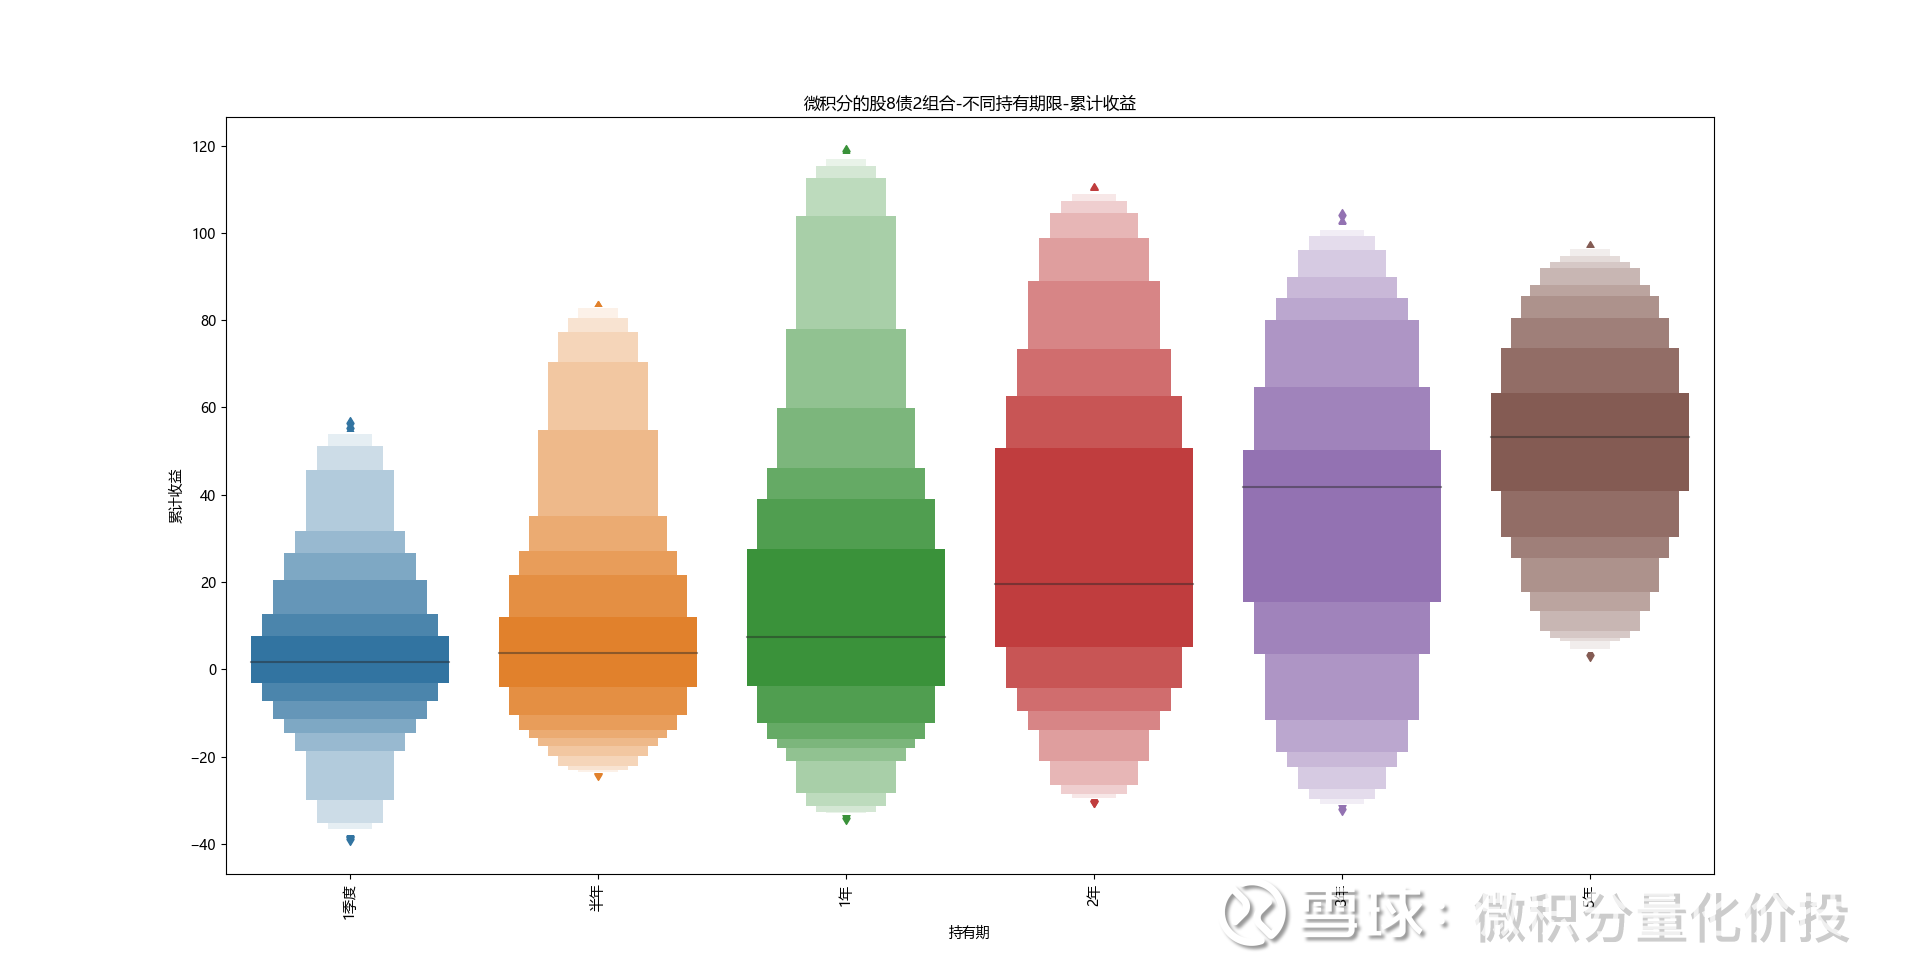
If you only hold it for one quarter, the difference between the beginning and the end of the annualized return is particularly large.
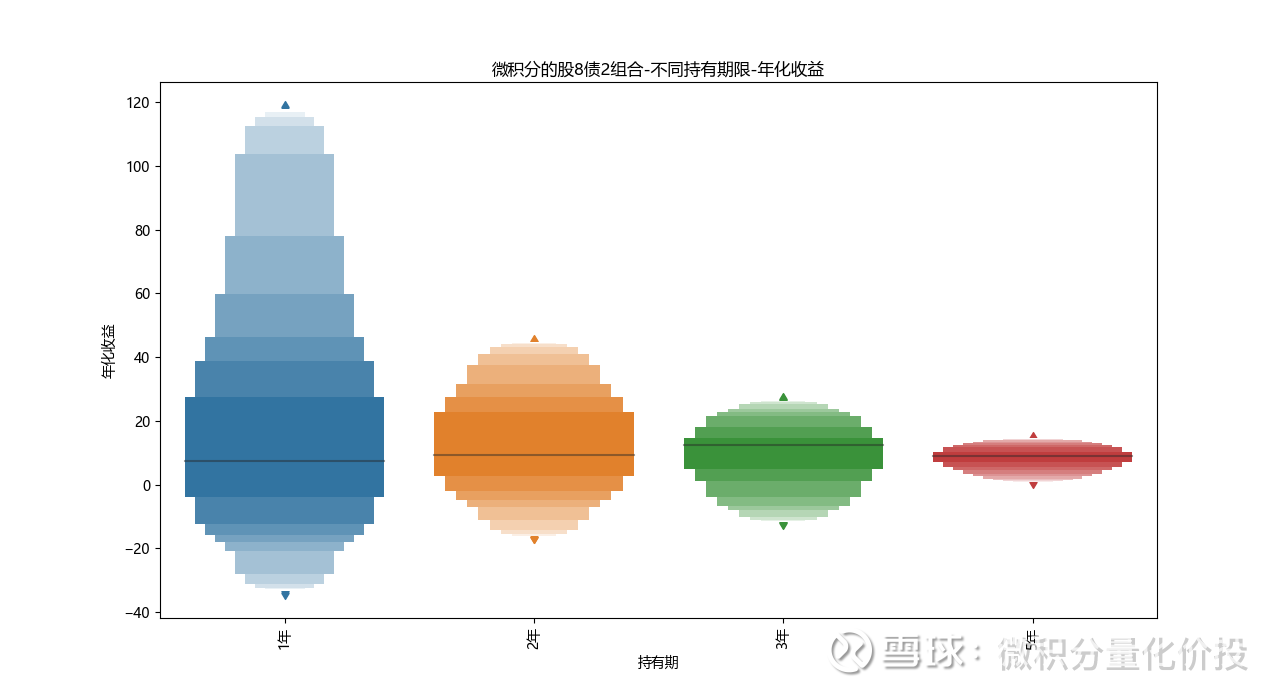
About 3 years of annualized returns are the highest, with a median of around 12%.
As the holding time increases, the corresponding maximum drawdown will also increase significantly.
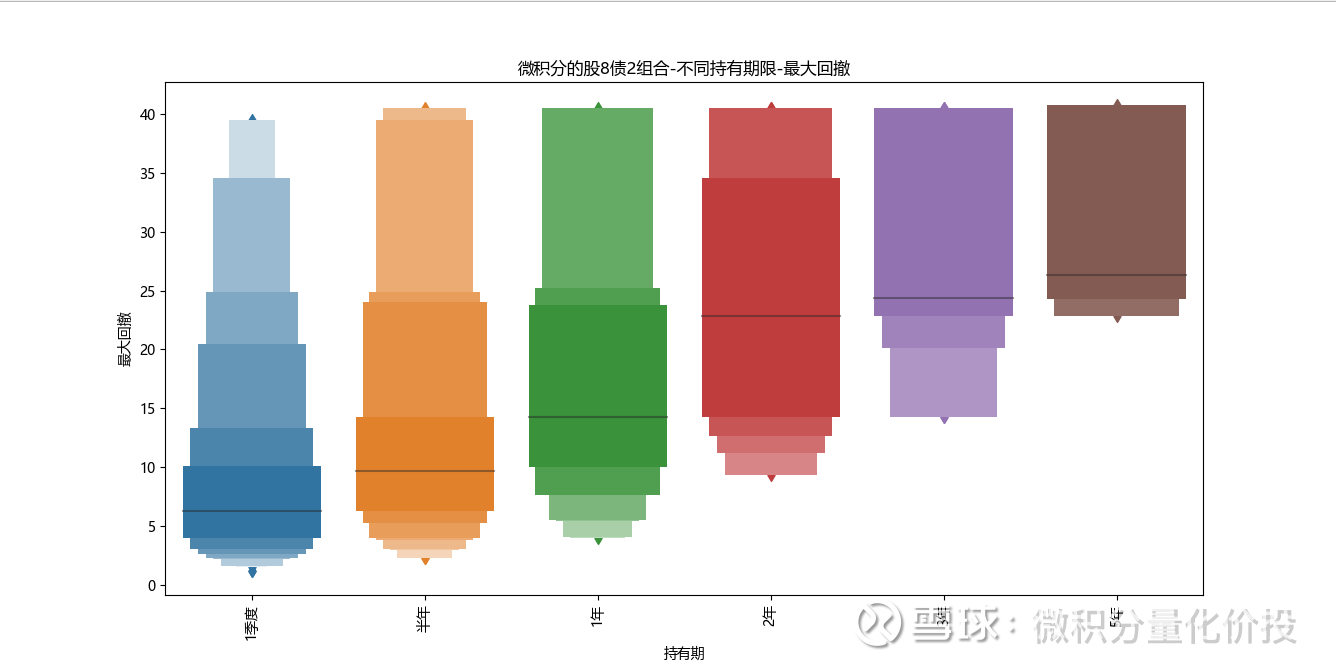
If you hold it for 3 years, there is a high probability that the maximum retracement can be controlled within 20%.
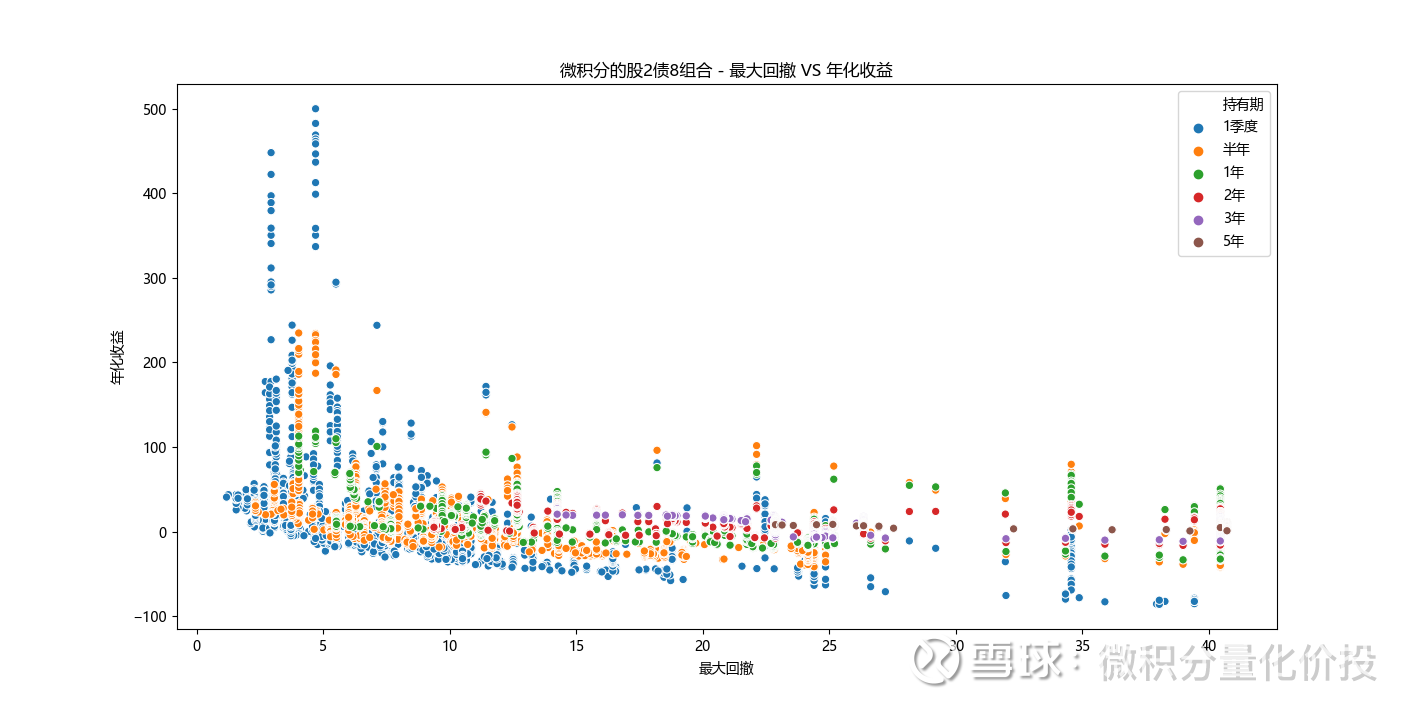
specific configuration requirements
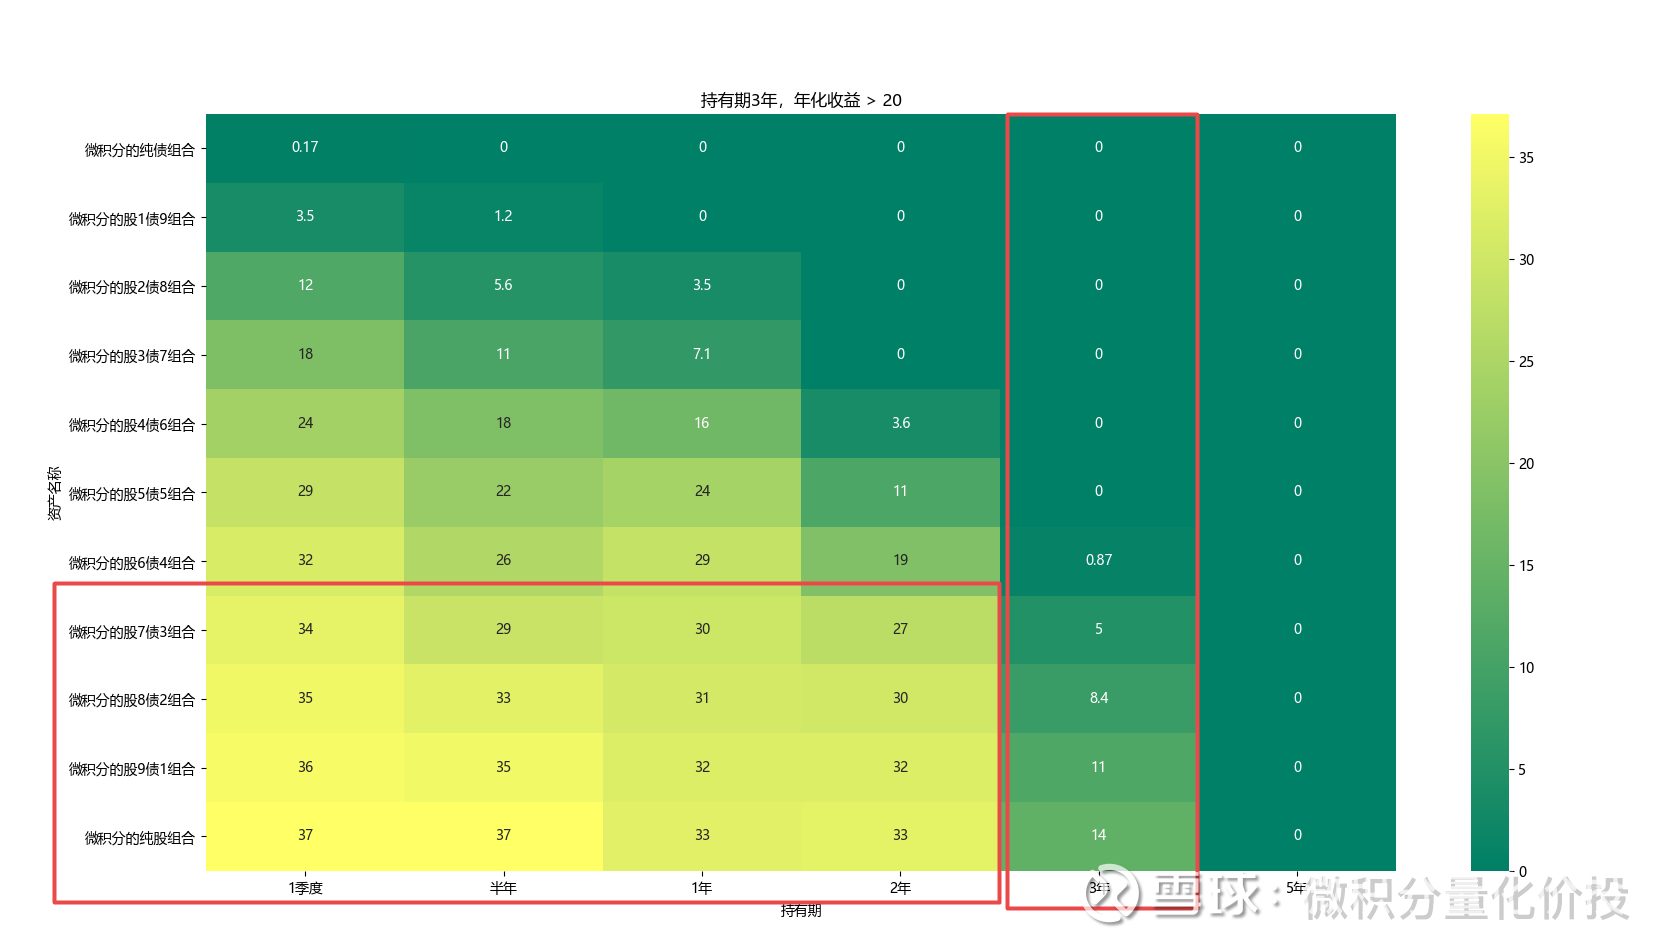
The annualized return is above 20%, and there are not many requirements for the retracement. The conditions that can be met are basically high-equity portfolios, and the proportion is not high, and the holding time is within 2 years.
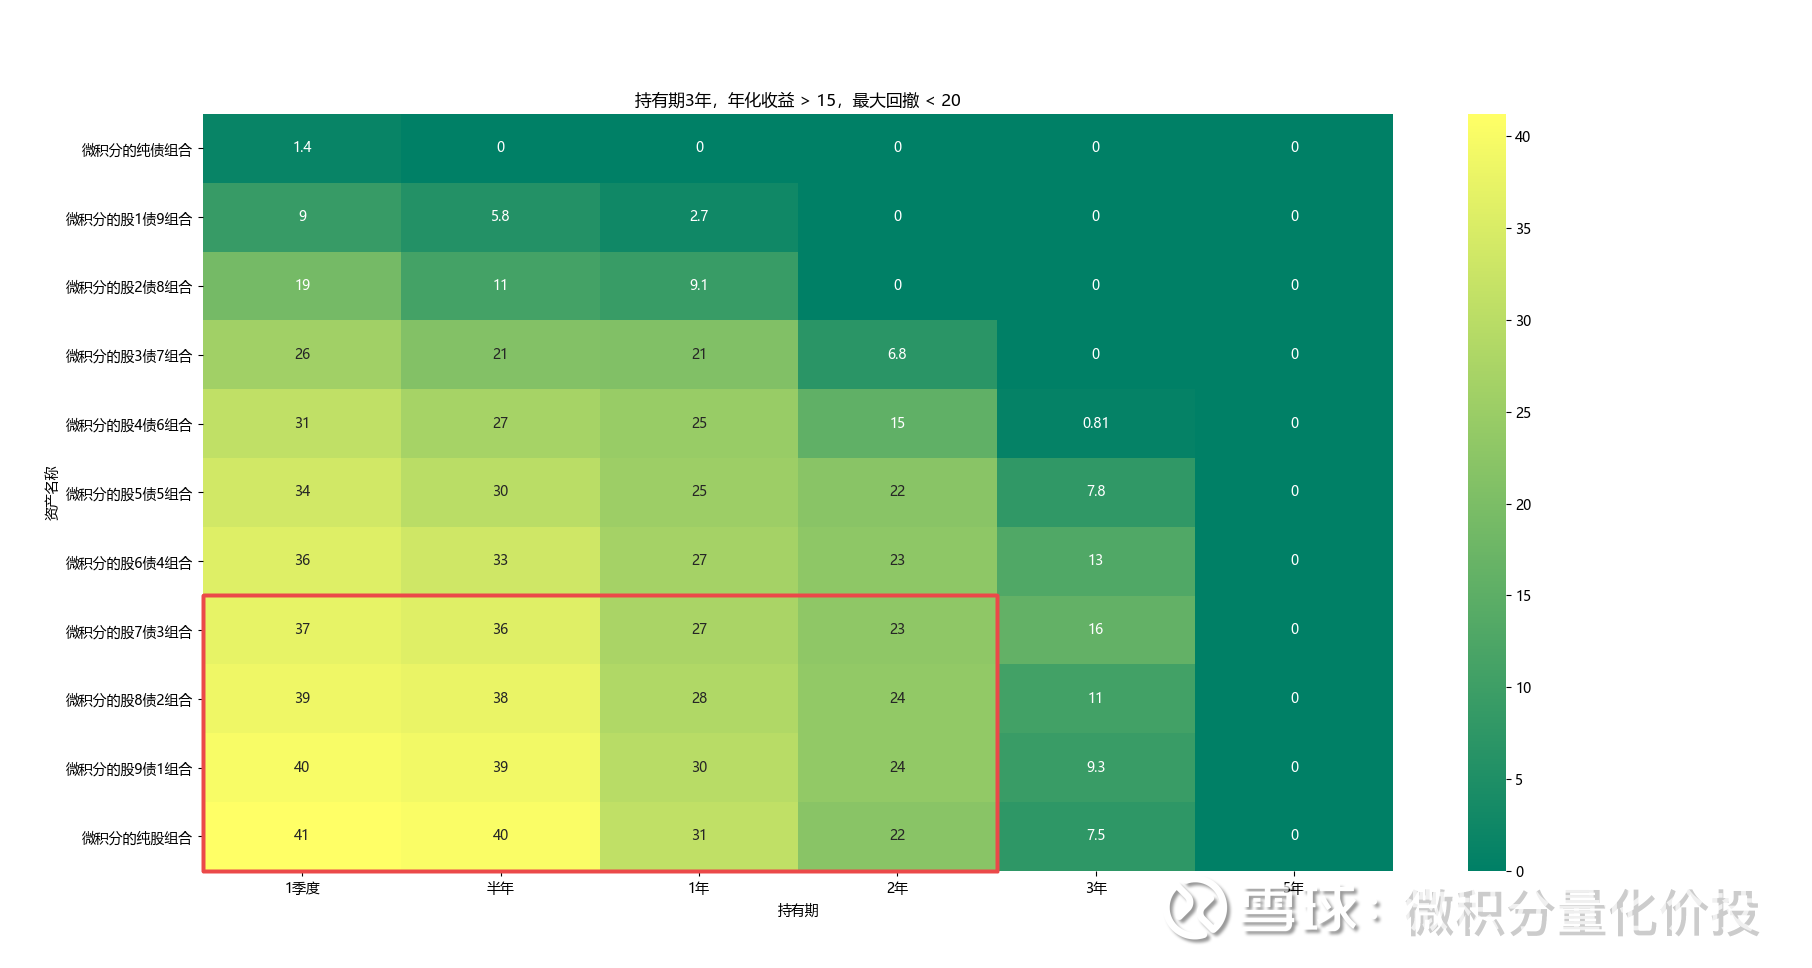
More than 5 years: the annualized rate is about 15%, and the maximum drawdown is -20%. Because of the drawdown requirement, the effective sample ratio is smaller than before, and it is also dominated by high-equity portfolios, which are relatively short-term, that is, Certain timing operations are required.
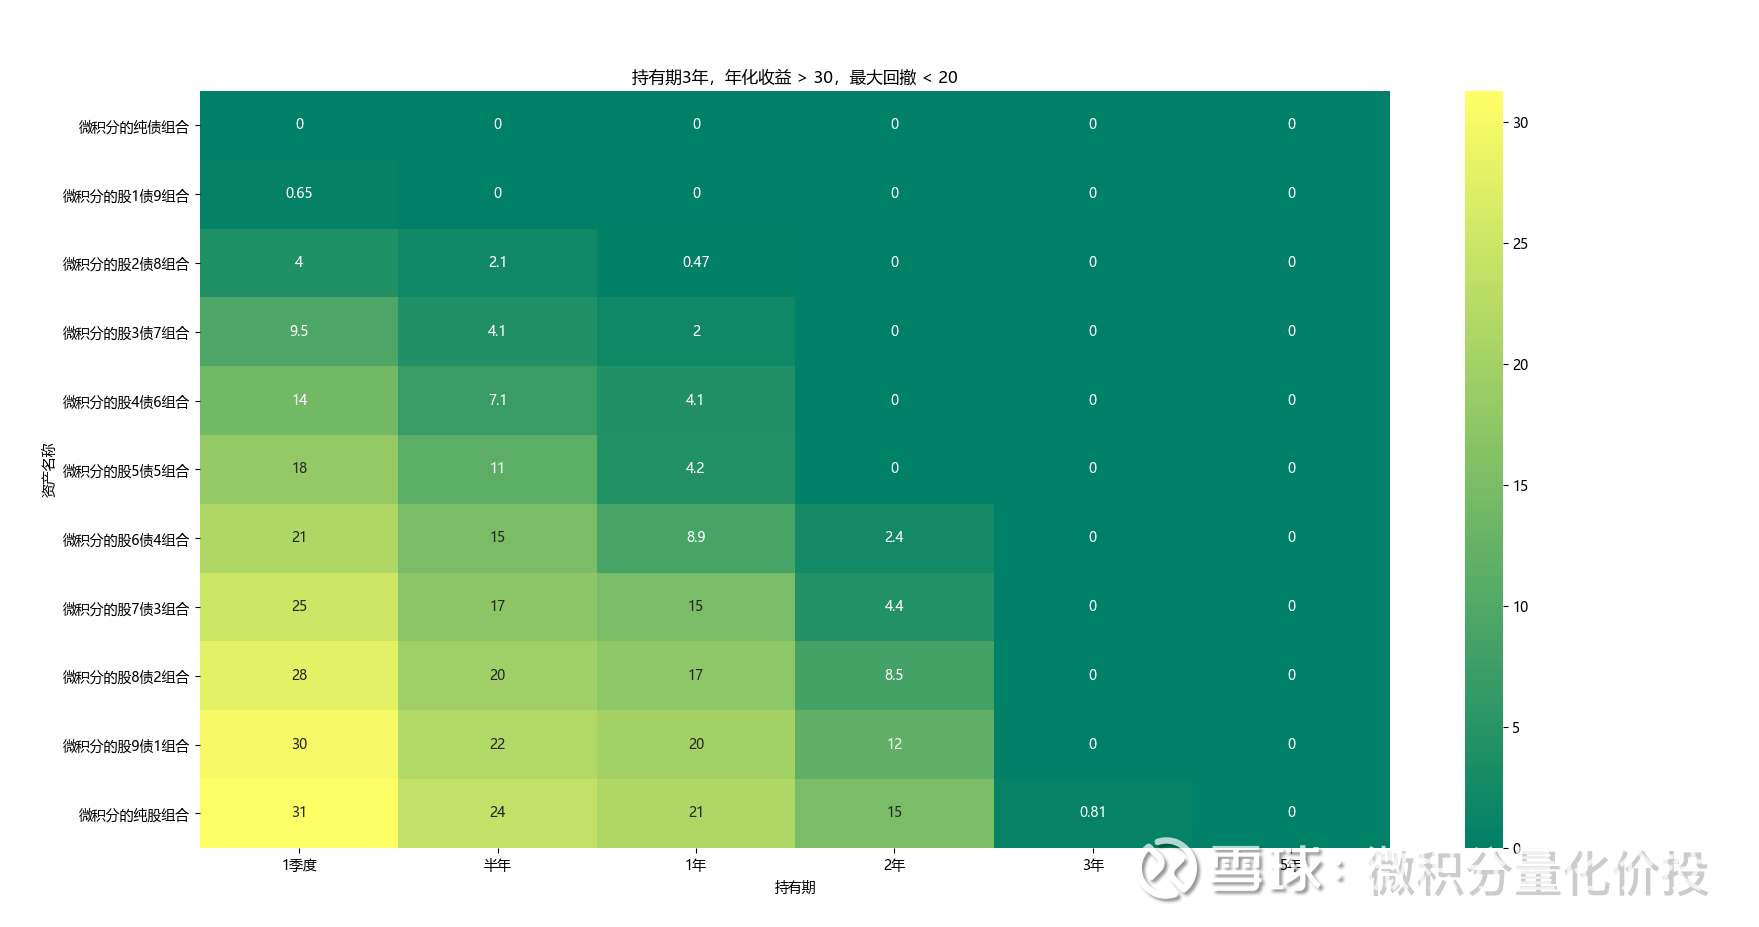
The annualized return is 30%, the maximum drawdown needs to be controlled within 20%, and the number of samples that can be satisfied is relatively small. It is basically not said that buying and holding can be achieved by lying down.
summary
From my calculations, the following are the actual annualized returns and maximum drawdown ranges of common stock-bond allocation combinations:

The above data is only a gross estimate. If the market encounters extreme market conditions, the maximum retracement is likely to be enlarged.
Specific to the configuration requirements, the corresponding configuration scheme is as follows:
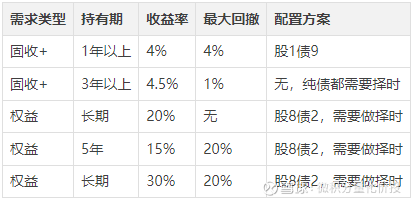
If you are not satisfied with the above income, how to get higher income? Nothing more than two ideas:
1. Make excess returns on the selection of funds, and select better funds to outperform the underlying CSI partial stock fund index;
2. Timing, liquidate positions when they are high and increase positions when they are low;
Among them, I think it is very important to identify and deal with the top and bottom of the market. This part is very critical. Identify top areas and don’t buy, identify bottom areas and don’t sell.
So far, the full text is over, thank you for reading.
If you find omissions and errors in my analysis, please add and correct me.
Investment is risky, and investment needs to be cautious. The above content only represents personal opinions and has no connection with my institution, nor does it represent any investment advice or commitment. Investors should not use this as the basis for investment or decision-making.
Before you make an investment decision, please carefully read the fund contract and other instructions, fully understand the risk-return characteristics and product characteristics of the fund product, carefully consider various risk factors, and according to your own investment purpose, investment period, investment experience, assets Factors such as conditions and conditions fully consider their own risk tolerance, and on the basis of understanding product conditions and sales suitability opinions, make rational judgments and prudently make investment decisions. Past performance of a product is not indicative of its future performance. Investment is risky, please choose carefully.
Like and watch, invest and earn more ¥

#弹分定位价报投# #雪球星计划公园达人# #ETF星抱官#
Click to view: Historical Articles
$Partial Stock Fund(CSI930950)$ $E Fund New Comprehensive Bond LOF(SZ161119)$
There are 2 discussions on this topic in Xueqiu, click to view.
Snowball is an investor social network where smart investors are all here.
Click to download Xueqiu mobile client http://xueqiu.com/xz ]]>
This article is transferred from: http://xueqiu.com/4778574435/240049839
This site is only for collection, and the copyright belongs to the original author.