How to understand the real profitability of a company through the financial report is a very complicated thing, because there are many indicators to measure profitability, such as operating profit, net profit, adjusted net profit (Hong Kong stock), deducted non-net profit (A stock) , NON-GAAP net profit (US stocks), etc. Various indicators include different financial items, especially for large-scale and diversified companies, which are extremely complex. Many amateur investors often only look at net profit, use net profit to measure a company’s profitability, and then use PE to evaluate whether it is expensive or not. This is very limited.
Today, I will take Tencent as an example to tell you about the meaning and limitations of different profitability indicators, and at the same time introduce an evaluation method that can more reasonably demonstrate the true profitability of the company.
Let’s first look at the relationship between the various indicators in the financial statement through a picture:
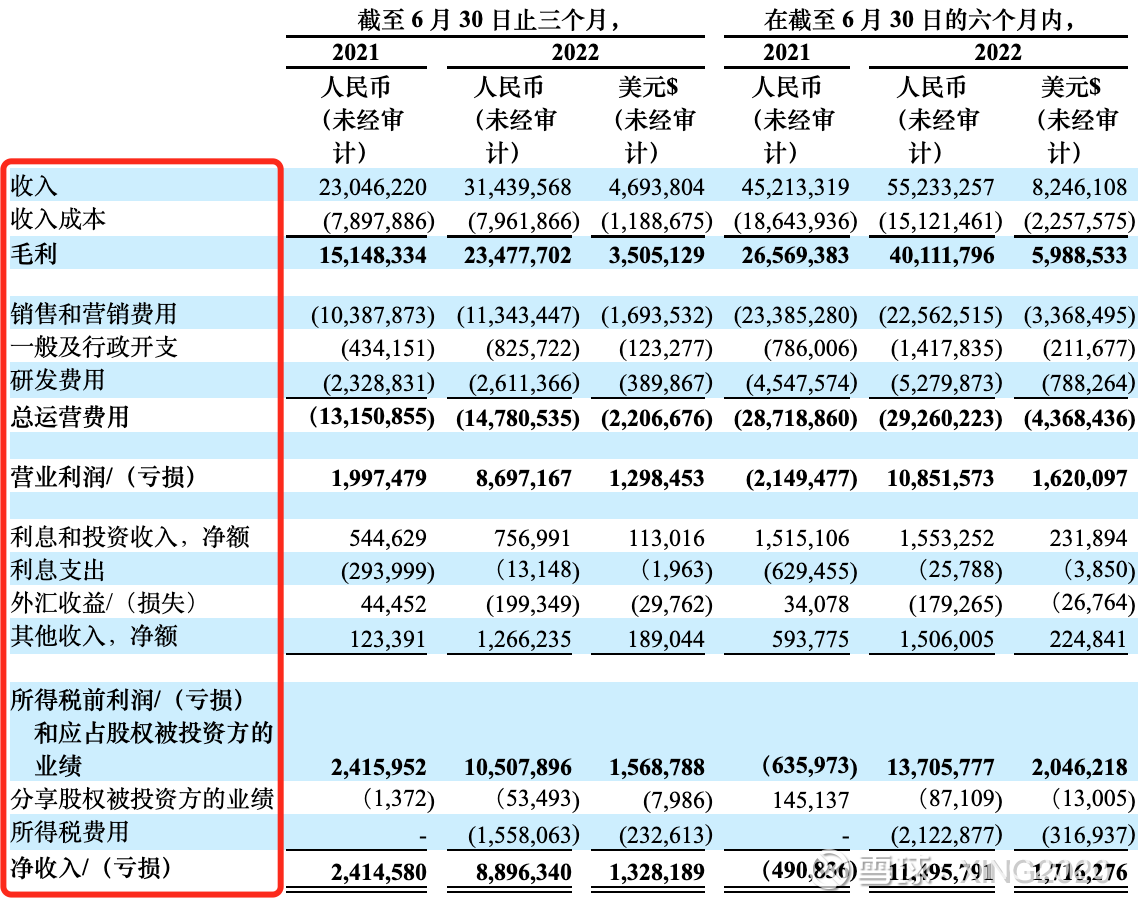
The report of the company in the picture above is very simple and clear (you can guess which company it is):
revenue – cost = gross profit;
Gross Profit – Expenses = Operating Profit;
Operating profit + non-main business income or expenses = pre-tax profit;
Profit before tax – income tax = net profit.
There is no doubt that the company’s income statement is easy to understand (because the business is very focused and single), and it is easy to see that operating profit reflects the profitability of the main business more than net profit, because operating profit does not include the main business. interest income (or expenses), investment income, etc.
However, the business of most large companies is very complex and diversified, which makes it difficult to find the real profit data of the company.
Let’s take a look at Tencent’s 2021 income statement:
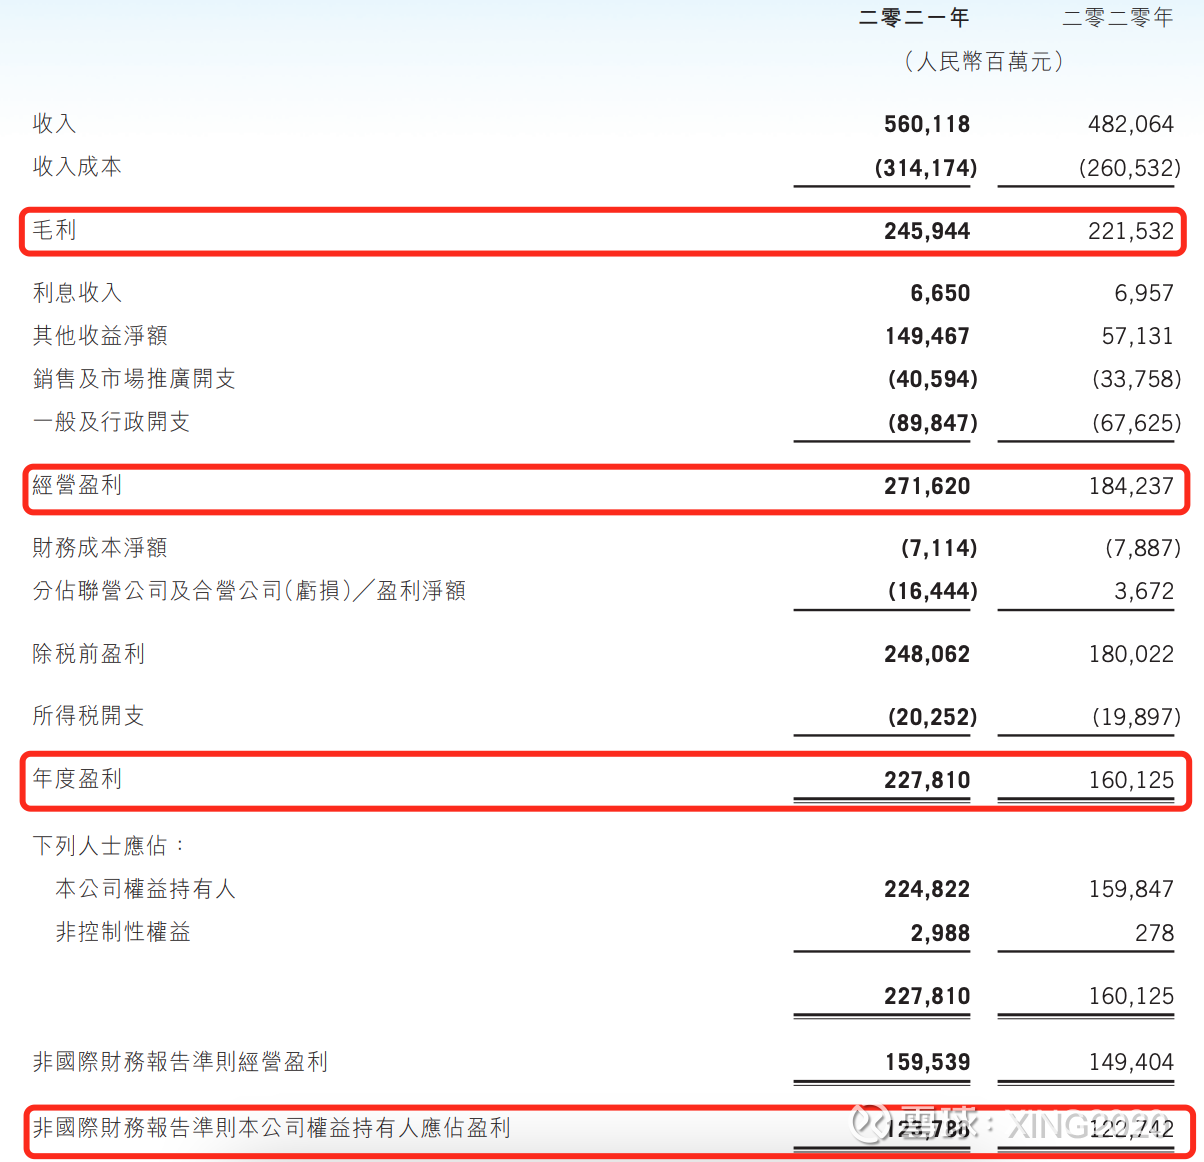
Revenue – cost = gross profit, it’s the same and easier to understand.
Operating profit = gross profit – interest income – expenses + other net income (or loss)
Note: Net other income refers to the investment income and investment exit income measured at fair value, which is simply the gain or loss caused by the fluctuation of the market value of the listed company’s stock invested.
In this way, the operating profit is very high, and it is difficult to represent the profit of the main business. For example, the net other income in 2021 is 149.467 billion yuan (including 78.2 billion yuan from the disposal of JD.com stock), which is included in the operating profit. Yes, it is equivalent to an increase of more than 140 billion investment income in the main business profit. This investment income has nothing to do with the main business, and it is not so much every year, so Tencent’s operating profit index cannot truly reflect the core main business. of profitability.
Annual profit = operating profit – net financial cost + share of profit (or loss) of associates and joint ventures
Note: Annual profit is equivalent to net profit; net financial cost is interest expense; share of profit (or loss) of associates and joint ventures refers to investment income accounted for by the equity method, and is accounted for in the profit or loss of the invested company according to the shareholding ratio. Losses, JD.com, Meituan, and Pinduoduo invested by Tencent are all accounted for in this way. For example, Tencent holds 20% of the shares of Meituan, and Meituan will make a profit of 10 billion in 2021, then Tencent can calculate 10 billion * 20% = 2 billion, and include 2 billion in the profit of joint ventures and joint ventures.
Therefore, the annual profit here also includes a large amount of investment income, and the amount is not small. For example, from the above figure, we can see that the loss from the share of the joint venture and the joint venture in 2021 is 16.444 billion. This part of the loss does not represent the profitability of the main business, nor does it lose money every year. In addition, the operating profit mentioned above also has investment income, so Tencent’s annual profit cannot represent the true profitability of Tencent’s main business.
Next, let’s look at the adjusted net profit , which was 127.919 billion. Below is a chart to see how the adjusted net profit is calculated.
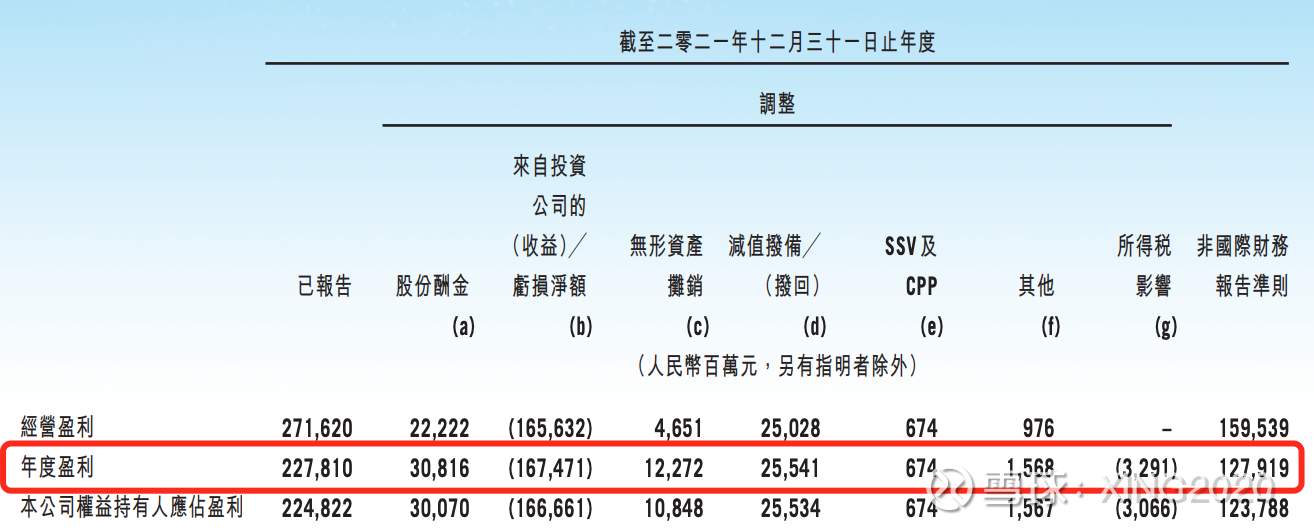
As can be seen from the figure, adjusted net profit = annual profit + remuneration paid by shares – investment income + amortization of intangible assets + impairment provision (mainly these items, others can be ignored).
Note: For the convenience of explanation, the adjusted net profit here does not deduct non-controlling interests.
From the above, the adjusted net profit is reasonable. For example, the adjusted net profit is deducted from the investment income of 167.471 billion. This calculation reduces the interference of the investment income on the profitability of the main business.
There are also unreasonable places, such as remuneration paid in shares, amortization of intangible assets, and impairment provisions, which total 68.6 billion. These three items are to be counted as cost deductions in the annual profit, but in the adjusted net profit, these three items of 68.6 billion are not counted as cost deductions. This treatment will obviously interfere with the profit data of the main business, because the remuneration paid by shares, although the company does not pay out cash, but the shares are distributed to employees for free, there is still a cost. If this part of the shares are sold to investors, The company can receive cash, so the cash paid by shares is not included in the cost, and it will also interfere with the profit data of the main business; also amortization of intangible assets, impairment provision (mainly due to the impairment of goodwill caused by acquisitions), If the cost is not included, it will also interfere with the profit data of the main business.
To give a simple example: For example, four years ago, Tencent paid 10 billion yuan to buy video copyrights. At that time, it spent 10 billion yuan, but it was recorded according to the requirements of accounting standards (such as amortization in 4 years). In that year, only 2.5 billion of the cost will be calculated, and the remaining In the next three years after 7.5 billion, 2.5 billion is deducted from the net profit every year, but the adjusted net profit is 2.5 billion without deducting this amortization, which obviously inflates the profitability of the main business. In addition to the impairment of goodwill, a few years ago, a company’s net assets were only 1 billion yuan, and you spent 10 billion yuan to buy it. This year, the company was liquidated for only 2 billion yuan. If you bought a loss, you spent an extra 8 billion yuan. It has been spent a few years ago, and I have not paid for it now, but it is indeed a loss of 8 billion. Now the adjusted net profit does not deduct the loss of 8 billion, which also inflates the profitability of the main business.
Therefore, although the adjusted net profit excludes the impact of investment income of 167.4 billion, but adds the other three interferences of 68.6 billion, so the calculated net profit still cannot accurately show the profitability of Tencent’s main business.
Therefore, several data indicators representing profitability on Tencent’s income statement have their own limitations, and it is difficult to accurately display Tencent’s true main business profitability. If you only evaluate Tencent based on the data on the income statement, you will be more or less misled.
This doesn’t work, that doesn’t work either. Is there any way to more accurately assess the profitability of Tencent’s main business? The answer is yes, it may not be completely accurate, but compared to the above indicators, it will be closer to the real level, this evaluation indicator is free cash flow.
The meaning and calculation method of free cash flow is very long to be introduced in detail. Here is a brief description of what it represents: free cash flow can be simply understood as the discretionary pure cash that the company actually receives every quarter (or every year). .
Let me give you the simplest example to introduce the difference between free cash flow and profit: For example, company A has an income of 10 billion this year, and spent 10 billion to purchase film and television copyrights or build factories. From the perspective of free cash flow, company A’s this year’s revenue Free cash flow is 10 billion – 10 billion = 0; from the perspective of profit, film and television copyright and factory construction can be classified as capital expenditures, and these can be apportioned. 100 million/10 years = 1 billion, then company A’s profit this year is 10 billion – 1 billion = 9 billion. Therefore, it seems that the income is 9 billion in the statement, but the actual free cash that Company A received this year is 0.
Let’s take a look at Tencent’s profits and free cash flow in recent years:
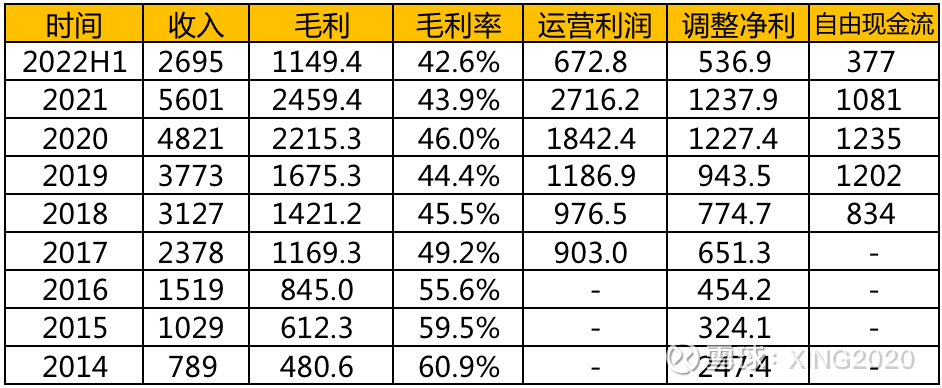
As can be seen from the above figure, in some years Tencent’s free cash flow is much lower than operating profit, such as 2020 and 2021, because of the bull market in these two years, Tencent’s investment income is relatively high. Compared with the adjusted net profit, Tencent’s free cash flow in 2018-20 is greater than the adjusted net profit, which shows that Tencent’s asset-light businesses such as games in recent years have achieved good value-added income, and they are all pre-paid; The investment in assets is relatively small, such as the copyright purchase of Tencent Video, and the construction investment of the cloud computer room is not so large. Since 2021, Tencent’s free cash flow has been much lower than its net profit. On the one hand, the growth of games and value-added income has slowed down. On the other hand, the investment in heavy assets such as film and television copyright and cloud computing has increased a lot. It is amortized over many years, so it seems that the profit is high, but the actual discretionary cash received is less. Therefore, according to the above estimate, Tencent’s free cash flow this year is likely to be lower than its net profit. It is estimated that the free cash flow for the whole year will be around 100 billion.
So far, I have explained several indicators of Tencent’s profitability in detail. Each indicator has its own meaning, and the meanings of these indicators of each company are different. As Tencent, operating profit, annual profit, and adjusted net profit are quite different from the real profitability of its main business, but when it comes to other companies, the situation may not be the same. For example, in the first picture in this article, operating Profits can well demonstrate the profitability of the main business, so there is no one-step, no one-size-fits-all method for investment. They are all specific companies, and specific situations require specific analysis. But one thing you can learn from is that when you can’t see the profitability of the main business through the income statement, you can consider using the free cash flow method to evaluate. Profit can deceive you, but free cash flow will not.
This article written today is actually for the next article: Using cash flow discount to pave the way for Tencent’s valuation. After understanding the meaning of free cash flow, it will be much easier to read the next article, so stay tuned.
$ Tencent Holdings (00700) $ $ Tencent Holdings ADR (TCEHY) $ $ Pinduoduo (PDD) $ # Tencent Holdings # @Today’s topic
There are 35 discussions on this topic in Snowball, click to view.
Snowball is an investor’s social network, and smart investors are here.
Click to download Snowball mobile client http://xueqiu.com/xz ]]>
This article is reproduced from: http://xueqiu.com/6490468241/231174190
This site is for inclusion only, and the copyright belongs to the original author.