1. Overview of core indicators
First, take a look at the core data of the Agricultural Bank of China’s semi-annual report (Table 1):
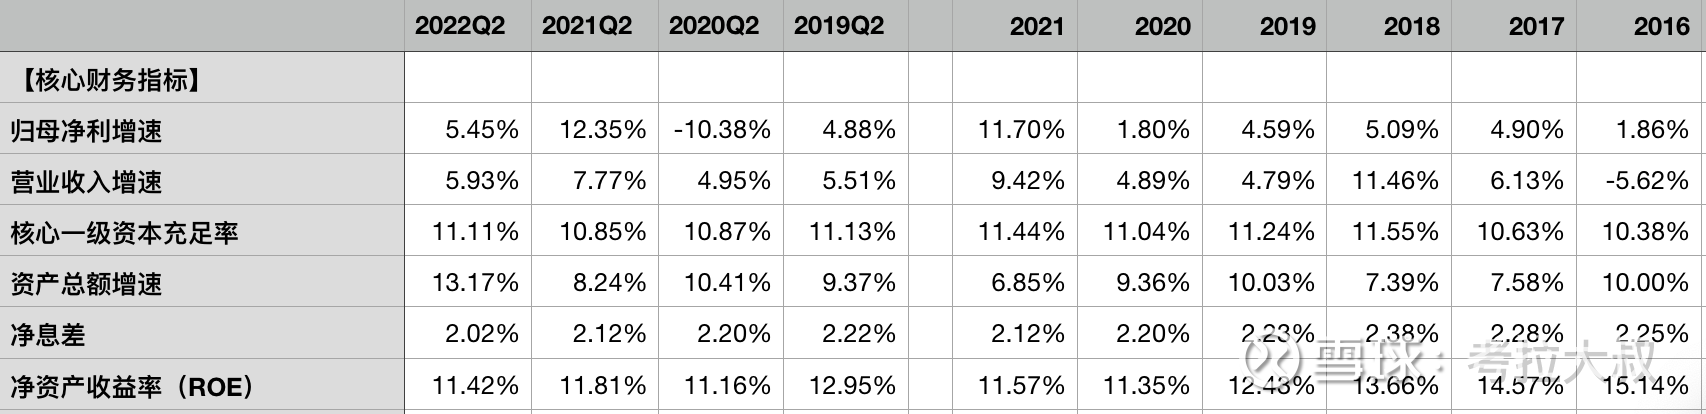
Table 1 – Agricultural Bank’s core financial data for the first half of 2022
Net profit increased by 5.45% year-on-year, revenue increased by 5.93% year-on-year, and the growth rate of net profit was basically the same as that of revenue.
The net interest margin decreased by 0.1% year-on-year to 2.02%, and also decreased by 0.1% compared with the end of last year. The decrease in net interest margin was slightly higher than that of the stock bank, which will be discussed in detail in Section VI.
The scale of assets increased by 13.17% year-on-year, and increased by 4.93% compared with the same period last year. The scale of ABC’s assets has basically kept pace with ICBC’s rapid growth over the years, but the growth structure is different. Among them, the scale of loans has grown very fast, which has reduced the proportion of investment, so its recharge rate has never been as good as that of ICBC and CCB. Gradually increase. However, after the rapid scale expansion, its nuclear recharge rate has not declined, indicating that it has a certain endogenous growth ability. However, similar to ICBC, ABC’s endogenous growth mainly comes from lower credit costs, and its non-interest business is weaker than ICBC, so its revenue growth rate has always been low, and its net profit growth rate has also been dragged down.
The core tier 1 capital adequacy ratio increased by 0.26% year-on-year to 11.11%, which was 2.61% higher than the minimum requirement of 8.5%. Considering the counter-cyclical capital requirement of 2.5%, the current core adequacy ratio has just reached the standard. ABC has the lowest recharge rate in the fourth group (systemically important banks), and it is still necessary to continue to improve in the future.
2. Analysis of operating costs
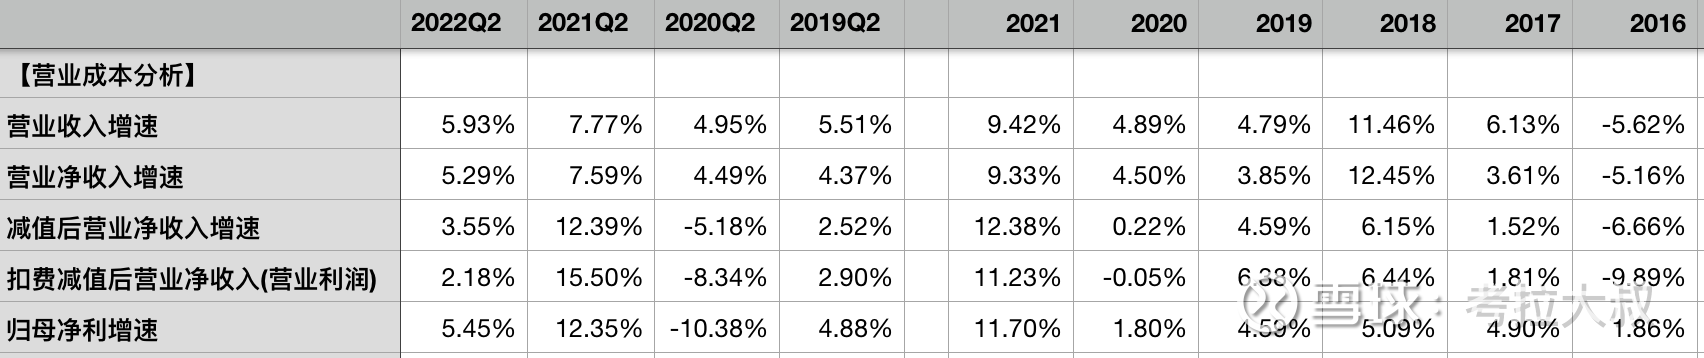
Table 2 – ABC’s revenue and cost disassembly in the first half of 2022
Calculation formula:
Net operating income = operating income – other operating costs
Note: The bank’s operating income is net income except for other business income (insurance, leasing and other business income) in non-interest income, such as net interest income and net fee income. Therefore, the real operating income of the bank should be the “net operating income” after deducting other business costs (insurance, leasing and other business costs).
Deducting other business costs from operating income is “net operating income”, which increased by 5.29% year-on-year in the first half of the year, slightly lower than the growth rate of operating income.
After deducting the credit impairment loss from the net operating income, the growth rate dropped slightly to 3.55%, indicating that the impairment of ABC basically matches the revenue. Whether the impairment is reasonable and whether it is affected by the revenue depends on the loan quality. , which will be discussed in detail in Section III.
On the basis of deducting credit impairment losses, and deducting business and management expenses, the growth rate further fell to 2.18%, which was slightly behind the growth rate of net profit of 5.45%, mainly due to the year-on-year decrease in income tax expenses (increase in tax-free assets). such as the allocation of treasuries and government bonds).
Operating and administrative expenses increased by 5.93% year-on-year in the first half of the year, of which employee compensation increased by 2.63% year-on-year, depreciation and amortization expenses increased by 2.51%, and general administrative expenses increased by 19.12%. Agricultural Bank did not give any explanation for business management expenses in the interim report. The growth rate of employee salaries and property equipment expenses was relatively low, but the increase in administrative expenses was relatively fast, which may be caused by the increase in card issuance or storage fees. It is related to the increasing debt pressure year by year, which will be discussed further in Section VI.
3. Loan quality and provision analysis
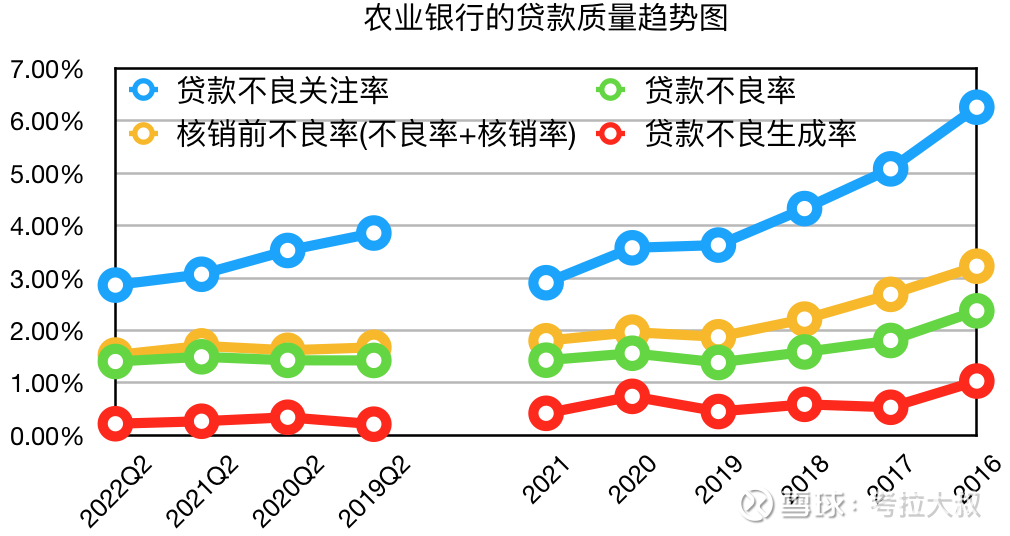
Figure 1 – ABC’s Loan Quality Trend Chart
As shown in Figure 1, in the first half of the year, the non-performing loan ratio of ABC (green line in the figure) decreased by 0.09% to 1.41% year-on-year, and decreased slightly by 0.02% compared with the end of last year. The non-performing ratio of ABC basically fell to the same level as that of Industrial Construction in 2018. The same low level as in China, but it was relatively high from 2015 to 2017, so the stability of its loan quality still needs the test of time.
The non-performing concern rate (non-performing rate + concern rate, the blue line in the figure) decreased by 0.2% year-on-year to 2.87%, and decreased slightly by 0.04% from the end of last year. This indicator has been lower than ICBC and CCB since 2019, reflecting the recent years. ABC’s loan quality is very solid.
The non-performing rate before write-off (non-performing rate + write-off rate, the yellow line in the figure) decreased by 0.18% to 1.53% year-on-year. This indicator also dropped to a level close to that of construction in 2018. It is currently the highest among the four major banks. lowest.
Note: Since the indicator of non-performing rate only reflects the status on the report day, that is, a snapshot on June 30, the non-performing level of the entire first half of the year can only be reflected after the write-off data is restored.
The non-performing generation rate (red line in the figure) decreased by 0.05% to 0.22% year-on-year, and this indicator also performed the best among the four major banks.
However, it should be noted that the asset-liability structures of the four major banks are very similar, and the project reserves are basically the same, so the homogeneity is relatively serious. At present, the asset quality of the Agricultural Bank of China is very good, and it is relatively the best among the four major banks. One reason is that the growth rate of ABC’s loans has been significantly higher than that of the construction industry in recent years, that is, the denominator has grown faster, resulting in relatively better indicators.
There has been a saying for many years that the asset quality of ABC is poor, because its non-performing rate and attention rate were relatively high before 2018, but this is mainly due to its late capital injection, restructuring and listing. Gongjianzhong was listed successively around 2006. In the year of listing, the non-performing attention rate of the three major banks exceeded 12%, and it did not drop below 5% until 2010. Of course, it also benefited from the round of loan expansion in 2009. The Agricultural Bank of China was only listed in 2010, and its non-performing concern rate exceeded 8%. In 2015, it caught up with a round of non-performing outbreaks, and its non-performing concern rate was close to that of Industrial Construction. That is to say, the poor quality of ABC’s assets in the past was mainly due to a time lag problem in the construction process, and the overall asset quality of the four major banks will be more similar in the future.
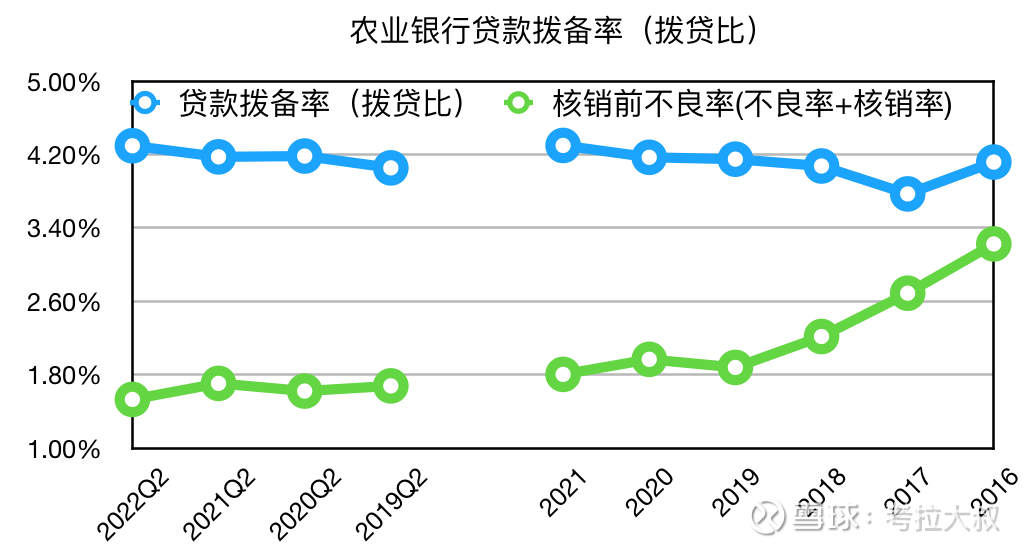
Figure 2 – ABC’s Loan Provision Ratio (Appropriation-to-Loan Ratio) Trend Chart
As shown in Figure 2, ABC’s loan provision ratio (appropriation-to-loan ratio, the blue line in the figure) increased by 0.12% year-on-year to 4.3%, and remained unchanged from the end of last year. Compared with the non-performing ratio before write-off of 1.53%, the loan-to-loan ratio is nearly three times that. In this way, the provision of ABC is quite high. However, historically, the loan-to-grant ratio of the Agricultural Bank of China has always been relatively high. For example, in 2012, the loan-to-grant ratio of the Agricultural Bank of China was 4.35% higher than it is now, while the non-performing ratio before write-off in that year was 1.4% lower than it is now. By 2015 The loan-to-disbursement ratio reached an all-time high of 4.53%, but after huge write-offs in 2016 and 2017, the loan-to-disbursement ratio dropped rapidly to 3.77% by the end of 2017, and then slowly recovered to the current level in the following years. Considering that from 2012 to 2015, the loan-to-appropriation ratio of the Agricultural Bank of China has been higher than 4.3%, and the current loan-to-appropriation ratio of the Agricultural Bank of China is not high. bad risk.
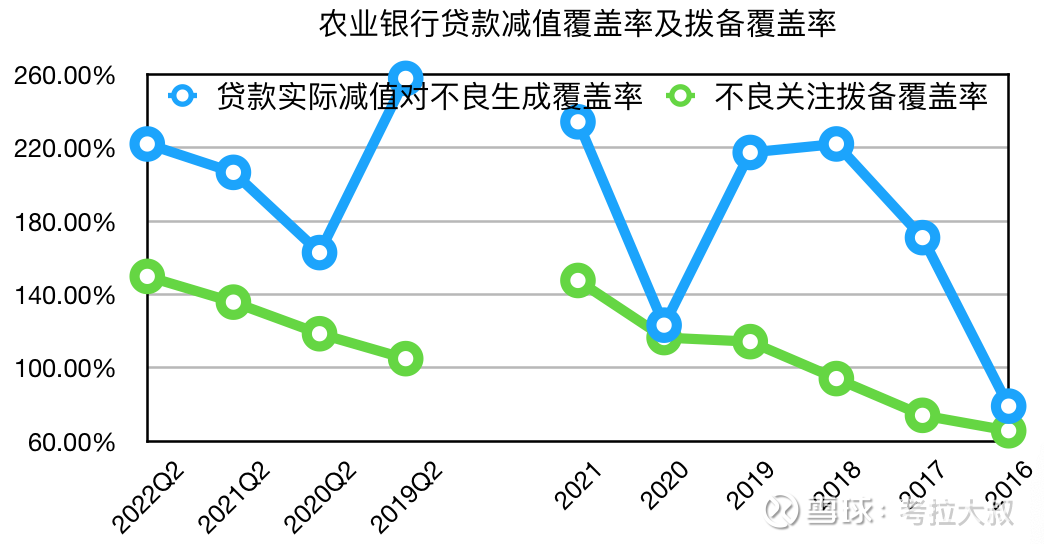
Figure 3 – Agricultural Bank Loan Impairment Coverage Ratio and Provision Coverage Ratio
Calculation formula:
Actual loan impairment = loan impairment loss + recovery of written-off loans – reversal of interest on impaired loans
Provision coverage ratio of non-performing special mention loans = balance of loan impairment provisions ÷ (non-performing loans + special mention loans)
Note: The loan impairment loss (accrued/reversed in the current period) announced in the statement is the net value after offsetting the recovery of the written-off loan. Using this indicator will actually underestimate the bank’s impairment strength.
As shown by the blue line in Figure 3, the coverage ratio of ABC’s actual impaired loans in the first half of the year relative to the newly generated non-performing loans was as high as 222.03%, indicating that its loan impairment in the first half of the year was quite sufficient. We can also see from Figure 3 that the impairment coverage ratio of ABC in the past five years has been higher than 200% for three years, so its loan-to-grant ratio can be maintained at more than 4% all year round.
As shown by the green line in Figure 5, ABC’s NPL provision coverage ratio increased by 14.02% year-on-year to 149.9%, and increased by 2.22% month-on-month. This indicator still shows that ABC’s provision is relatively sufficient and its ability to deal with potential non-performing risks is strong. .
Please see Table 3 for more detailed data:
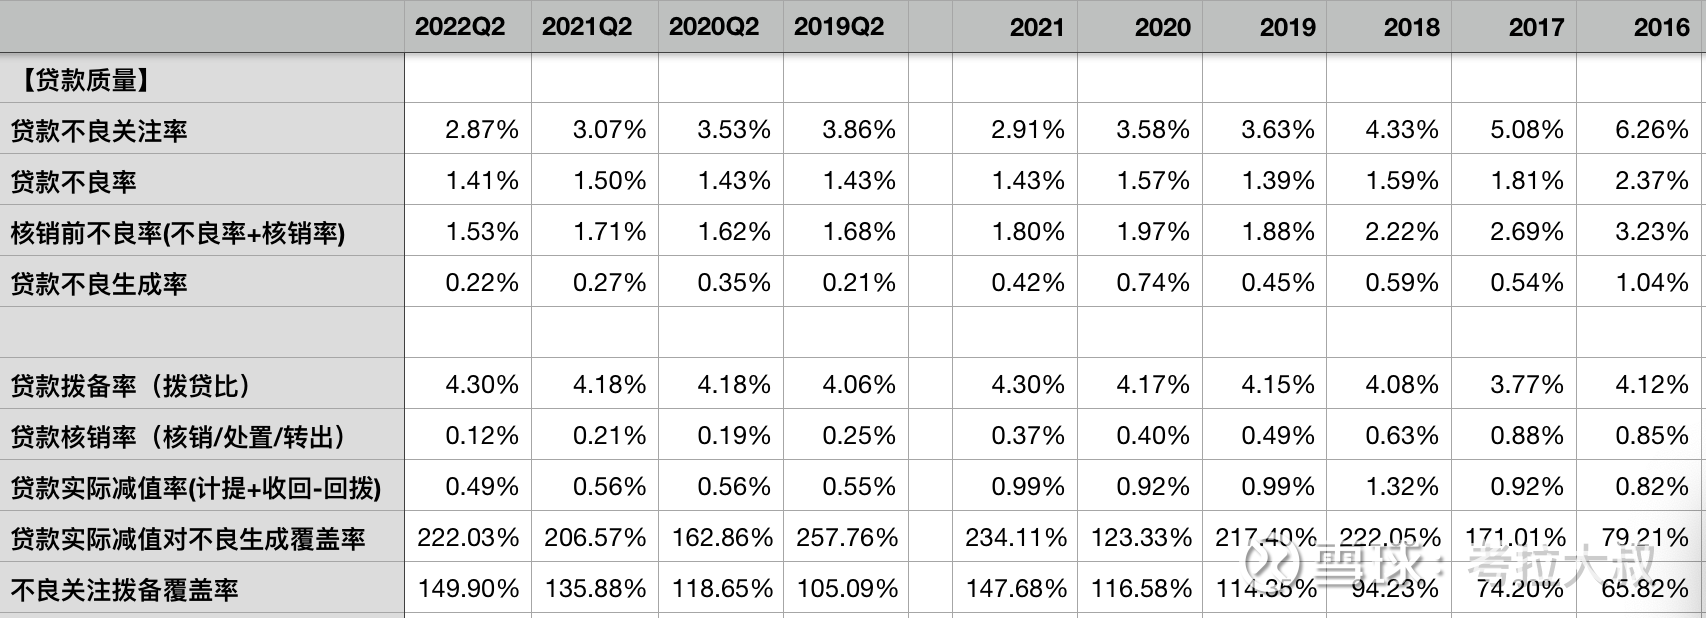
Table 3 – ABC’s Loan Quality and Provision-Related Indicators
4. Analysis of Debt Investment Quality and Provision
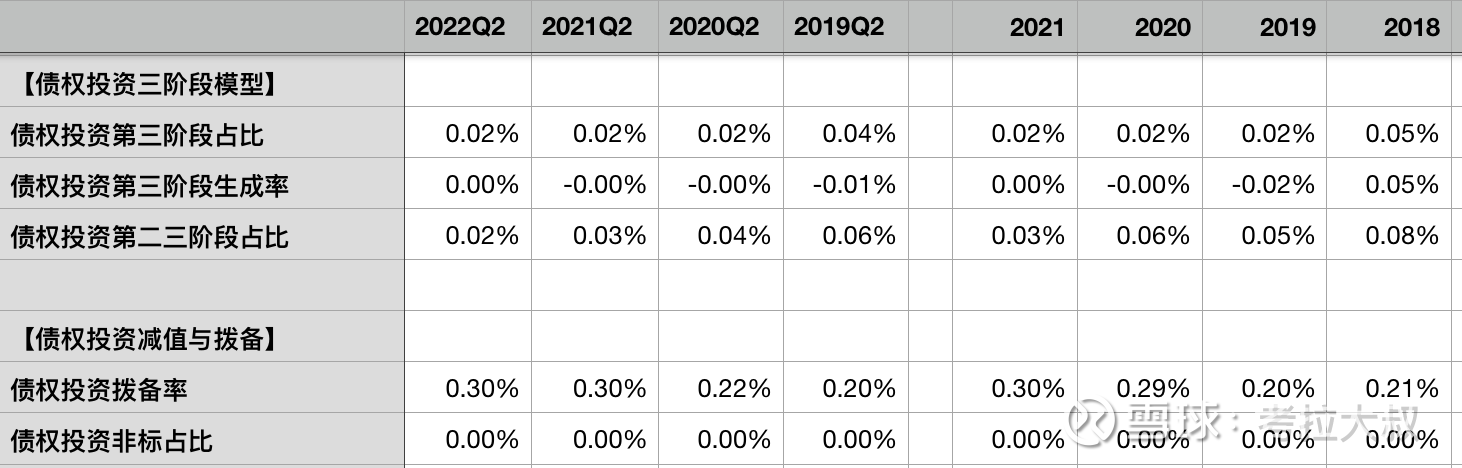
Table 4 – Debt Investment of Agricultural Bank of China
As shown in Table 4, the quality of ABC’s debt investment is even better than that of ICBC. The proportion of the third stage (similar to the non-performing rate) and the proportion of the second and third stages (similar to the non-performing concern rate) are almost zero, and there is no risk. It may be because none of the non-standard assets in ABC’s debt investment are bonds, and government bonds are the main ones.
V. Analysis of credit impairment and asset write-off
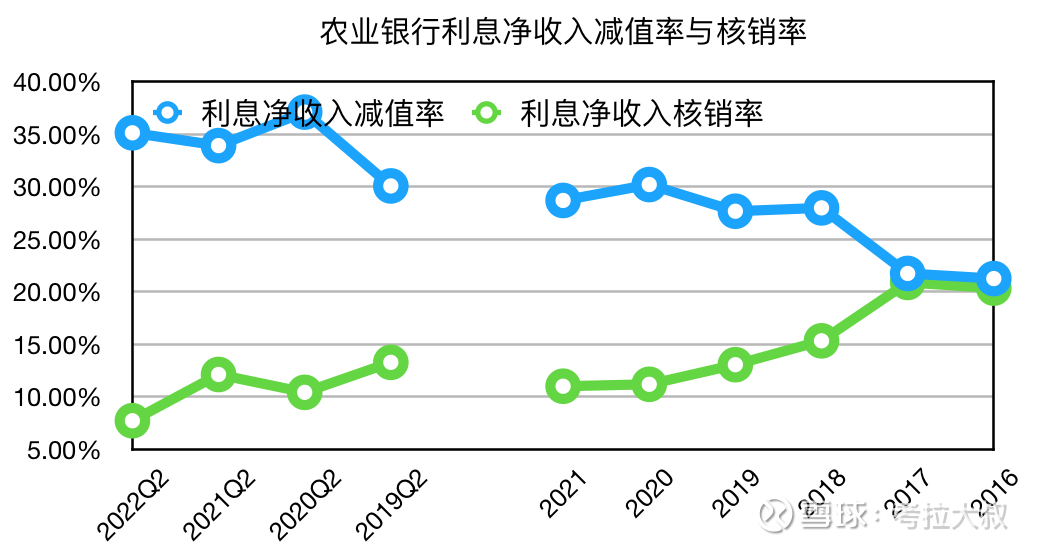
Figure 4 – ABC’s credit impairment and asset write-off as a percentage of net interest income
As shown in Figure 4, in the first half of the year, the proportion of ABC’s credit impairment loss to net interest income (the blue line in the figure) increased slightly by 1.22% to 35.15% year-on-year. Annually, it is below 30%, indicating that ABC’s credit cost is relatively low and its asset quality is relatively stable. Asset write-offs (loans + debt investment) accounted for the proportion of net interest income (green line in the figure), a year-on-year decrease of 4.41% to 7.7%. The overall write-off level was slightly higher between 2016 and 2018, and is currently very low. , but it may be precisely in order to prevent the situation from recurring in those years, the Agricultural Bank of China has maintained a relatively high loan-to-loan ratio.
6. Analysis of net interest margin
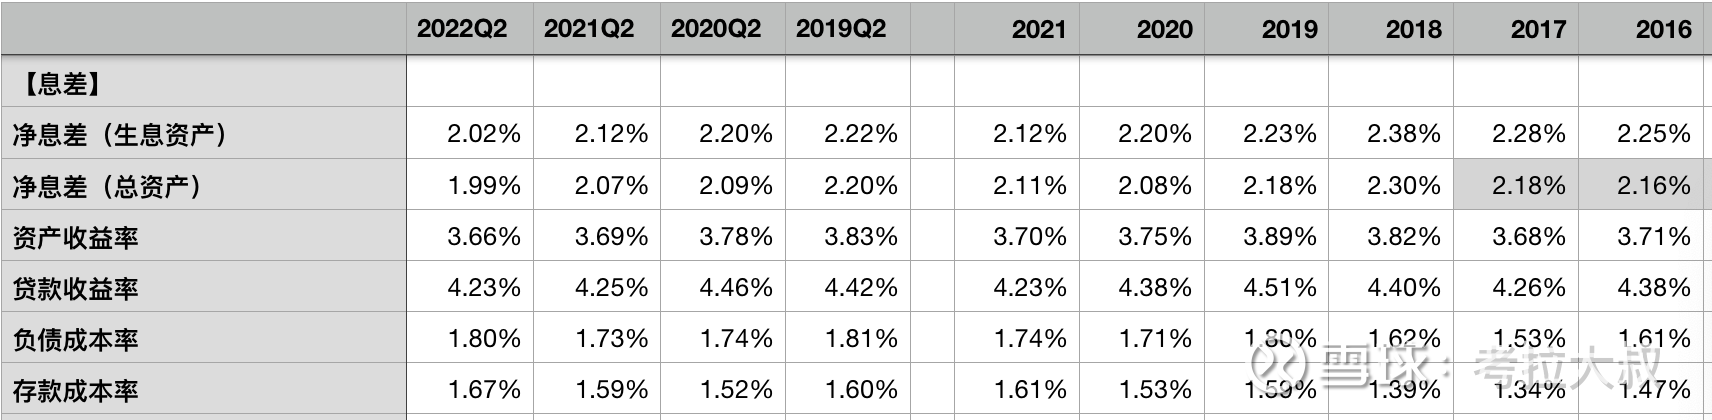
Table 5 – Agricultural Bank Net Interest Margin
Calculation formula:
Net interest margin (Industry Statement) = (net interest income + cost of liabilities corresponding to trading financial assets) ÷ average daily balance of interest-earning assets
Net interest margin (regular algorithm) = net interest income ÷ average daily balance of interest-earning assets
Net interest yield on total assets (net interest margin) = (net interest income + investment income) ÷ ((total assets at the beginning of the period + total assets at the end of the period) ÷ 2)
As shown in Table 5, the net interest margin of Agricultural Bank of China in the first half of the year was 2.02%, a year-on-year decrease of 0.1%, and a month-on-month decrease of 0.1%. Among them, time deposits increased by 14.8% from the end of last year, while demand deposits only increased by 6.74%, resulting in an increase of 0.06% in the cost of deposits.
The average daily deposit rate of ABC in the first half of this year is 11%, which is roughly 1 percentage point lower than that of ICBC, but it is still much higher than Industrial Bank’s 8.86% and China Merchants Bank’s 9.53%. %, while Societe Generale has only 4.58%. That is to say, the utilization rate of debts by large state-owned banks such as the Agricultural Bank of China is low, which largely offsets the debt advantages of the four major banks.
After the investment income was restored, the net interest margin (net interest margin) of total assets decreased by 0.08% to 1.99% year-on-year, and decreased by 0.12% month-on-month, which was also higher than that of the Bank. The reason is the same as that of ICBC. The proportion of tradable financial assets of ABC is also very low, and it has not enjoyed the increase in bond value brought about by the interest rate cut. This further shows that the advantages of large state-owned banks such as Agricultural Bank of China are gradually losing their debt advantages. In the process of continuously reducing the deposit rate, the proportion of interbank assets has not increased, and there is no excess debt to allocate trading financial assets.
Note: The net interest margin in the statement is calculated based on interest-earning assets and interest-bearing liabilities. There is a problem here, that is, the net interest income does not include the income from trading financial assets, but deducts the cost of all liabilities, so the investment income The higher the bank’s NIM, the more distortion. For more discussion, please refer to “In-depth exploration of bank financial reports (6) How to measure the profitability of bank assets? 》
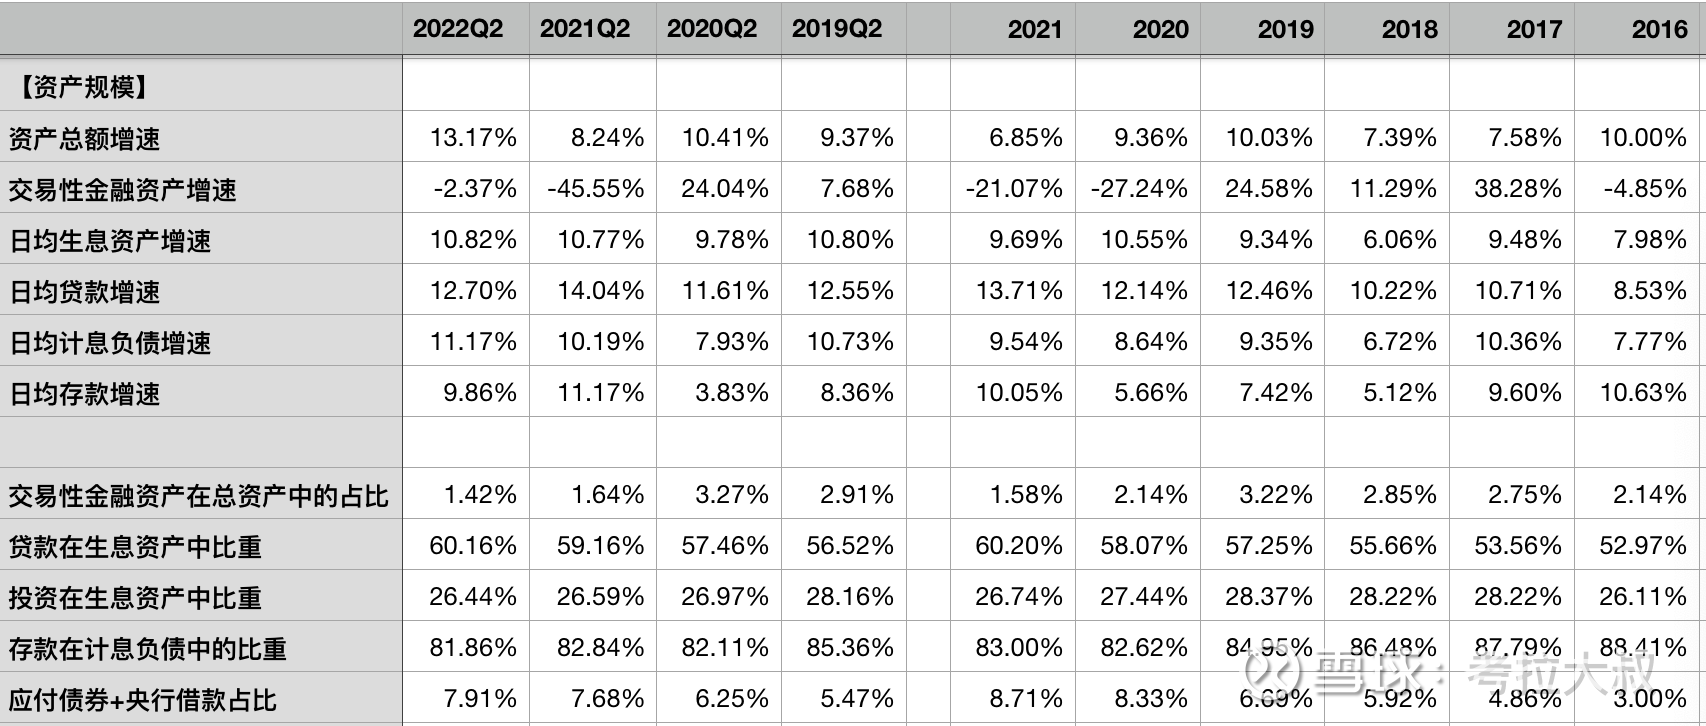
Table 6 – Assets of Agricultural Bank of China
As shown in Table 6, the growth rate of ABC’s interest-earning assets in the first half of the year increased slightly by 0.05% to 10.82% year-on-year, of which the loan growth rate was 12.7%, down 1.34% year-on-year. The loan growth rate has been very fast in recent years, the highest among the four major banks. The proportion of deposits in liabilities is slowly declining, from 88% in 2016 to less than 82% in the first half of this year, while the proportion of bonds payable and central bank borrowings has reached 8% in the same period. The cost of debt payable for bonds and central bank borrowings is much higher than that of deposits. The proportion of such liabilities in ICBC is less than 2%, and in joint-stock banks except China Merchants Bank, it is generally more than 15%. Storage pressure is increasing.
The reason behind this, as mentioned before, is that large state-owned banks have a high deposit rate, and when issuing loans to derive deposits, they need to pay more deposit reserves to the central bank, so large state-owned banks’ deposits are more attrition. If it is large, the pressure of holding storage is actually not small. The Agricultural Bank of China has the highest loan growth rate among the four major banks, and undoubtedly it has the most pressure on storage. Therefore, it is difficult to meet its debt needs by deposits alone. In the end, it can only maintain its liabilities through interbank certificates of deposit and central bank borrowings. expansion. Ten years ago, the debt cost of ABC was the lowest among the four major banks, but now it has become the highest. Fortunately, ABC’s debt advantage will not evaporate in an instant. However, according to the current trend, ABC may become the first state-owned bank among the four major banks to lose its debt advantage. This requires close attention.
7. Non-interest business analysis
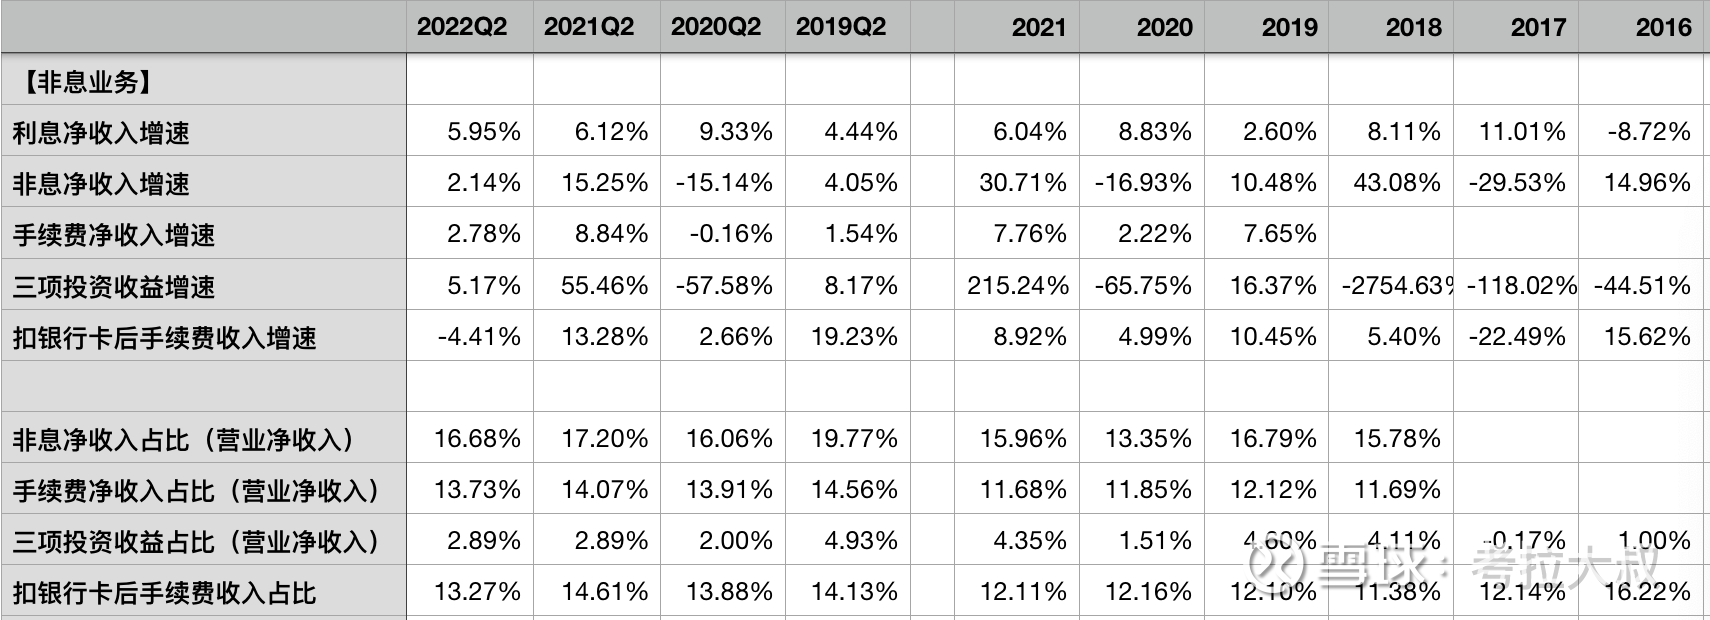
Table 7 – Growth Rate of Net Interest Income and Non-interest Income of Agricultural Bank of China
Calculation formula:
Three investment income = investment income + fair value change gain or loss + exchange gain or loss
Net non-interest income = non-interest income – other operating costs
Proportion of net fee income = net fee income ÷ net operating income
As shown in Table 7, ABC’s net interest income in the first half of the year increased by 5.95% year-on-year. Due to the continuous decline in interest margins, the growth rate of net interest income has always been significantly lower than the speed of asset expansion. obvious.
Net non-interest income increased by 2.14% year-on-year, of which three investment income increased by 5.17% year-on-year, but its trading financial assets accounted for a very low proportion and contributed little to revenue.
In the first half of the year, ABC’s net fee income increased by 2.78% year-on-year, of which the fee after deducting card fees decreased by 4.41% year-on-year. Further analysis, agency business fees (including agency sales of funds) increased by 0.9% year-on-year, and share consulting fees (may include wealth management and asset management income) decreased by 4.6% year-on-year, basically similar to the industry situation.
From the perspective of the proportion of net fee income, ABC has remained stable over the years, indicating that the growth of net fee income has been keeping pace with net interest income. However, due to the low base, ABC’s proportion of net fee income is the lowest among the four major banks. , compared with the stock line is also in the back. Moreover, there is no sign of improvement in this situation for the time being, indicating that the growth of ABC’s revenue in the future will still mainly depend on the expansion of asset scale, and increasing income by increasing loans will not only increase potential non-performing risks, but also A large amount of provisions should be made, thereby weakening the growth rate of net profit. For details on the relationship between ABC’s provision and net profit, please refer to “Can the Super-Provisioned Agricultural Bank Release Profits and Achieve Davis Double Click?” 》
8. Discussion on Valuation
Most of the bank’s net profit is used to supplement the core tier 1 capital, not free cash flow (the so-called fake money). Therefore, the valuation of bank stocks is not suitable for PE or PB based on net profit.
Here, the DCF (discounted cash flow) model based on dividends per share is used for valuation, which is at least more reasonable than directly using EPS to calculate PE or PB valuation.
The DCF model is relatively complex, but it is also very mature. We can directly use the quick calculation table in Table 8. For the specific calculation process, please refer to “Quick Calculation Sheet for Valuation Based on Discounted Cash Flow (DCF) Model (1) – Taking Kweichow Moutai as an Example”
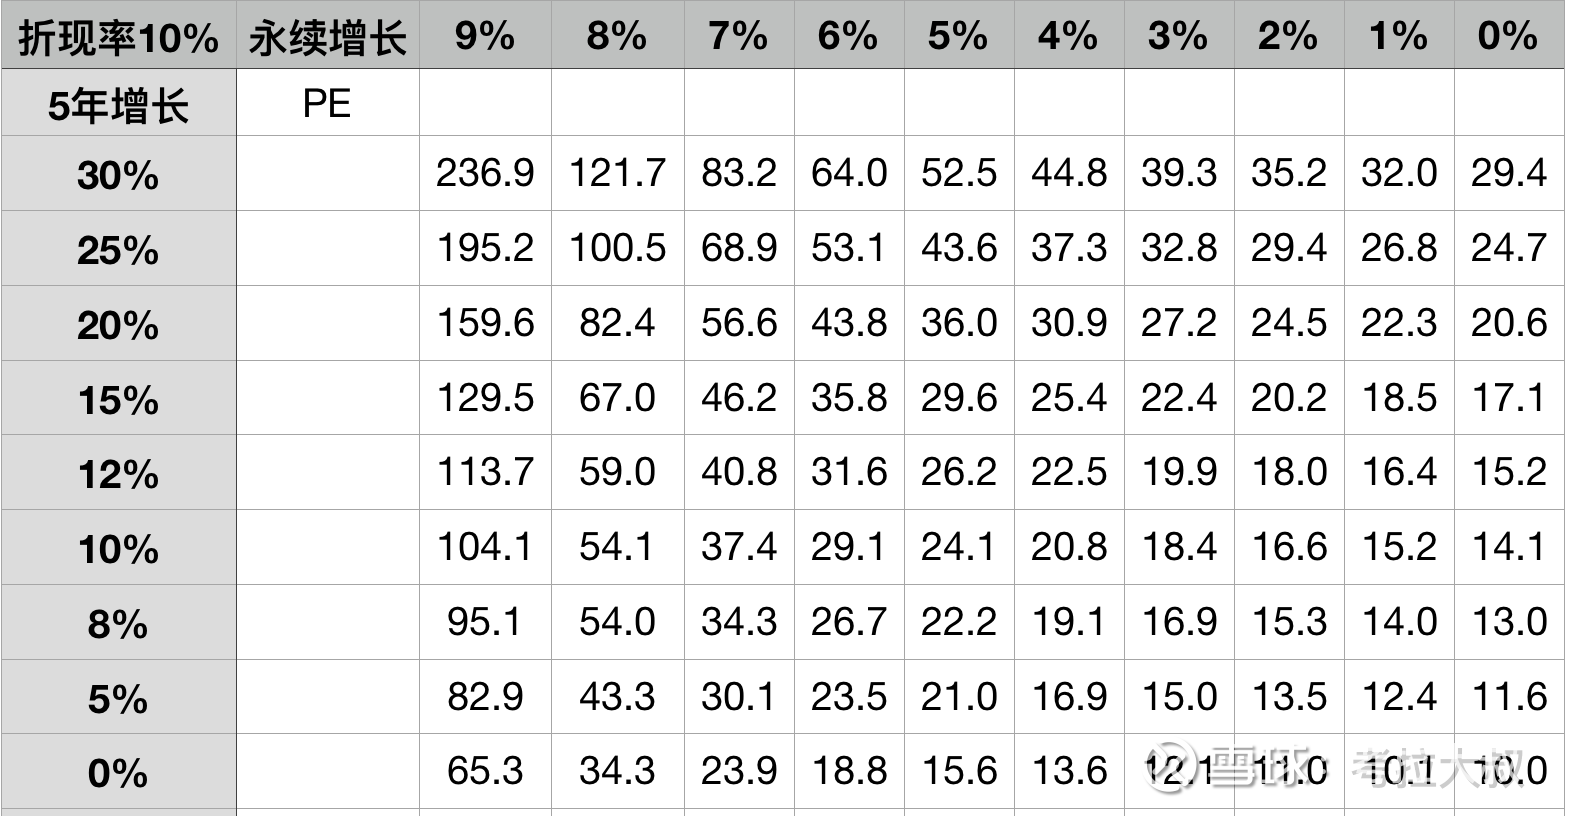
Table 8 – Valuation Quick Calculations for the Two-Stage DCF Model
Agricultural Bank’s dividend per share in 2021 is 0.2068 yuan, and the closing price on September 14 is 2.85 yuan, which is equivalent to 13.78 times the dividend per share PE.
From Table 10, we roughly take a set of data:
In the first stage, the annualized growth rate is 5%, and in the second stage, the sustainable growth rate is 2%, corresponding to 13.5 times of PE.
The conclusion is that if the dividend per share of Agricultural Bank of China can maintain an annualized growth of 5% in the next 5 years, and then maintain a sustainable growth of 2%, then if you buy it at a price of 2.85 yuan now, you can get an annualized income of 10%. .
If a simple DCF model (one-stage) is used, the valuation multiple of 13.78 is roughly equivalent to a sustainable growth of 2.5%. For details, please refer to “Valuation Quick Calculation Table Based on Discounted Cash Flow (DCF) Model (2) – Buffett’s Usage”
One sentence comment: The current valuation is reasonable and slightly undervalued, and the potential investment income is slightly over 10%.
Note: ABC Bank dividends per share, from the 2018 annual report to the 2021 annual report, the annualized growth rate is 5.95%; The seven-year annualized growth rate was 1.84%.
[This article is original, your likes and comments are the greatest support for my continuous creation! At the same time, you are also welcome to pay attention to “Uncle Koala Snowball” and receive my sharing in time! 】
$ China Merchants Bank (SH600036)$ $ Industrial Bank (SH601166)$ $ Agricultural Bank (SH601288)$
@Today’s topic @snowball talent show #snowball star plan# #Investment alchemy season in mid-2022#
This topic has 23 discussions in Snowball, click to view.
Snowball is an investor’s social network, and smart investors are here.
Click to download Snowball mobile client http://xueqiu.com/xz ]]>
This article is reproduced from: http://xueqiu.com/2836571636/230867414
This site is for inclusion only, and the copyright belongs to the original author.