
Regarding the enhancement of the broad base index, five articles have been written for in-depth discussion and analysis. (For details, please refer to the link at the end of the article.) Expanding the previous analysis today, let’s take a look at 13 index-enhanced funds. This article will first discuss the investment logic of index-enhanced products. Then, from the perspective of absolute return, analyze these products, and finally select the enhanced product of Wells Fargo CSI 1000 Index for in-depth analysis from the perspective of relative return.
investment logic
In my opinion, there are two main reasons for choosing index-enhanced products:
better investment tools
In this case, investors have obvious investment views on the future trend of the broad-based index. For example, they are more optimistic about the future growth style of small and medium-sized enterprises. The more suitable broad-based index is the CSI 500. Then choosing to choose the enhanced product of the CSI 500 index is a A tool that better expresses its investment views can obtain alpha returns in addition to the beta returns of the index.
excess returns as a margin of safety;
In this case, investors themselves do not have a clear investment view on the future market style, etc., and excess returns can be used as a margin of safety for misunderstandings. For example, the excess return of CSI 1000 has an annualized 13%. Even if the initial investment view is wrong, there is still a 13% return as a margin of safety. Private placement refers to higher excess returns, and this margin of safety is higher. If the investment view is just verified by the market, the superposition of this β+α return will have a higher excess return.
Of course, this division of investment purposes is not an absolute distinction of 0-1, and there are many situations in between.
absolute gain perspective
The following is an analysis of the differences and investment values of these 13 index enhancement funds from the perspective of absolute returns.
Below is the base case for 13 index-enhanced funds. Judging from the size of the fund, some have reached 6.4 billion, but some are less than 200 million. It is really a drought caused by drought, and a flood caused by flood. Some funds have been established for nearly 20 years, and it has been established for a long time.

Historical performance
From the perspective of annual income, because different broad-based indices have different underlying returns and different excess returns, the returns are different. What is more interesting is that in 2020, the state-owned enterprise dividend LOF has achieved very good positive returns, followed by the CSI Dividend Index. increase, but not much.
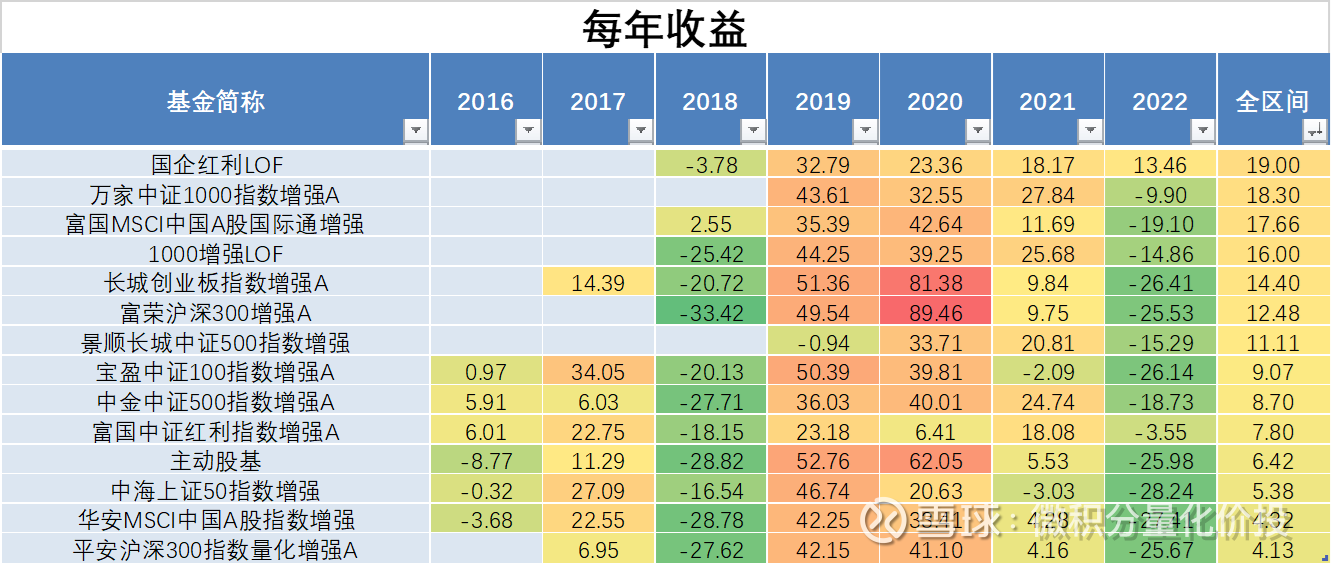
In terms of correlation, the correlation of different indices is not the same. Among them, the correlation between Wells Fargo CSI Dividend Index Enhancement A and SOE Dividend LOF is obviously different from others.

From the perspective of historical performance, from the perspective of performance evaluation indicators in the past five years, the best performance is the growth of the ChiNext Index and the China Securities 500 Index, and the relative performance is even better than that of the active stock base.

From the perspective of the past 4 years, the enhancement of some broad-based indices can also outperform active stock bases, and its Chinese corporate dividend LOF performance is better. The Wanjia CSI 1000 Index has been transformed in the early stage, so the data may be distorted.

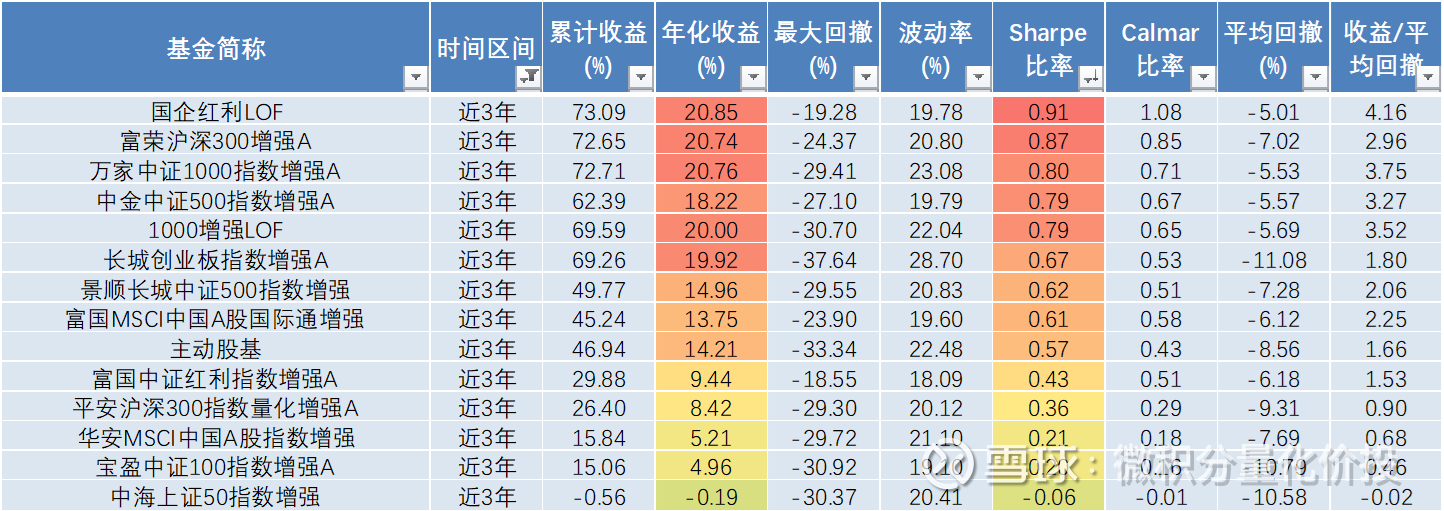
From the perspective of the past three years, there are still some broad-based indices that have outperformed active stock bases. From this point of view, it seems that outperforming the active stock base is not a particularly difficult thing.
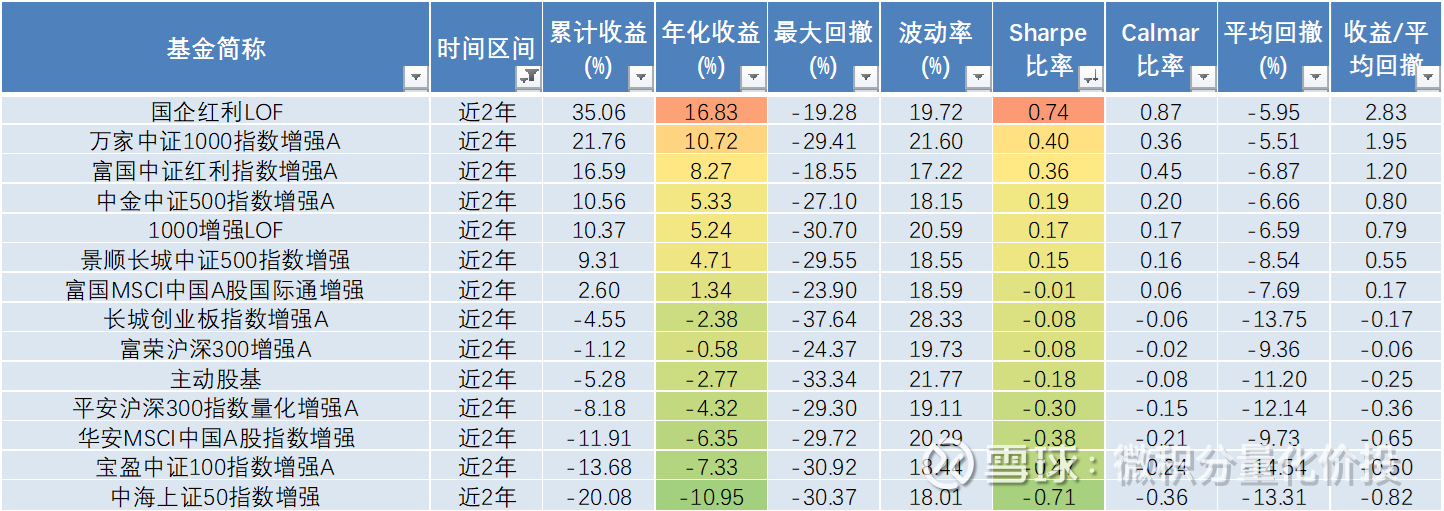
From the performance of the last two years, there are similar conclusions.
Overall, the best long-term historical performance is the state-owned enterprise dividend LOF, followed by the enhancement of the Furong CSI 300 Index and the enhancement of the Wanjia CSI 1000 Index.
Position Analysis
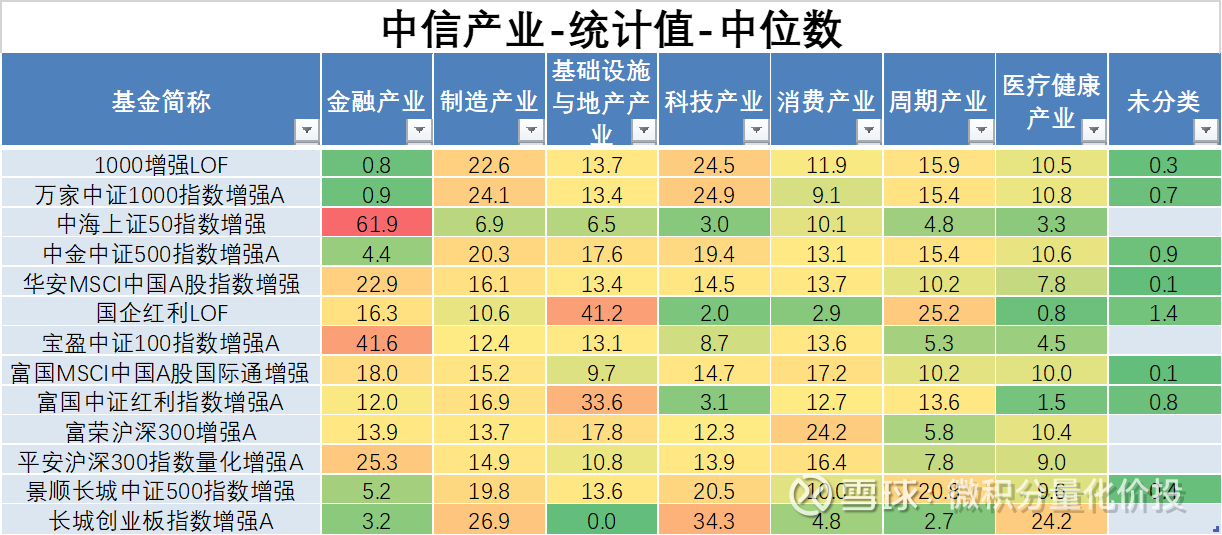
The following is an analysis of the holdings of different funds. The calculation is based on the statistical values in different reporting periods or the median of similar rankings, reflecting the overall holdings of the funds.
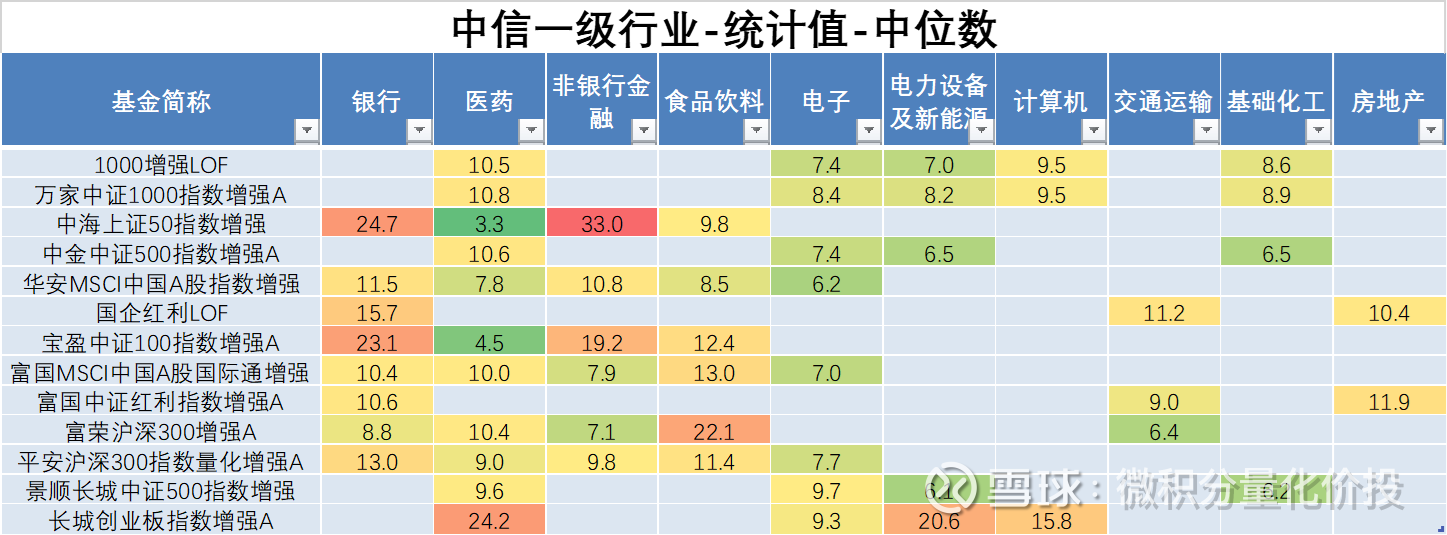
From the perspective of CITIC Industry, China Shanghai Securities 50 Index Enhancement and Baoying CSI 100 Index Enhancement have more positions in the financial industry, while SOE Dividend LOF and CSI Dividend Index have relatively more positions in infrastructure and real estate industries. Other indices are relatively balanced and do not particularly focus on a particular CITIC industry.
If it is subdivided into the first-tier CITIC industry, the China Shanghai Stock Exchange 50 Index will strengthen, mainly in the first time of banking and non-banking finance, and the Baoying CSI 100 Index will be similar. (Only consider some of the CITIC tier-one industries with relatively large positions). The Great Wall Growth Enterprise Market Index has strengthened, and the proportion of power equipment, new energy and computers is relatively large, and the Furong CSI 300 Index has increased in the proportion of food and beverages.
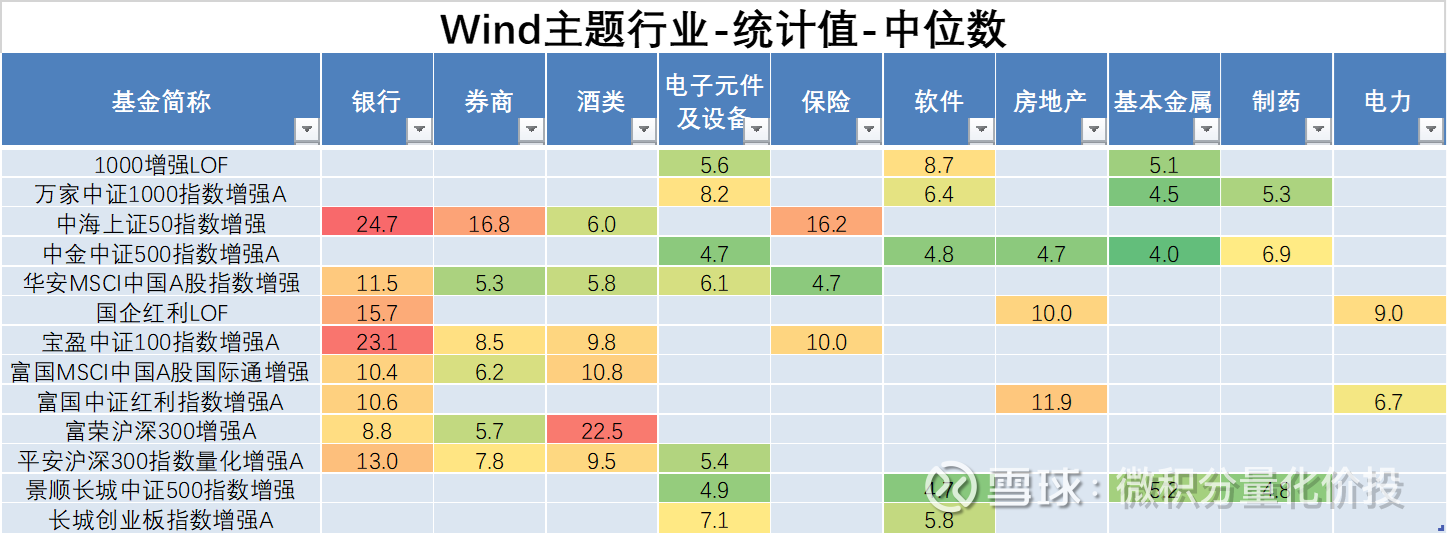
From the perspective of Wind-themed industries, China Shanghai Securities 50 are mainly financial industries such as banks, securities companies, and insurance, while Baoying China Securities 100 is relatively balanced. The dividends of state-owned enterprises with excellent historical performance are mainly the holdings of banks, real estate and power industries, and other indexes are also relatively balanced.
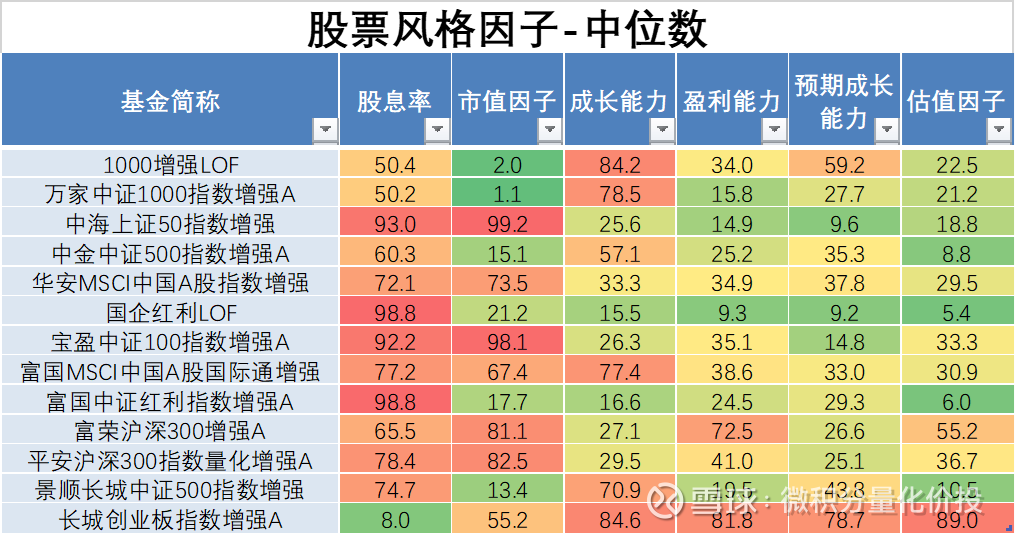
From the perspective of the style of stock holdings (the calculated ranking percentile of equity funds), the styles of each index are quite different. China Shanghai Securities 50, SOE Dividend LOF, Baoying CSI 100 Index strengthened, and Wells Fargo CSI Dividend Index strengthened. They clearly prefer high dividend strategies, and they are at the forefront of equity funds in terms of overall dividend yield. In addition, 1000 enhanced LOF, Wanjia CSI 1000 index enhanced, Wells Fargo MSCI China A shares, Great Wall ChiNext Index, have great exposure in growth capacity. The Furong CSI 300 Index also has a relatively large exposure in profitability.
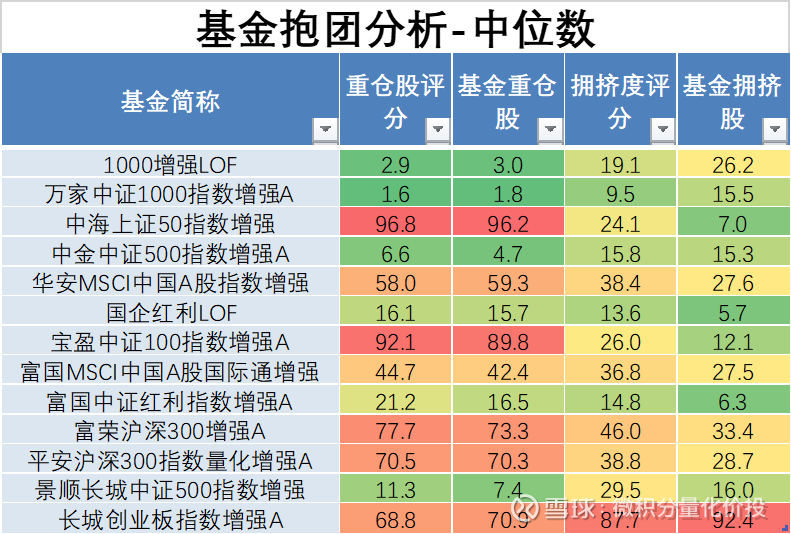
From the analysis of fund grouping, some broad-based index constituent stocks are more closely grouped, such as China Shanghai Securities 50, China Securities 100 Index, ChiNext Index, etc. On the contrary, 1000 strengthens LOF, Wanjia China Securities 1000 Index strengthens, CICC China The stock 500 index has strengthened, and the degree of cohesion is not high.
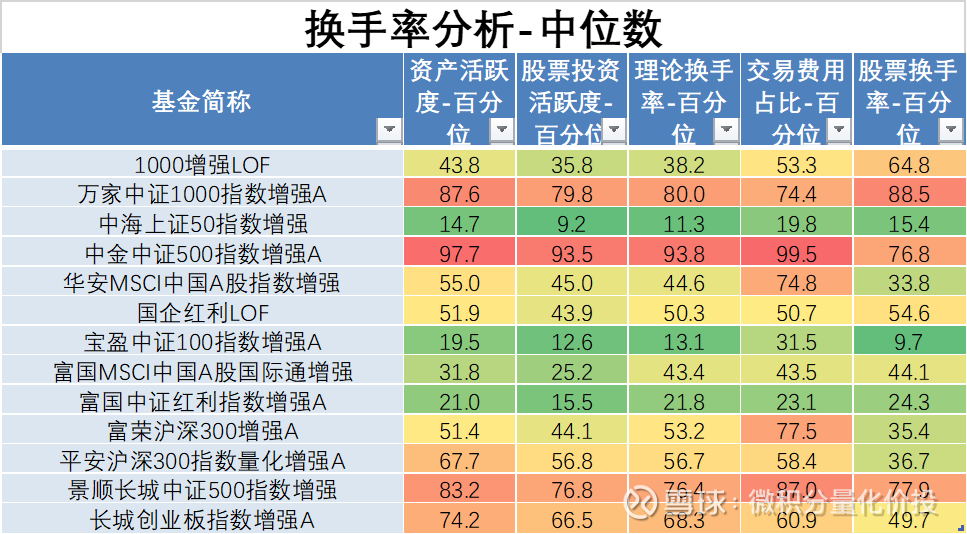
From the perspective of turnover rate, the turnover rate of different funds is also quite different. There are generally two categories for the implementation of exponential enhancement strategies, one is the index-based strategy based on fundamentals, and the other is based on quantification, such as multi-factor exponential enhancement strategies. The former has a relatively low turnover rate, while the latter has a relatively low turnover rate. relatively high. It is easy to see from the data below that the China Shanghai Securities 50 Index has strengthened, the Baoying CSI 100 Index has strengthened, the Wells Fargo MSCI China A-Share International Connect has strengthened, and the Wells Fargo CSI Dividend Index has strengthened. Fundamental index enhancement strategy. The Wanjia CSI 1000 Index has been enhanced, the CICC CSI 500 Index has been enhanced, and the Invesco Great Wall CSI 500 Index has been enhanced. The turnover rate is relatively high, and the quantitative index enhancement strategy.
new revenue split
The new revenue split refers to a very important factor in the analysis of incremental products. Because in my opinion, the new revenue is all excess revenue. Suppose a product’s new revenue is 5%, and the overall revenue is 20%, but the corresponding market index is 10%. If the contribution of the new revenue to the entire product is calculated, only 5%/20%=25%, but if you calculate the ratio of new revenue to excess revenue, 5%/(20%-10%) = 50%, that is, 50% of excess revenue is contributed by new revenue. Therefore, making jokes and not doing index-enhanced product analysis for new revenue analysis is a cool rogue.
From the point of view of the split of new revenue, the proportion of some new revenue is very exaggerated. This is mainly because the new income is mainly concentrated in 2029-2021. The numerator is basically unchanged, but the denominator is the rate of return of the entire range, which changes with market fluctuations. For example, it has fallen a lot recently, and the denominator is much smaller, but the numerator unchanged, so the proportion value will be exaggerated.

For example, if we look further at the strengthening of the Ping An CSI 300 Index, historically, new returns have been quite high, such as in the 2019-2021 range.

Looking at the strengthening of the Baoying CSI 100 Index, the new revenue from the second half of 2019 will be very high.

Judging from the above analysis, some funds’ new returns are still very high, and this part of the returns must be stripped during analysis, especially for funds that have recently grown rapidly in size.
Relative Return Perspective
Introduced above is an absolute return perspective to analyze 13 index-enhanced funds. The following introduces how to analyze funds from the perspective of relative returns, mainly the analysis of excess returns, and where the excess returns mainly come from. Some broad-based indices have been discussed in previous series of articles. For details, please refer to the previous articles:
“Public offering refers to the increase in investment value analysis”
“Analysis of SSE 50 Index Enhanced Investment Value”
“Shanghai and Shenzhen 300 Index Enhanced Investment Value Analysis”
“China Securities 500 Index Enhanced Investment Value Analysis”
“China Securities 1000 Index Enhanced Investment Value Analysis”
However, in the previous article, some readers have reported that I missed the analysis of Wells Fargo’s CSI 1000 index enhanced product. Here, I will use this product as an example to demonstrate how to analyze the excess returns of index enhanced products from a relative perspective.
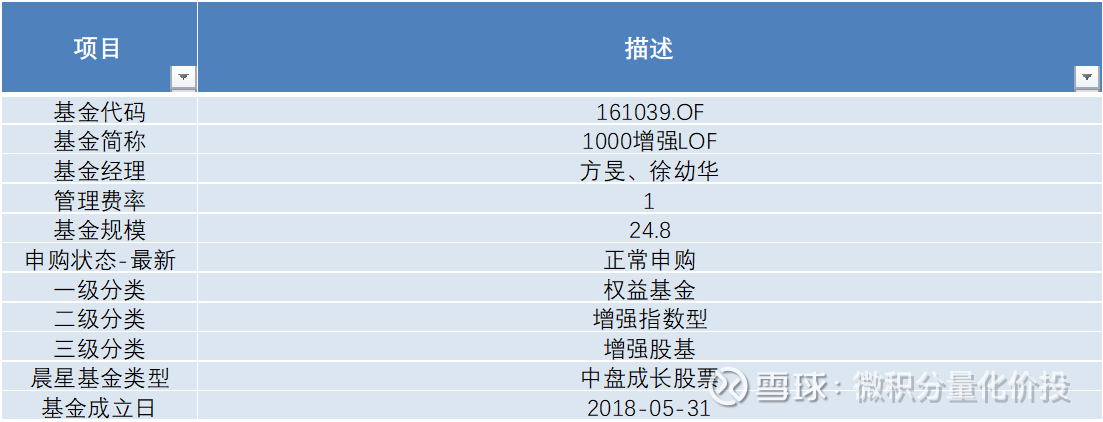
The following is the basic situation of the fund. The current fund scale exceeds 2 billion. For a small and medium-cap fund, this scale may be too large.
Historical performance
Judging from the trend of cumulative return, there is a certain excess return relative to the performance benchmark CSI 1000, and the excess return is relatively stable.
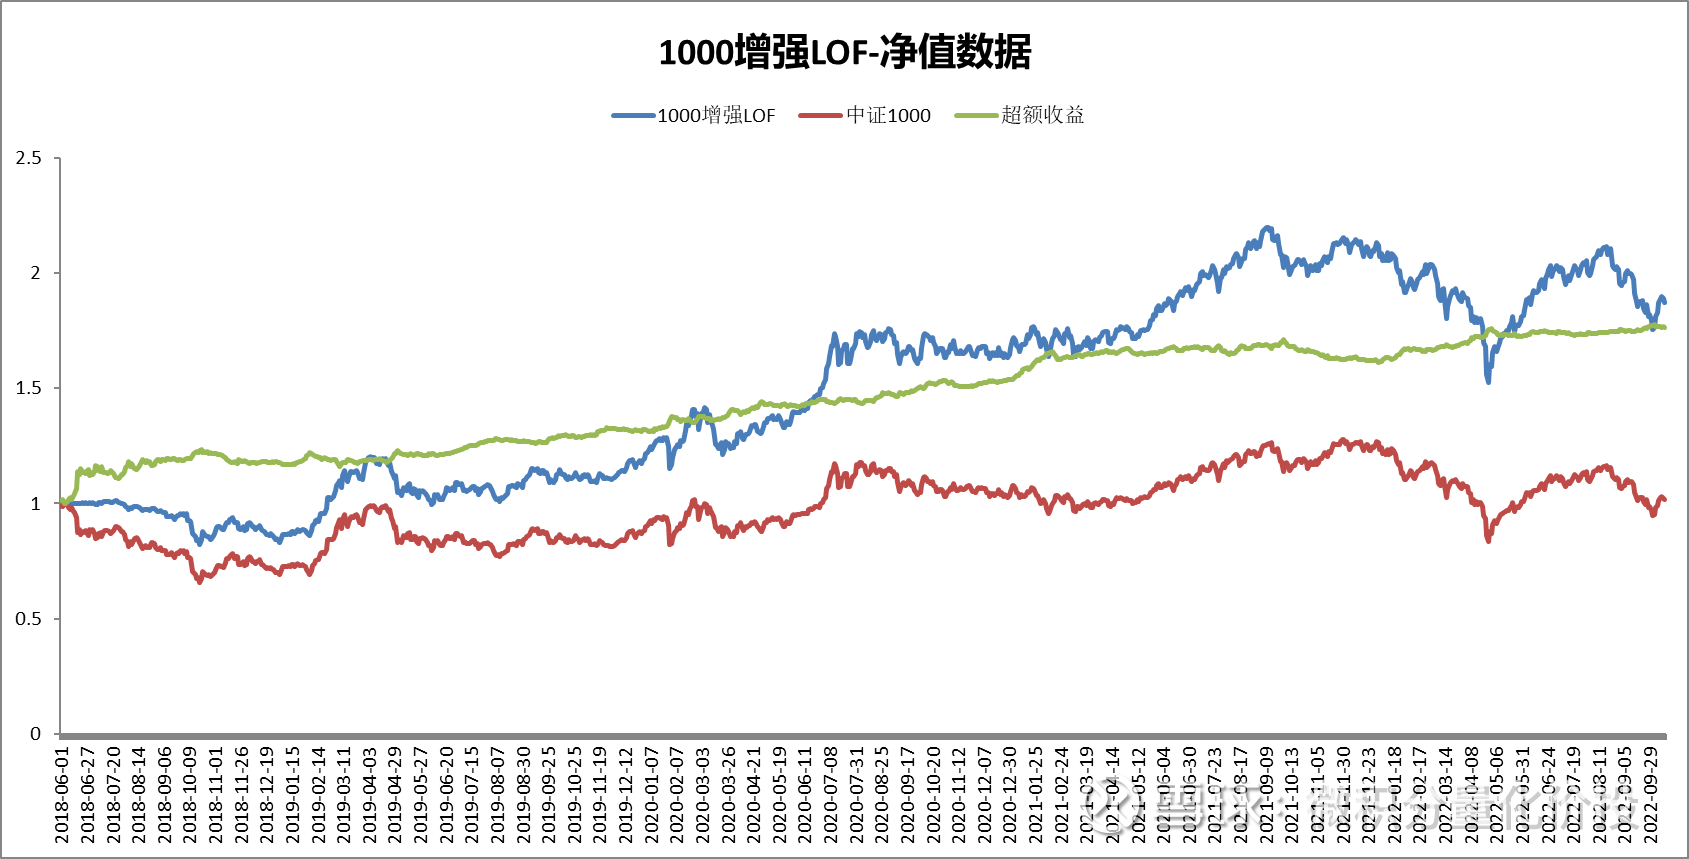
In terms of absolute returns, since its establishment in 2018, the annualized return has exceeded 16%, but the maximum drawdown has also exceeded 30%. The largest drawdown occurred this year, and the previous drawdowns were relatively small.

Let’s look at excess returns. The excess return is relatively stable, and the annualized excess return in 2018 is relatively high because of the time period. Since its establishment in 2018, the overall excess annualized return has been 14%, and the maximum excess return is only 5.9%. Overall, it is still very stable.

hit new income
From the perspective of new revenue split, the proportion of new revenue from this product is relatively high, especially from 2019 to the first half of 2021, the excess cumulative revenue in 2020 is about 16.7%, but the revenue from new sales is about 19%. That is, the real excess return is only 6.7%, and the proportion of new income is very high.

After the second half of 2021, the revenue from new sales dropped sharply, one was an increase in scale, and the other itself was a decrease in revenue from new sales. After 21 years, the scale has increased significantly, and the scale will be raised to 3 billion next time.
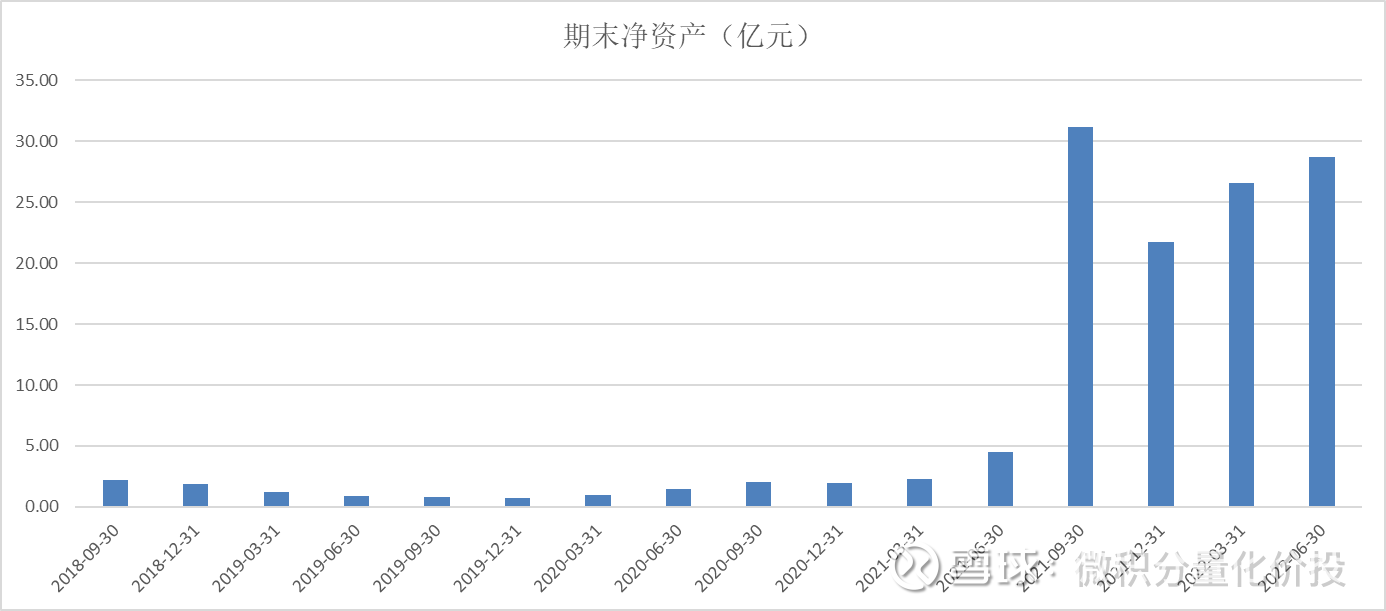
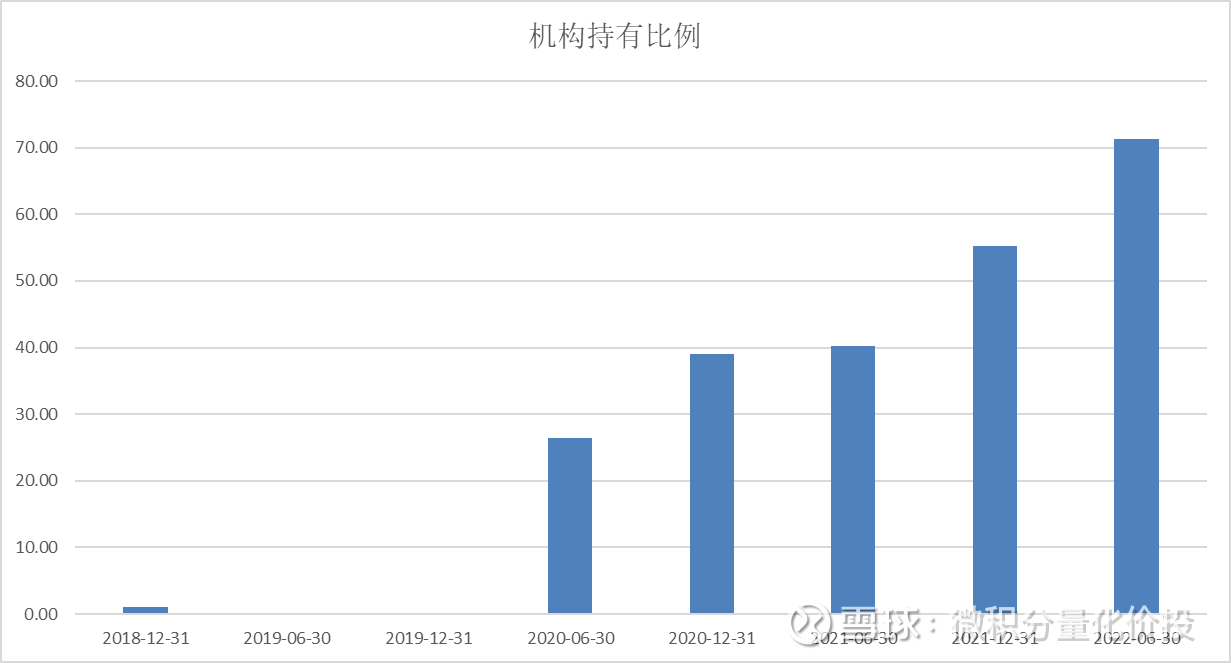
Much of this scale is institutional buy-in.
Position Analysis
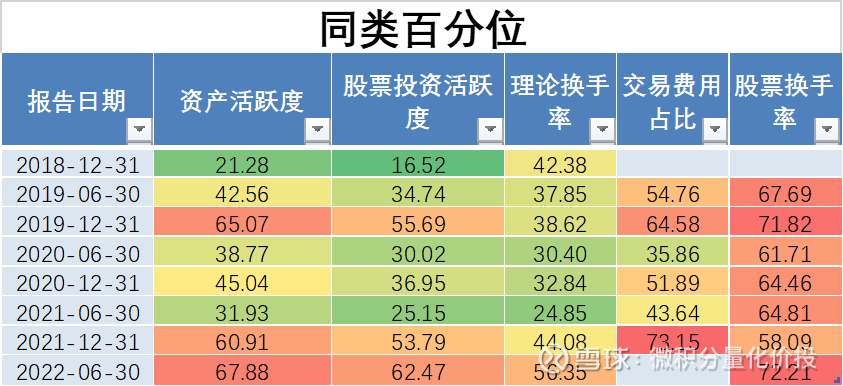
On the whole, the turnover rate of this fund is not particularly high, and it is in the middle of the whole market. It is initially inferred that this exponential enhancement may be a combination of fundamental and quantitative strategies.
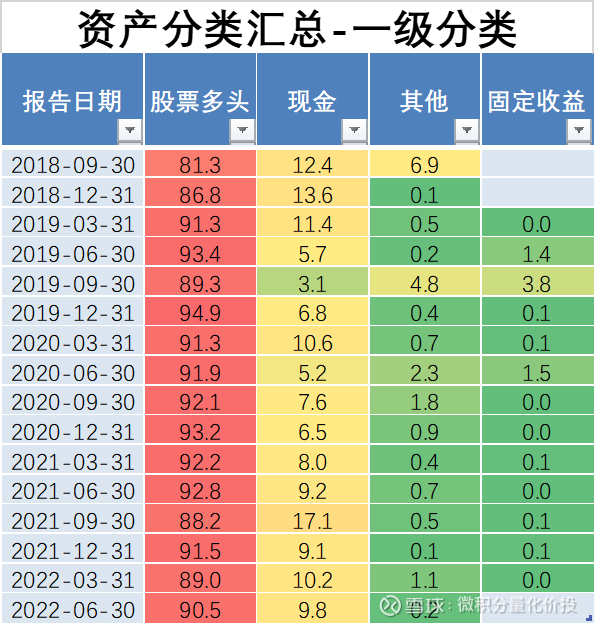
From the perspective of asset allocation, the fund’s equity position is basically more than 80%, and there is no stock index futures position.
From the perspective of the CITIC industry, the overall industry exposure is not large, the largest being no more than 4.3%.
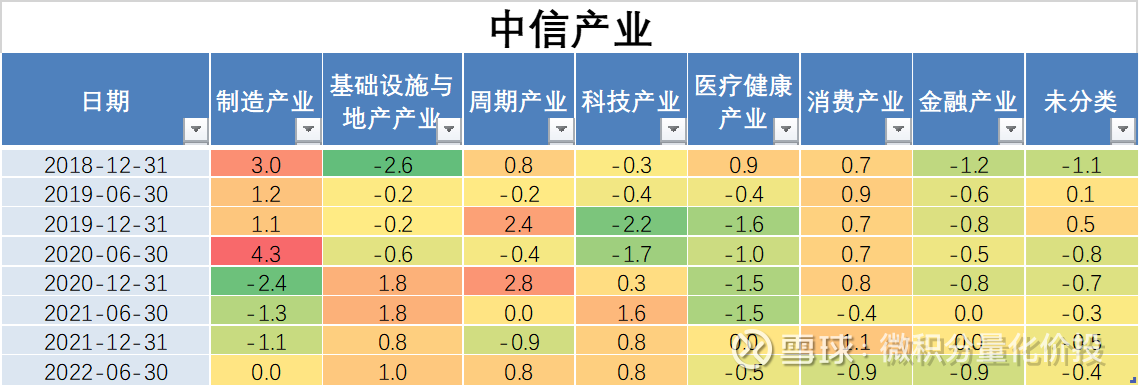
From the perspective of CITIC’s first-tier industry, the overall exposure is not high.

From the dimension of individual stocks, more than 80% of the stocks are index constituent stocks, and the exposure of individual stocks is very low.
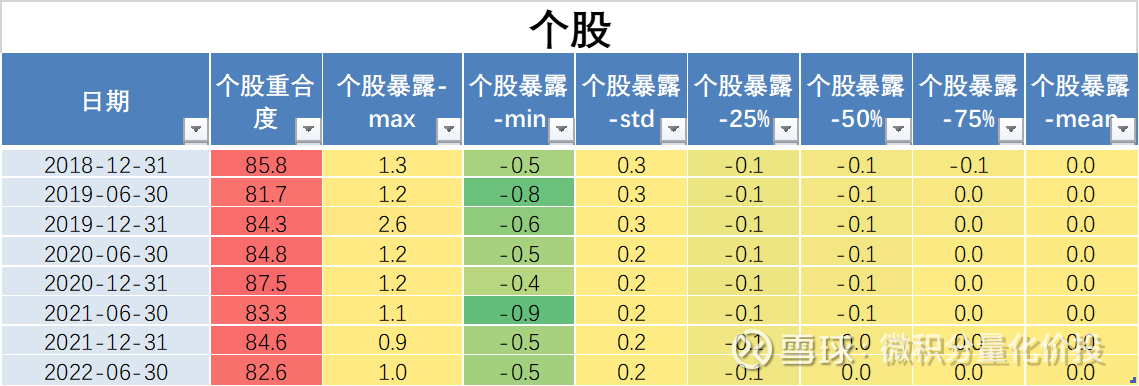
Taken together, the fund’s excess returns are not obtained by exposure to industries and individual stocks.
Let’s take a look at the style exposure situation. From the perspective of style exposure, it is obvious that there is a great exposure in the expected growth ability and growth ability. Relatively speaking, this fund mainly relies on the differential income obtained by exposing the growth style.

summary
The Wells Fargo CSI 1000 Index has strengthened, and the overall exposure to industries, individual stocks and industries is relatively small, mainly because of the gains from exposure to growth styles. This is similar to the style exposure of other index products.
The excess returns of the fund are relatively stable, but the proportion of new returns in history is relatively high. Considering the rapid rise in the fund size and the decline in the overall market returns, it is necessary to strip this part of excess returns during analysis. The focus should therefore be on excess returns beyond the second half of 2021, rather than linear extrapolation across the sample interval.
Summarize
There are two main investment logics for index enhancement. One is to find the optimal investment tool, and the other is to find a higher margin of safety. Different starting points will lead to completely different investment decisions.
From the perspective of absolute returns, different index-enhanced products have different overall performance, position industry, style exposure, etc. because of different underlying index conditions, and specific issues need to be analyzed in detail. For example, state-owned enterprise dividend LOF has high exposure in dividend yield, but GEM index enhancement has high exposure in growth style. However, I was a little surprised to find that the long-term historical performance of the state-owned enterprise dividend LOF turned out to be the best, and it outperformed the active stock index.
From a relative return perspective, the focus is on analyzing the sources of excess returns. Among them, the new income analysis is very important. From the previous analysis, the new income of many funds contributed a large part of the excess return. If you directly extrapolate the fund’s income into the new income directly, there will be a big problem. In addition to new earnings, the analysis of positions, industry exposure, and individual stock exposure also need to be considered. Judging from the case of the enhancement of the Wells Fargo CSI 1000 Index, this product also contributes a lot to the new income, and now the scale is relatively large. During the analysis, this part of the new income should be stripped. At the same time, this product is in the holding industry and individual stocks. The exposure control is better, and more is the excess return obtained from the exposure in the growth style.
At this point, the full text is over, thank you for reading.
If you find any mistakes or omissions in my analysis, please correct me and add them.
The above content is only used as a personal investment analysis record, and only represents personal opinions. The analysis content is based on historical data. Historical performance does not indicate its future performance. It does not serve as a basis for buying and selling, and does not constitute investment advice.

Like and watch, investment makes more ¥
#Calculus Quantitative Price Investment# #Snowball Star Project Public Offering Talent# # Lao Siji Hard Core Evaluation#
@ Egg Roll Index Fund Research Institute @ Today’s topic @ Snow Ball Creator Center @ Egg Roll Fund @ golfer welfare @Ricky
Quickly retrieve historical articles
$ Wells Fargo CSI 1000 Index Enhancement C (F013331)$ $ State-owned Enterprise Dividend LOF (SH501059)$ $ Million CSI 1000 Index Enhancement A (F005313)$
This topic has 0 discussions in Snowball, click to view.
Snowball is an investor’s social network, and smart investors are here.
Click to download Snowball mobile client http://xueqiu.com/xz ]]>
This article is reproduced from: http://xueqiu.com/4778574435/233422336
This site is for inclusion only, and the copyright belongs to the original author.