
The Background of the Rise of Multimodal Algorithms
Office documents are the most basic and important information carrier in all walks of life. Whether it is finance, government affairs, manufacturing, retail, etc., various types of documents are indispensable digital data in the process of business flow. Taking bank credit as an example, a credit business needs to involve financial reports, bank statements, trade contracts, invoices, due diligence reports, approval opinions, meeting minutes and other materials in the whole process from pre-loan to post-loan. The format and content are very different, but they are all descriptions of the same credit business from the perspective of different roles and different business perspectives. Each material carries important business data. Comprehensive and accurate value extraction of these materials, and the collection of all materials to achieve full-process data penetration are the problems that need to be solved urgently in the aforementioned credit business. How to extract key elements and data from massive historical documents and build data assets is also an important topic for digital and intelligent transformation in various industries.
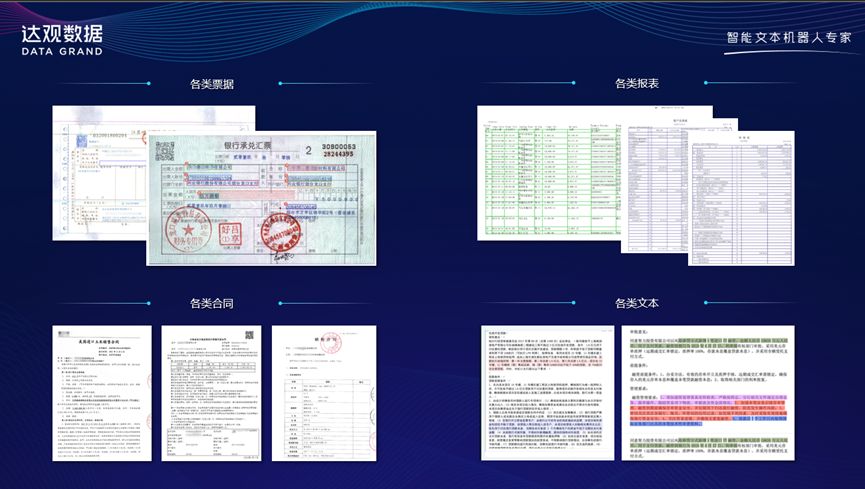 Figure 1 Various materials and key elements required for bank credit business
The core technical difficulty is to discover and extract valuable content from original office documents, which is also a prerequisite for data asset construction. Daguan Data has long been committed to the intelligent processing of office documents, that is, through a comprehensive analysis of document formats and a comprehensive understanding of document content, core business information can be extracted. Different from the problem of traditional plain text semantic understanding, in addition to text, office documents also contain a large number of tables and pictures that contain important data, and even the typesetting, layout, columns, text format, etc. of the document also imply Information about whether there are key elements in a piece of text, and the importance of the elements.
Therefore, for the intelligent analysis of office documents, it is necessary to comprehensively consider information such as text, images, and typesetting layouts. It is difficult to achieve satisfactory results by simply processing text information. The multimodal algorithms that have emerged in recent years have shown good results in this direction. The general document understanding pre-training model LayoutLM model proposed by researchers at Microsoft Research Asia is a representative method. The model is currently open source. and has been released to version 3.0, and each version has achieved leading results in a series of document understanding tasks.
In general, the LayoutLM algorithm deeply integrates text information and visual information, realizes multi-modal end-to-end pre-training, uses a large amount of unlabeled document data for joint learning of text and layout layout, and can learn document The local invariant information in , avoids the problem that traditional methods require a large amount of labeled data. LayoutLM has achieved leading results on multiple downstream document understanding tasks since its launch. This article will focus on the core algorithm of LayoutLM and its evolution process, and introduce Daguan’s optimization and adjustment based on multi-modal technology to solve various data problems of real office documents in actual scenarios.
BERT
Before introducing LayoutLM, you need to introduce BERT first. The two models are highly correlated. In the field of NLP, BERT is the most breakthrough technology in recent years. A pre-training model proposed by Google AI Research Institute in October 2018 has refreshed the SOTA of many evaluation tasks in the field of NLP, causing various wide attention of the industry. Bert uses the Encoder module in the Transformer architecture, which enables Bert to have better feature extraction capabilities and language representation capabilities. The BERT structure has two steps of pre-training and fine-tuning. Introduce two core tasks in Bert’s pre-training: 1. The masked language model (MLM) randomly occludes the input token, and the training goal is to restore the masked token 2. The next sentence prediction (NSP) is a binary classification task, which combines a pair of Sentences are used as input to determine whether they are coherent sentences.
The pre-trained Bert model increases its ability to extract contextual information and capture semantic connections between sentences. Due to the good pre-training model, when doing specific downstream tasks, a simple fine-tune method can achieve good results.
LayoutLM 1.0
LayoutLM 1.0 draws heavily on the BERT model, including model pre-training and fine-tuning. In NLP tasks, only text information is usually used. There is a wealth of visual information in office documents that can be encoded into the pre-training model and used as the feature input of the model.
LayoutLM1.0 uses the Bert architecture as the backbone, adding the features of the layout layout:
- 2-D positional features; unlike positional embeddings, which model the positions of words in sequences, 2D positional embeddings aim to model relative spatial positions in documents.
- Image features: In order to use the image features of the document and align the image features with the text, add an image embedding vector layer to the model. Faster R-CNN is used to extract features.
The model structure of LayoutLM 1.0 is shown in the figure below: 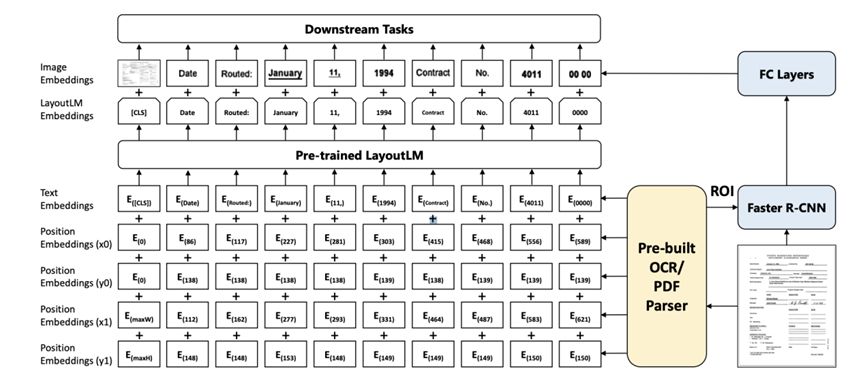 Figure 2 LayoutLM 1.0 model structure
Among them, the 2-D position feature encodes the spatial position relationship in the document (the 2-D position information comes from the result of OCR recognition, and all coordinate points will be standardized to 0-1000). A document can be regarded as a coordinate system, the upper left corner of which is the coordinate origin (0,0). For a word, its bounding box can be represented by the coordinates of the upper left point (x0, y0) and the coordinates of the lower right point (x1, y1), and finally converted into 2d position embedding. At the same time, LayoutLM inputs word slices into the Faster R-CNN model to generate image features corresponding to each word slice. Each word token has a corresponding image feature, and there is a [CLS] at the beginning of bert, and the image feature corresponding to this token is obtained by using the entire picture as the input of FasterR-CNN, so as to Align the lengths of image features and text features. This is beneficial for downstream tasks that need to use [CLS] markup.
The LayoutLM pre-training task sets Masked Visual-Language Model (MVLM) loss and Multi-label Document Classification (MDC) loss for multi-task learning. The masking strategies of MVLM and Bert are similar. It also selects 15% of the tokens for prediction, 80% of the tokens replace these masked tokens with the [MASK] mark, 10% of the tokens are replaced with a random token, and 10% of the tokens still use the original tokens. The model uses cross-entropy loss as the loss function to predict masked tokens. However, LayoutLM1.0 retains its 2-D position information, so that the model can infer occluded words based on context and position information. In this way, the gap between visual features and language features can be reduced.
MDC multi-label document classification, aggregates different document features, and enhances the model’s ability to represent semantics at the document level. Since the MDC loss requires labels for each document image, which may not exist for larger datasets, it is optional during pre-training.
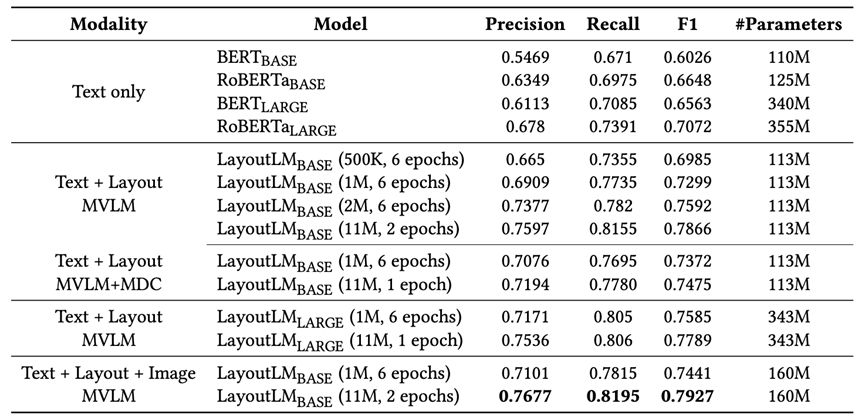
Experiments have proved that LayoutLM 1.0 has achieved very large accuracy improvements on multiple data sets. The first is the table understanding task, which sequentially labels the text content of the form. The dataset used is FUNSD, including 199 forms, 9707 semantic entities and 31485 words. Each semantic entity consists of a unique identifier, a label (i.e., question, answer, title, or other), a bounding box, a list of links to other entities, and a list of words. The dataset is divided into 149 training samples and 50 testing samples. On the FUNSD dataset, LayoutLM1.0, which adds visual information, has a significant improvement in accuracy compared to the plain text model. At the same time, it can be further improved when the amount of data is increased and the training time is increased. The specific results are shown in the following table. :
In the bill understanding task, it is necessary to extract bill information and classify each word with a semantic label. The SROIE data set is used to test the effect, including 626 training tickets and 347 test tickets. Each note is organized as a list of lines of text with borders. Each note is marked with four types of entities (company, date, address, total). The effect of LayoutLM LARGE has surpassed the model that ranked first in the competition list at that time. Detailed model results are shown in the table below: 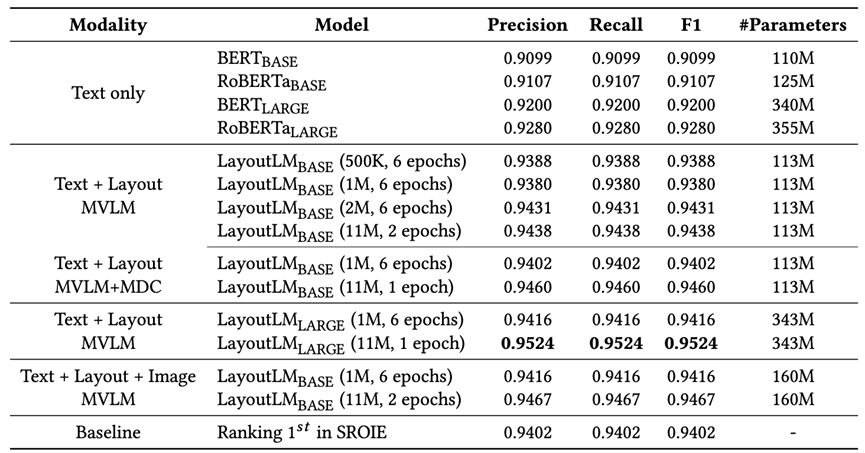
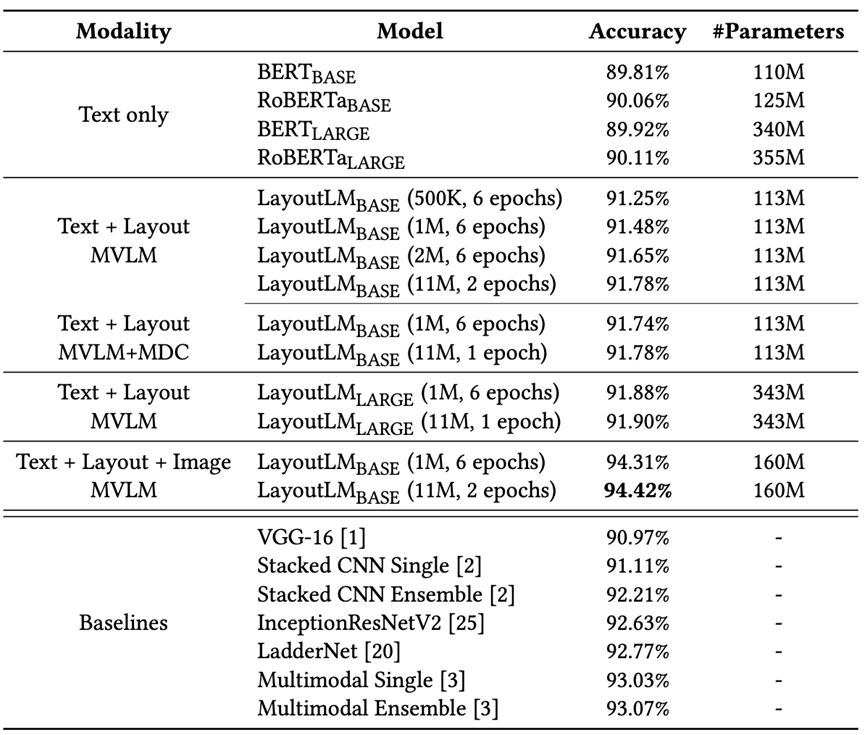
The purpose of document image classification task is to predict the category of document images. The RVL-CDIP dataset is selected, which consists of 400,000 grayscale images in 16 categories, with 25,000 images in each category. There are 320,000 training images, 40,000 validation images and 40,000 testing images. Categories include: letters, forms, emails, handwriting, advertisements, scientific reports, scientific publications, brochures, folders, news articles, budgets, invoices, presentations, questionnaires, resumes, memos, etc. Similarly, LayoutLM 1.0 has also achieved leading results.
LayoutLM 2.0
One year after the launch of LayoutLM 1.0, the researchers further upgraded the model and proposed the LayoutLM 2.0 model. The 2.0 model directly introduces image information in the multimodal pre-training stage to jointly model text, image and layout information. Compared with LayoutLM 1.0, the main structure of the 2.0 model has relatively large changes. It is a Transformer encoder network with a spatial-aware self-attention mechanism (spatial-aware self-attention), which stitches visual vectors and text vectors into a unified sequence. And add the layout vector to fuse the spatial information to get the input x(0) of the first layer:

Where v represents the image sequence, t represents the text sequence, W and H are the image width and height, and the length of the text sequence. Because the original self-attention mechanism can only implicitly capture the relationship between input tokens with absolute position cues, in order to effectively model local invariance in document layout, relative position information needs to be inserted explicitly. Therefore, a self-attention mechanism for spatial perception is proposed in this paper. The original self-attention mechanism maps the two vectors query Xi and key Xj, and then calculates the attention scores of the two:

Considering that the value range of position is too large, the model models semantic relative position and spatial relative position as bias terms to prevent adding too many parameters, and explicitly adds them to the attention score.
b1D, b2Dx, and b2Dy represent one-dimensional and two-dimensional relative position offsets, respectively. Different attention head biases are different, but shared across all encoder layers. Assuming (xi,yi) denote the coordinates of the upper left corner of the ith bounding box, the spatially aware attention score is: 
Finally, the output vector is expressed as a weighted average of all mapped value vectors with respect to the normalized spatial perception score: 
It further helps the model learn the relative positional relationship between different text blocks in the document image on top of the one-dimensional text sequence. 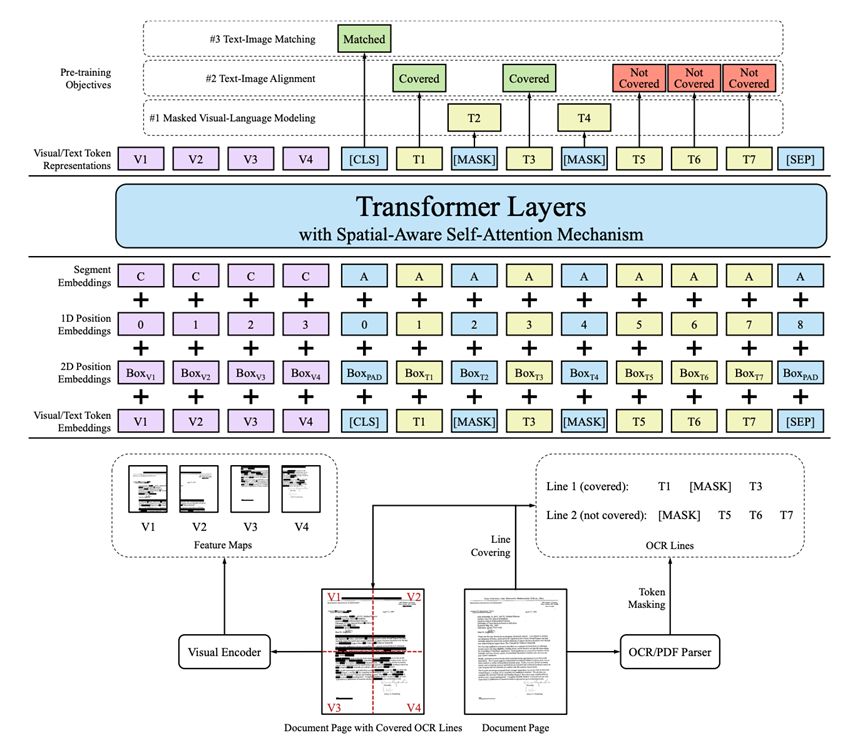 Figure 3 LayoutLM 2.0 model structure
On the pre-training task, LayoutLM 2.0 has added 2 text-image alignment and text-image matching in addition to the Masked Visual-Language Model (MVLM). Self-supervised tasks to help the model improve language ability and align modal information.
01 mask visual language model
2.0 extends the task of the masked visual language model, requiring the model to restore the covered words in the text according to the context, image information, and layout information. The masking operation simultaneously covers the words in the text and the corresponding areas in the image, but retains the spatial location information . In MVLM, 15% of text tokens are masked, 80% of them are replaced by special tokens [MASK], 10% are replaced by random tokens sampled from the whole vocabulary, and 10% are left as-is.
02 Text—Image Alignment
Text-image alignment is a fine-grained multi-modal alignment task. A part of the text is randomly covered by lines on the document image, and the output of the text part of the model is used for word-level binary classification to determine whether the text token is covered and calculate the binary intersection. Entropy loss:

where is the binary label value 0 or 1 and is the probability of belonging to the label value. 15% of the rows are covered by this task in order to help the model learn the spatial position correspondence between image and bounding box coordinates.
03 Text-image matching
Existing work has demonstrated that coarse-grained text-image matching tasks are helpful for modality information alignment. This task randomly replaces or discards part of the document image, constructs a negative sample of image-text mismatch, and predicts whether the image and text match by means of document-level binary classification, so as to align the matching information of text and image. In this task, 15% of the images are replaced and 5% are discarded.
The experimental results show that the accuracy of LayoutLM 2.0 has made a good improvement. On the form understanding FUNSD dataset, F1 reached 84.20%, and the results are shown in the following table: 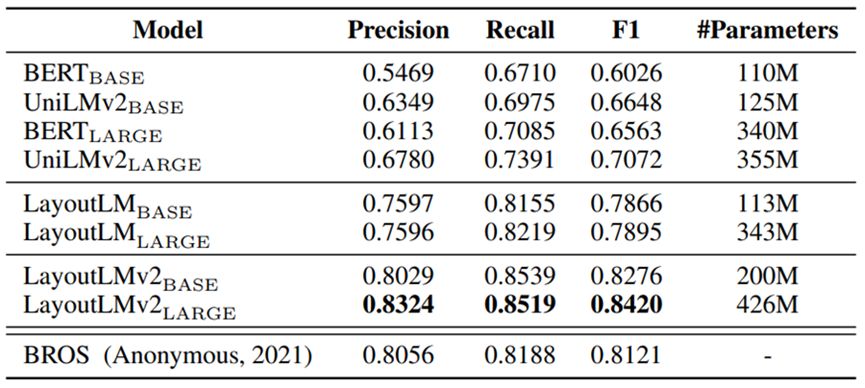
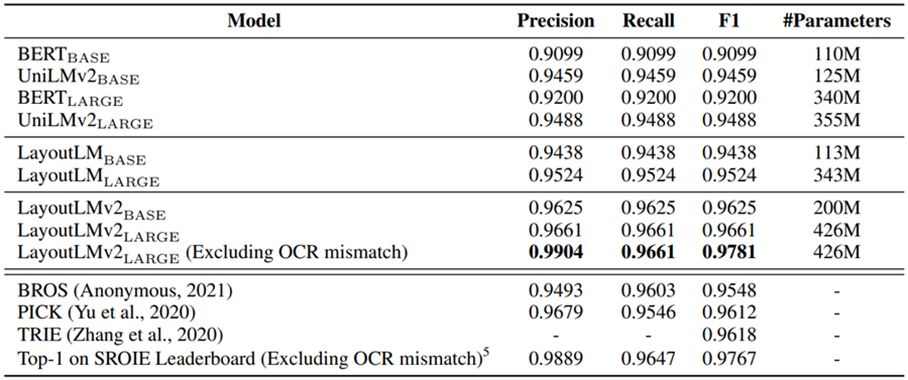
For the ticket understanding task, two datasets, CORD and SROIE, were used to evaluate model performance. The CORD dataset contains 1,000 scanned bill data, from which 30 types of key information entities such as name, price, and quantity need to be extracted. After fine-tuning the LayoutLM 2.0 model on this dataset, the F1 value reaches 96.01%. The effect of the LayoutLM 2.0 model on the SROIE dataset ranks first in the third SROIE evaluation task. 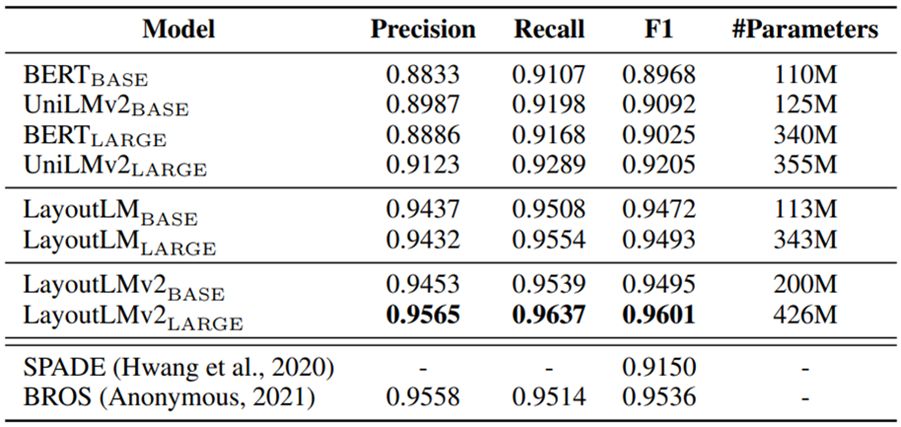
On the document image classification RVL-CDIP dataset, the prediction accuracy of the LayoutLM 2.0 model has increased by 1.2 percentage points compared with the previous best result, reaching 95.64%. 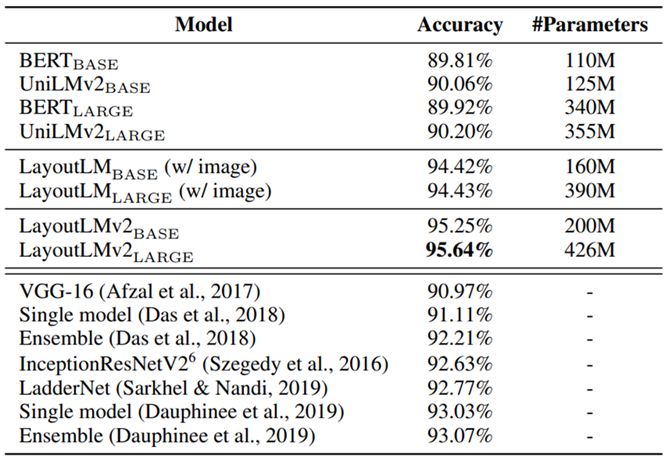
For the understanding of long documents with complex layouts, the Kleister-NDA dataset is used for performance evaluation. The data set contains 254 contract document data, the page layout is complex and the content is long. The results show that the performance of the LayoutLM2.0 model has been further improved compared with 1.0. The results are shown in the following table: 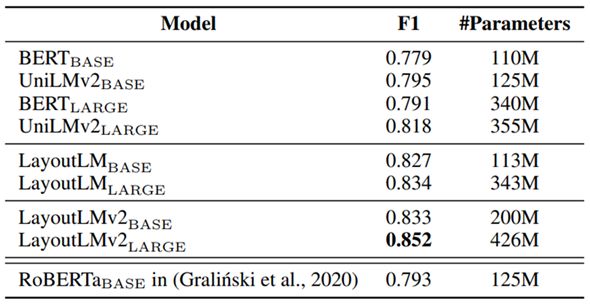
The document vision question answering task requires the model to take a document image and a question as input and output an answer. The researchers verified the effect using the DocVQA dataset, which contains a total of 50,000 question-answer pairs on more than 10,000 pages of documents. LayoutLM 2.0 performance has improved significantly compared to LayoutLM 1.0 and plain text models. Even the performance exceeded the original top method by 1.6 percentage points, reaching 86.72%. 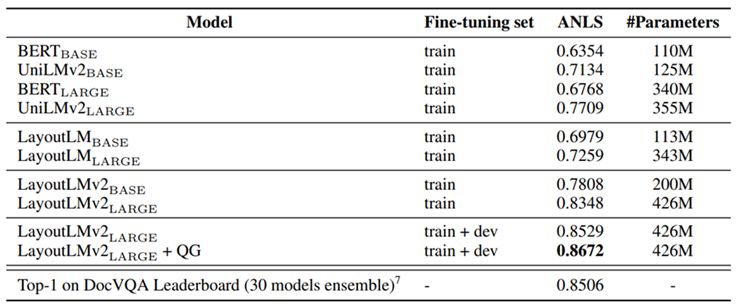
LayoutLMv3
In 2022, Microsoft launched LayoutLM v3. Compared with the previous two versions, the main improvement point is to optimize the image feature representation method and combine text and image embedding in a unified way. Existing document multimodal models either extract CNN grid features, or rely on object detection models like Faster R-CNN to extract regional features for image embedding, which will make the model more computationally expensive, or need to rely on The data labeled by the region. Inspired by ViT and ViLT, LayoutLM v3 represents document images with linear projected features of image patches, and then feeds them into a multimodal Transformer. Specifically, the document image is resized to W⨉H , then the image is segmented into fixed-size (P⨉P) blocks, the image blocks are linearly projected to the corresponding dimensions, and they are flattened to length (M =HW/P 2 ) , plus a learnable one-dimensional position vector to get the image vector. In terms of specific implementation, the image is processed by two-dimensional convolution, and the convolution kernel size is P, and the step size is also P to realize the image block and linear mapping, and then the linear embedding is aligned with the text mark. In this way, the computational complexity is lower, and the model structure is shown in the following figure: 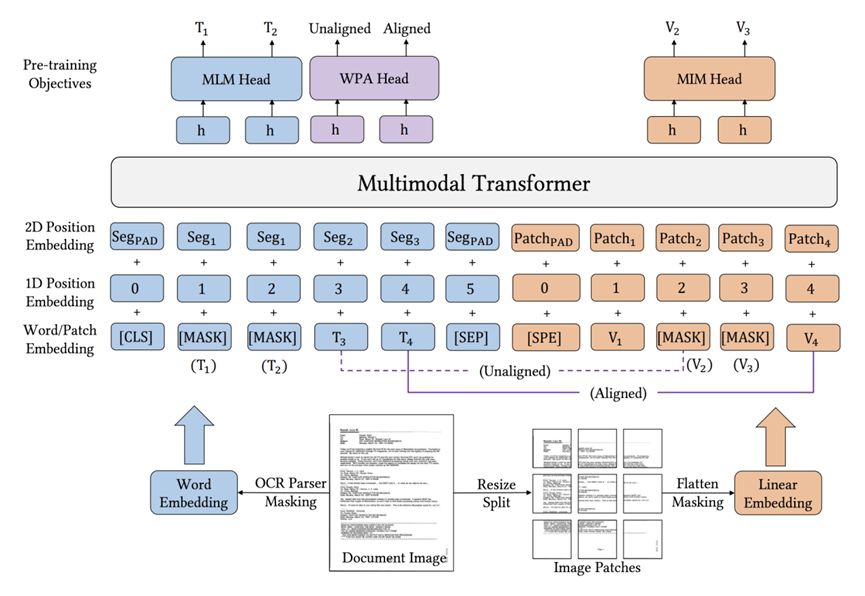 Figure 4 LayoutLM 3.0 model structure
In the pre-training task, in order to achieve better alignment between text and image modalities, Word-Patch Alignment (WPA) is proposed, and the unsupervised pre-training task mask language model is also used for text and image respectively. Masked Language Modeling (MLM) and Masked Image Modeling (MIM).
01 Text-image block alignment
In v3, all images are directly mapped to image features based on image blocks, and the smallest unit of mask becomes an image block. Since MIM and MLM randomly cover some text words and image blocks, the model cannot explicitly learn the fine-grained alignment relationship between such text words and image blocks. Therefore, the text-image block alignment task predicts whether the image block corresponding to the masked text is covered. Specifically, for those tokens that are not masked and the image token corresponding to the token is not covered, then an aligned label will be given, and if his image token is covered, an unaligned label will be marked. And those masked texts do not participate in the calculation of the loss function. Loss function: 
Where LL’ represents the number of unmasked text tokens, and is the alignment label on those unmasked text tokens.
02 mask language model
In the MLM pre-training task, similar to Bert, 30% of the text token is masked, but the corresponding two-dimensional position (layout information) is retained, and the masking strategy is not a single-word random mask, but a coniferous distribution () sampling The length of the span to mask. By keeping the layout information unchanged, this objective helps the model learn the correspondence between layout information and text and image contexts. The goal of the training target model of MLM is to restore the covered words in the text according to the unmasked graphics and layout information. Loss function: 
Where yl represents the masked tokens, M’, L’, XM’, and YL’ respectively represent the masked position of the image sequence, the masked position of the text sequence, and the image and text context of the masked tokens.
03 mask image model
In the MIM pre-training task, the MIM pre-training task in BEiT is used. First, the picture is converted into two features: one is similar to the text Tokenizer, and the image is converted into a discrete visual symbol (visual token) through coding learning; the other is , cut the image into multiple small patches (patch), each patch is equivalent to a character. And use the block-by-block masking strategy to randomly block about 40% of the image tokens, and predict what the actual image tokens that are masked will look like. The training goal of MIM is to reconstruct the masked image token. Therefore, MIM helps to learn high-level layout structures rather than noisy low-level details. Loss function: 
Where Xm represents the masked image token.
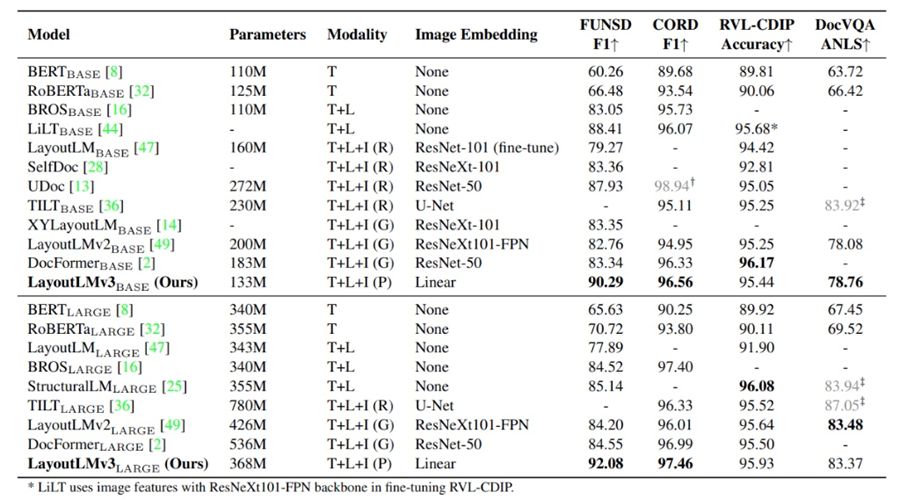
The researchers tested the effect of LayoutLMv3 on four multimodal tasks, including testing the performance of form understanding tasks based on the FUNSD dataset, testing the performance of bill understanding tasks based on the CORD dataset, and testing the effectiveness of document image classification tasks based on the RVL-CDIP dataset. , Based on the DocVQA dataset to test the effect of the document visual question answering task, the overall test results are shown in the table below. On these tasks, LayoutLMv3 achieves better or comparable results than previous work. For example, for the LARGE model size, LayoutLMv3 achieves an F1 score of 92.08 on the FUNSD dataset, which greatly exceeds the previous SOTA result (85.14) for the LARGE scale.
Summarize
After iterating from version 1.0 to version 3.0, LayoutLM has continuously optimized the pre-training performance of the model for text, layout and visual information in documents. The processing effect and efficiency of complex layout documents are gradually improving, not only in various multi-modal tasks. SOTA has been achieved on EPHOIE, and SOTA has also been achieved on the Chinese dataset EPHOIE, which proves the feasibility of multimodal technology for document understanding and its huge potential in the future.
At present, Daguan conducts independent research and development based on multi-modal document understanding technology, and has achieved excellent results in processing complex international documents and complex format document scene data, such as contracts, invoices, research reports, forms, etc., and has achieved excellent results in banks, securities, Many different industries such as customs declaration and manufacturing have achieved successful implementation, bringing huge benefits to various industries.
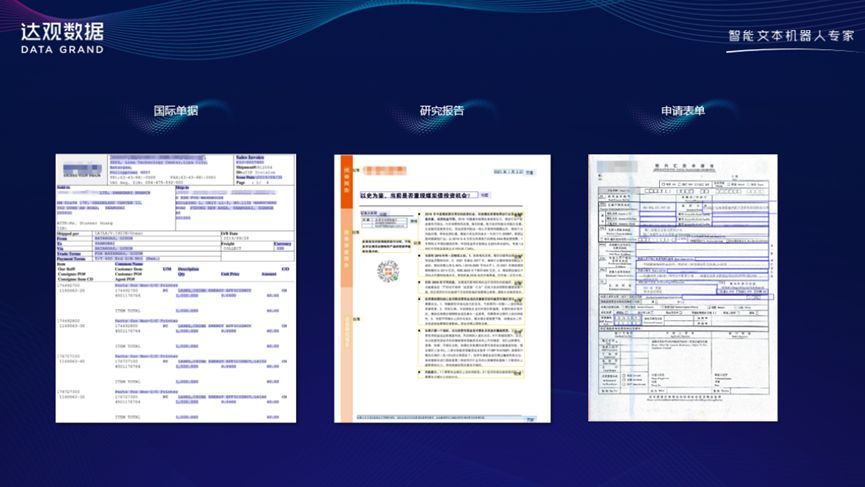
Figure 5 Documents with different formats and contents in different industries
The quality of the sample data in the real scene is much worse than the document quality of the public dataset used in the paper, and the image quality problems that the algorithm needs to deal with will be more complicated, including sample tilt, perspective transformation, sample blur, shadow problems, watermark scratches, etc. Traces, handwriting, etc., it is difficult to solve the above problems with the general OCR algorithm, which will lead to a large deviation in the text and coordinates passed to the multimodal algorithm input, and the final algorithm output will have a more obvious effect degradation. Therefore, when applying the multimodal algorithm, Daguan uses the self-developed OCR algorithm to automatically realize high-precision tilt correction, perspective transformation correction, sample enhancement, shadow removal and watermark removal, etc., and restore the real sample to high-quality pure samples to minimize negative effects.
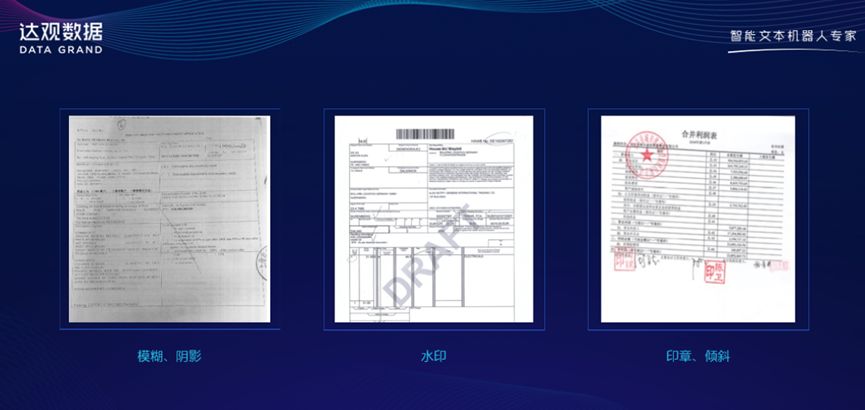 Figure 6. There are blurring, shadows, watermarks, stamps and other problems in real samples
After the OCR general processing, Daguan has done a lot of self-research and improvement based on the principle of multi-modal algorithm, mainly to solve the situation that the layout of real samples in various scenarios in various industries changes a lot, and the key points to be identified In the case of large differences in elements, the focus is on strengthening the algorithm’s perception and analysis of document layout information, especially for the spatial relationship and semantic relationship between different layout modules, the introduction of the CRF model for targeted modeling, and the effect is improved after improvement nearly a 10% increase. In addition, in the practice of some scenarios, when we did comparative experiments, we found that the effect of LayoutLM v3 is not as stable as that of v2. In some scenarios, the effect is not as good as that of v2, but the computational efficiency of v3 is significantly improved, which is more suitable for the actual online operation. performance requirements. At this stage, we are also trying to adjust and optimize the model to achieve a higher level of balance between the extraction effect and computing efficiency. There are still many problems worthy of research and tackling in the actual implementation process, and further attempts based on zero samples and few samples in the future are also very worth looking forward to.
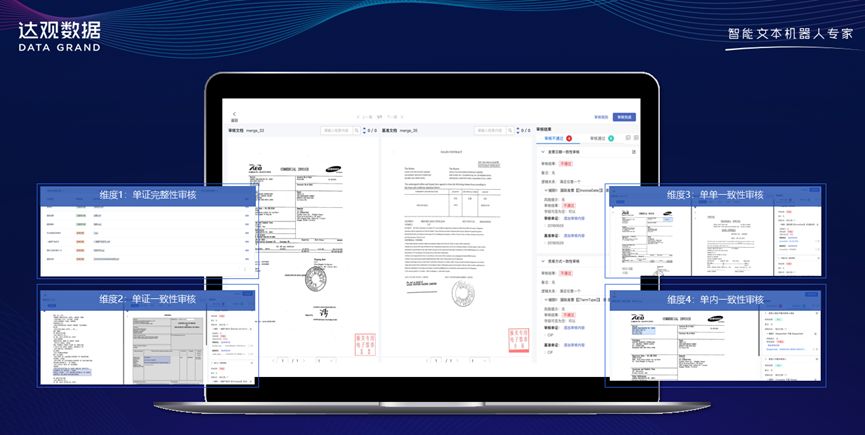 Figure 7 Daguan’s self-developed multi-modal model solves the problem of international bill review
About the Author
Ji Chuanjun, co-founder of Daguan Data, master and outstanding graduate of Fudan University, winner of the title of Shanghai Artificial Intelligence Senior Engineer, member of China Computer Federation (CCF). The person in charge of intelligent robots in the banking industry of Daguan Data, responsible for major project architecture design and product development management. The winner of the Shanghai Youth Science and Technology Venus Star, was selected into the 36 Krypton “X·36Under36” S-level youth entrepreneur list because of its outstanding achievements in the application of artificial intelligence technology to empower industries.
Former director of AI system of Shanda Innovation Institute, former director of Shanda Literature Data Center, responsible for the personalized recommendation system of Qidian Chinese website and Kuliu Video and user relationship mining of Youyou APP during Shanda Innovation Institute, and fully responsible for big data mining during Shanda Literature Task scheduling system, intelligent review system and anti-cheating system.
This article is reproduced from: https://www.52nlp.cn/%E5%A4%9A%E6%A8%A1%E6%80%81%E6%96%87%E6%A1%A3layoutlm%E7%89%88% E9%9D%A2%E6%99%BA%E8%83%BD%E7%90%86%E8%A7%A3%E6%8A%80%E6%9C%AF%E6%BC%94%E8% BF%9B-%E7%BA%AA%E4%BC%A0%E4%BF%8A
This site is only for collection, and the copyright belongs to the original author.