This article introduces the asset allocation strategy based on Sharpe ratio optimization, and the backtest results of the strategy in A-share stock funds. Sharpe ratio optimization is a classic asset allocation model for quantitative base selection. Quantitative base selection can objectively and accurately use historical data, reduce manual subjective judgments, and improve investment efficiency.
Sharpe ratio optimization strategy
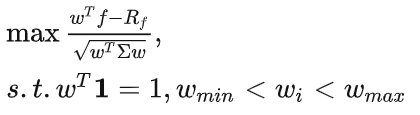
Based on historical performance, build a fund portfolio with the largest Sharpe ratio. The Sharpe Ratio is an indicator to measure the risk-adjusted rate of return. The higher the Sharpe Ratio, the higher the excess return generated for each unit of total risk that the investment portfolio bears. Sharpe ratio calculation formula = (portfolio expected rate of return – risk-free interest rate) / portfolio standard deviation. Constructing the Sharp maximization combination is equivalent to finding the optimal solution to the following mathematical optimization problem:
Fund Investment Strategy
Take all 867 stock funds as samples. Obtain the daily net value of the fund in the last 40 trading days on the position adjustment day, use the Sharpe optimization strategy to select funds and assign weights, and set the upper limit of a single fund position to 20% or 100%. On the next trading day, use all funds to buy funds according to the allocated weight. Sell them all after holding for 3 or 6 months. The strategy is long-term full position. The subscription fee rate is 1/1000, and the redemption fee rate is 5/1000. The performance benchmark is CSI 300.
As mentioned in the previous article , Sharp’s optimal strategy can achieve an annualized return of 35% and a relatively low retracement. This article will continue to explore the impact of parameters such as the rebalancing cycle and the upper limit of a single fund’s position on Sharp’s optimal strategy .
Rebalancing cycle : We use a 6-month rebalancing cycle by default, which is mainly due to the lower selling and redemption rate of stock funds after being held for 6 months, generally 0.5%. We further tested the strategy performance of the 3-month rebalancing cycle.
Single fund position limit : We use a default position limit of 100%, which means that only a single fund is allowed. We further tested the strategy performance when the position limit of a single fund is 20%, in order to diversify the risk as much as possible.
Figure 1: Sharpe optimization strategy backtest net worth trend
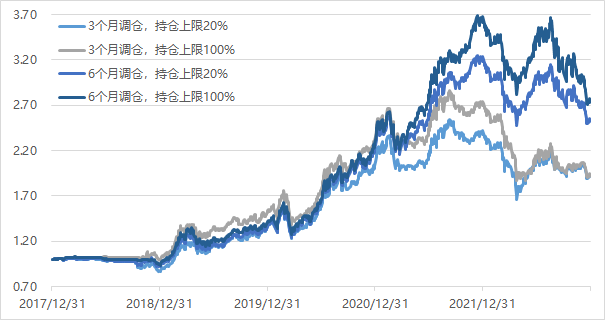
Figure 2: Backtest performance of Sharp’s optimization strategy
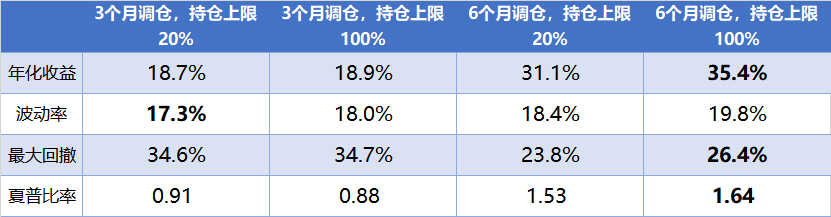
From Figure 2, from the perspective of profitability, 6-month position adjustment and 100% position upper limit is the best parameter combination , which can achieve 35% annualized return, 26% maximum drawdown, and a Sharpe ratio of 1.64.
The return of the 6-month rebalancing strategy is significantly higher than that of the 3-month rebalancing strategy . The annualized return of the parameter combination of 3-month rebalancing and 100% position upper limit is only 18.9%, which is only a 6-month rebalancing strategy. half of the annualized income. This shows that more frequent position adjustments are not conducive to increasing the fund’s income, but will reduce the income.
The 20% position limit can reduce the maximum drawdown and volatility , but at the cost of a small decrease in annualized returns. The upper limit of position plays a role in diversifying risks. The maximum retracement of the parameter combination of 6-month adjustment and 20% position upper limit is 24%, and the volatility is 18%. Both risk indicators are lower than 6-month adjustment and position upper limit. 100% parameter combination (maximum drawdown 26%, volatility 19%).
When investors determine the parameters of Sharpe’s optimal strategy, they need to find a balance between increasing returns and controlling drawdowns. For example, the parameter combination of 6-month position adjustment and 100% position upper limit can achieve 35% annualized return, but the maximum drawdown is relatively high, which is 26%.
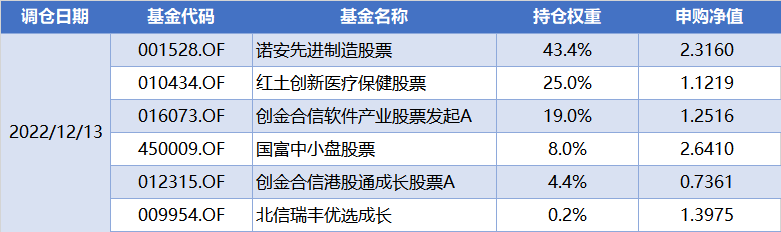
Figure 3 lists the fund portfolio for the latest adjustment of Sharp’s optimization strategy for reference.
Figure 3: The Fund Portfolio with the latest rebalancing
$ Nuoan advanced manufacturing stock (F001528) $ $ Chuangjin Hexin software industry stock launch A (F016073) $ $ Guofu small and medium cap stock (F450009) $ #红火火火! The A-share Year of the Tiger is coming to an end, how is your income? # #2022 Fund Four Seasons News Interpretation# #Northbound funds have bought more than 100 billion net this month! #
There are 10 discussions on this topic in Xueqiu, click to view.
Snowball is an investor social network where smart investors are all here.
Click to download Xueqiu mobile client http://xueqiu.com/xz ]]>
This article is transferred from: http://xueqiu.com/9450201277/240476527
This site is only for collection, and the copyright belongs to the original author.