There are many ways to break out the head and bottom of the market.
When I was young, I judged the top and bottom of the market mainly by the number of stockholders coming and going in the securities business department. If there were only a few dozen people in the business hall and they were still playing poker, then the market was basically at the bottom. If the crowd in the business hall is boiling, it is easy to bump into people while walking, and it is difficult to find a seat in the hall, then it is likely to be in the head of the market.
In addition, when I was young, there was another way to judge the head and the bottom. That is to look at the market chart of “Information Morning Post”. These newspapers have charts for hundreds of stocks. When the trend of most stocks shows a downward angle of 30 degrees, and it has lasted for more than half a year, this time is generally the bottom. When the prices of almost all stocks show a continuous upward trend of 30 degrees or even 45 degrees, and the upward time lasts for more than half a year, it is basically in a bull market, and it may not be far from the head.
There is also a more intuitive method, which is to go to the business office of a securities company to see the number of people who come to open an account. When only two or three people go to the securities company to open an account every day, it can basically be concluded that the current market is not good, and it is basically the bottom area of the market. When there are so many people who open an account every day that they have to queue up even when opening an account online, it is often not far from the head of the market.
I also have an exclusive method of judging the market – that is, whenever my brother-in-law asks about the stock market and has an idea of entering the market and speculating in stocks, the market will always be at the head.
Why is this so? Because they never pay attention to the stock market, these people who have never traded in stocks know that the stock market is hot. It can be seen that the profit-making effect of the stock market is strong at this time, and the news of making money in the stock market has spread all over the streets. This is of course a sign that the stock market is too hot.
In the past few days, I saw a very interesting picture of buying the bottom and escaping the top on a financial website. I copied it here for everyone to see:
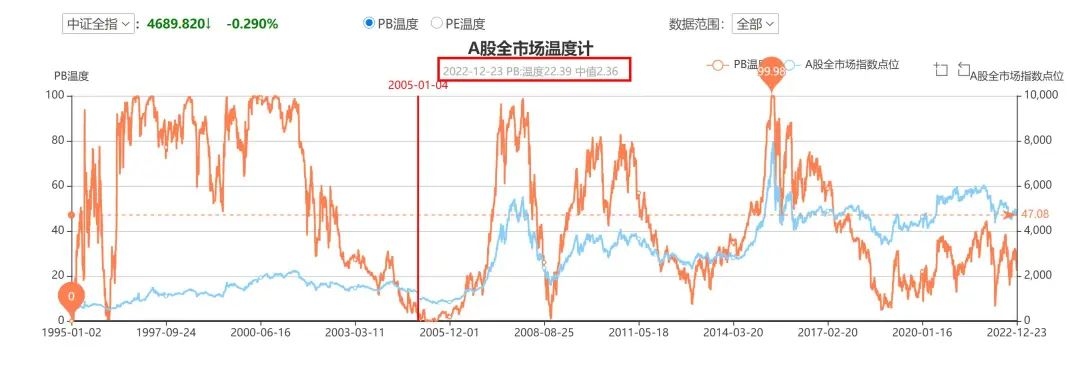
This graph is called the A-share market thermometer. The meaning is that this graph is like a thermometer that can measure the temperature of the market. The author’s suggestion is to buy the whole position when the market is below 20 degrees, and sell the whole position when the market is above 80 degrees.
The principle of this graph is based on the median value of PB or PE of the entire market, and then use a mathematical formula to perform a conversion to obtain the “temperature” of the market at that time. Its principle is simple – the PB or PE of the market will drop sharply in each round of bear market, and the PB or PE of the market will rise sharply in each round of bull market. According to the relative value of PB or PE, it can be estimated with high probability whether the current market is at the bottom or the top.
Does this approach work? According to my 26 years of market observation, this method should be effective. It is true that in every bear market, a large number of stocks will fall below their net assets, and almost all stocks will have lower market value and price-earnings. In the bull market, due to the sharp rise in stock prices, the price-to-book ratio or price-earnings ratio of almost all stocks will rise. In my impression, A shares have always been like this and have never changed.
Even if A-shares have entered the structured market in recent years, this rule still exists. Because, even if only a part of the stock rises, it will greatly increase the price-to-book ratio and price-earnings ratio.
The large changes in the price-to-book ratio and price-earnings ratio of stocks in the bull market and bear market actually illustrate the large fluctuations in market sentiment, that is, people will become crazy when they are extremely optimistic about the future, and they are too optimistic about the company and are willing to buy at a high price. The overall price-to-book ratio and price-to-earnings ratio have risen sharply. In a bear market, people are overly pessimistic and sell a lot, making the market’s overall price-to-book ratio and price-earnings ratio too oversold. In fact, the company’s performance is neither as good as people thought in the bull market, nor as bad as people expected in the bear market. Therefore, the market can fluctuate up and down around a slightly upward-sloping central axis.
Of course, we must pay attention to the specific index and plate composition when using this thermometer, and it cannot be used mechanically. For example, the Shanghai and Shenzhen 300 Index is measured by this thermometer, and it is currently at a high level. In fact, the CSI 300 Index is currently at a mid-to-low level. Why is this so? I think this may be because there are some new energy stocks in the Shanghai and Shenzhen 300 Index. Their sharp rise in the past two years makes the median PB of the Shanghai and Shenzhen 300 Index appear very high. According to this thermometer, the current CSI 300 has reached 56.7 degrees!
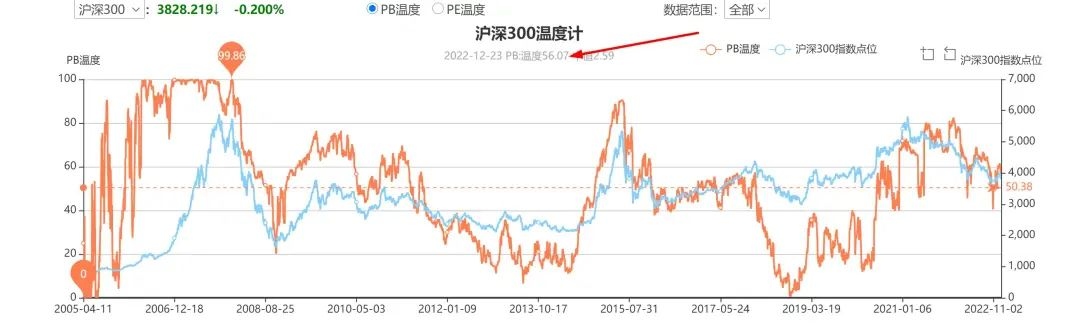
Therefore, when we look at the market thermometer, we should not only look at the chart, but also consider how the values in the chart appear. In the future, these values will most likely go up or down. Only in this way can the thermometer be used well.
I basically agree with this algorithm’s judgment on the head and bottom of the market. It is an effective way to judge the head and bottom by the level of PB and PE.
There are also some ways to judge the top and bottom of the market. I won’t introduce them one by one here. The advantage of this thermometer is that it can make a chart based on the judgment of the market based on the data, which is convenient for people to evaluate the current market.
Note: All methods of judging the top and bottom of the market cannot achieve the highest price for selling and the lowest price for buying. Only luck can do it.
Take the top of the bull market in 2015 as an example, most of the people who escaped from the top ran away after more than 4,000 points. In fact, the market did not officially fall until it rose above 5,000 points. Those who can escape the top at around 5000 points have a certain element of luck. I was lucky at the time, and I only cleared my position when it was close to more than 4,700 points. The market rose sharply the next day after I cleared my position. Some friends who followed me to liquidate their positions saw that the market had risen sharply again, so they killed them back again, and it collapsed on the third day. At that time, I also secretly rejoiced that I was lucky, as long as I was late for liquidation three days later, I would be buried in this stock market disaster.
The normal state of escape from the top is that the market may continue to rise by 10% or even 30% after selling stocks, and the normal state of buying stocks is that the market may continue to fall by 10% or even 30% after buying stocks! Moreover, it is impossible to “fall as soon as you sell, and rise as soon as you buy.” It may be several months or even one or two years after the stock market is sold before the market starts to plummet, and it is several months or even three or four years after the stock is bought that the market does not start to rise sharply.
Even if we see the top and the bottom, it is very difficult to hold on to a short position without buying back for at least a year after selling at the top, and to hold on to a heavy position for one or two years after buying at the bottom. Most people can’t do this.
In fact, it is not difficult to judge the top and bottom of the market, but the difficulty is to control human nature. Even if they can judge the top and the bottom, most people can’t escape the top and buy the bottom well.
When it is judged that the market has a high probability of being at the top, it is difficult for ordinary people to control their greed, have the courage to reduce or even liquidate positions when the market is good, and adhere to the principle of preferring to earn less and be safe. When it is judged that the market is likely to be at the bottom, have the courage to buy or even increase positions when the market is down, can overcome fear and hold it patiently, not afraid of being trapped, not afraid of becoming a lone brave, this is something that most ordinary people cannot do .
More people can’t judge the head and bottom of the market. They are often brainwashed by market conditions and the external environment of the market without knowing it. Coupled with the greed and fear in people’s nature, they do not want to leave the market when the market is at the top, and refuse to enter the market when the market is at the bottom. These people are often the most steadfast top holders and bottom bearers, much more determined than those of us who often escape from the top and buy bottoms in the market.
Finally, I would like to point out that even professional investors or investment experts are easily brainwashed by the market environment without realizing it, and it is difficult to maintain rationality all the time. I once bought a stock of a brokerage firm at the top of the market. After a few days of buying, my rationality returned. I judged that I bought at the top of the market. I regretted and was very nervous. After holding it for more than a week, I took advantage of a round of rebound and sold the stock. Fortunately, not only did he not lose money, but he also made a profit of 8,000 yuan. In fact, I did not sell at the highest level when I escaped from the top this time. Although the brokerage stocks fell by about 20% shortly after I sold, the brokerage stocks hit new highs again three months later, which was a technical fake. Breakthrough, and then began to officially start the plummeting mode, and it has been falling by more than 60% before successfully establishing a bottom.
The key to successfully buying bottoms and escaping from the top is to keep in mind one sentence—you can’t get stuck if you are not afraid of going empty, and you can copy to the bottom of the market if you are not afraid of getting stuck.
There are 2 discussions on this topic in Xueqiu, click to view.
Snowball is an investor social network where smart investors are all here.
Click to download Xueqiu mobile client http://xueqiu.com/xz ]]>
This article is transferred from: http://xueqiu.com/5223831183/238582102
This site is only for collection, and the copyright belongs to the original author.