Original link: https://muyexi.im/guan-jian-jie-wei-de-guan-jian-bo-dong/
By observing the fluctuations of key price levels, we can judge the direction of least resistance for price movement, and recently found several good examples in the commodity market.
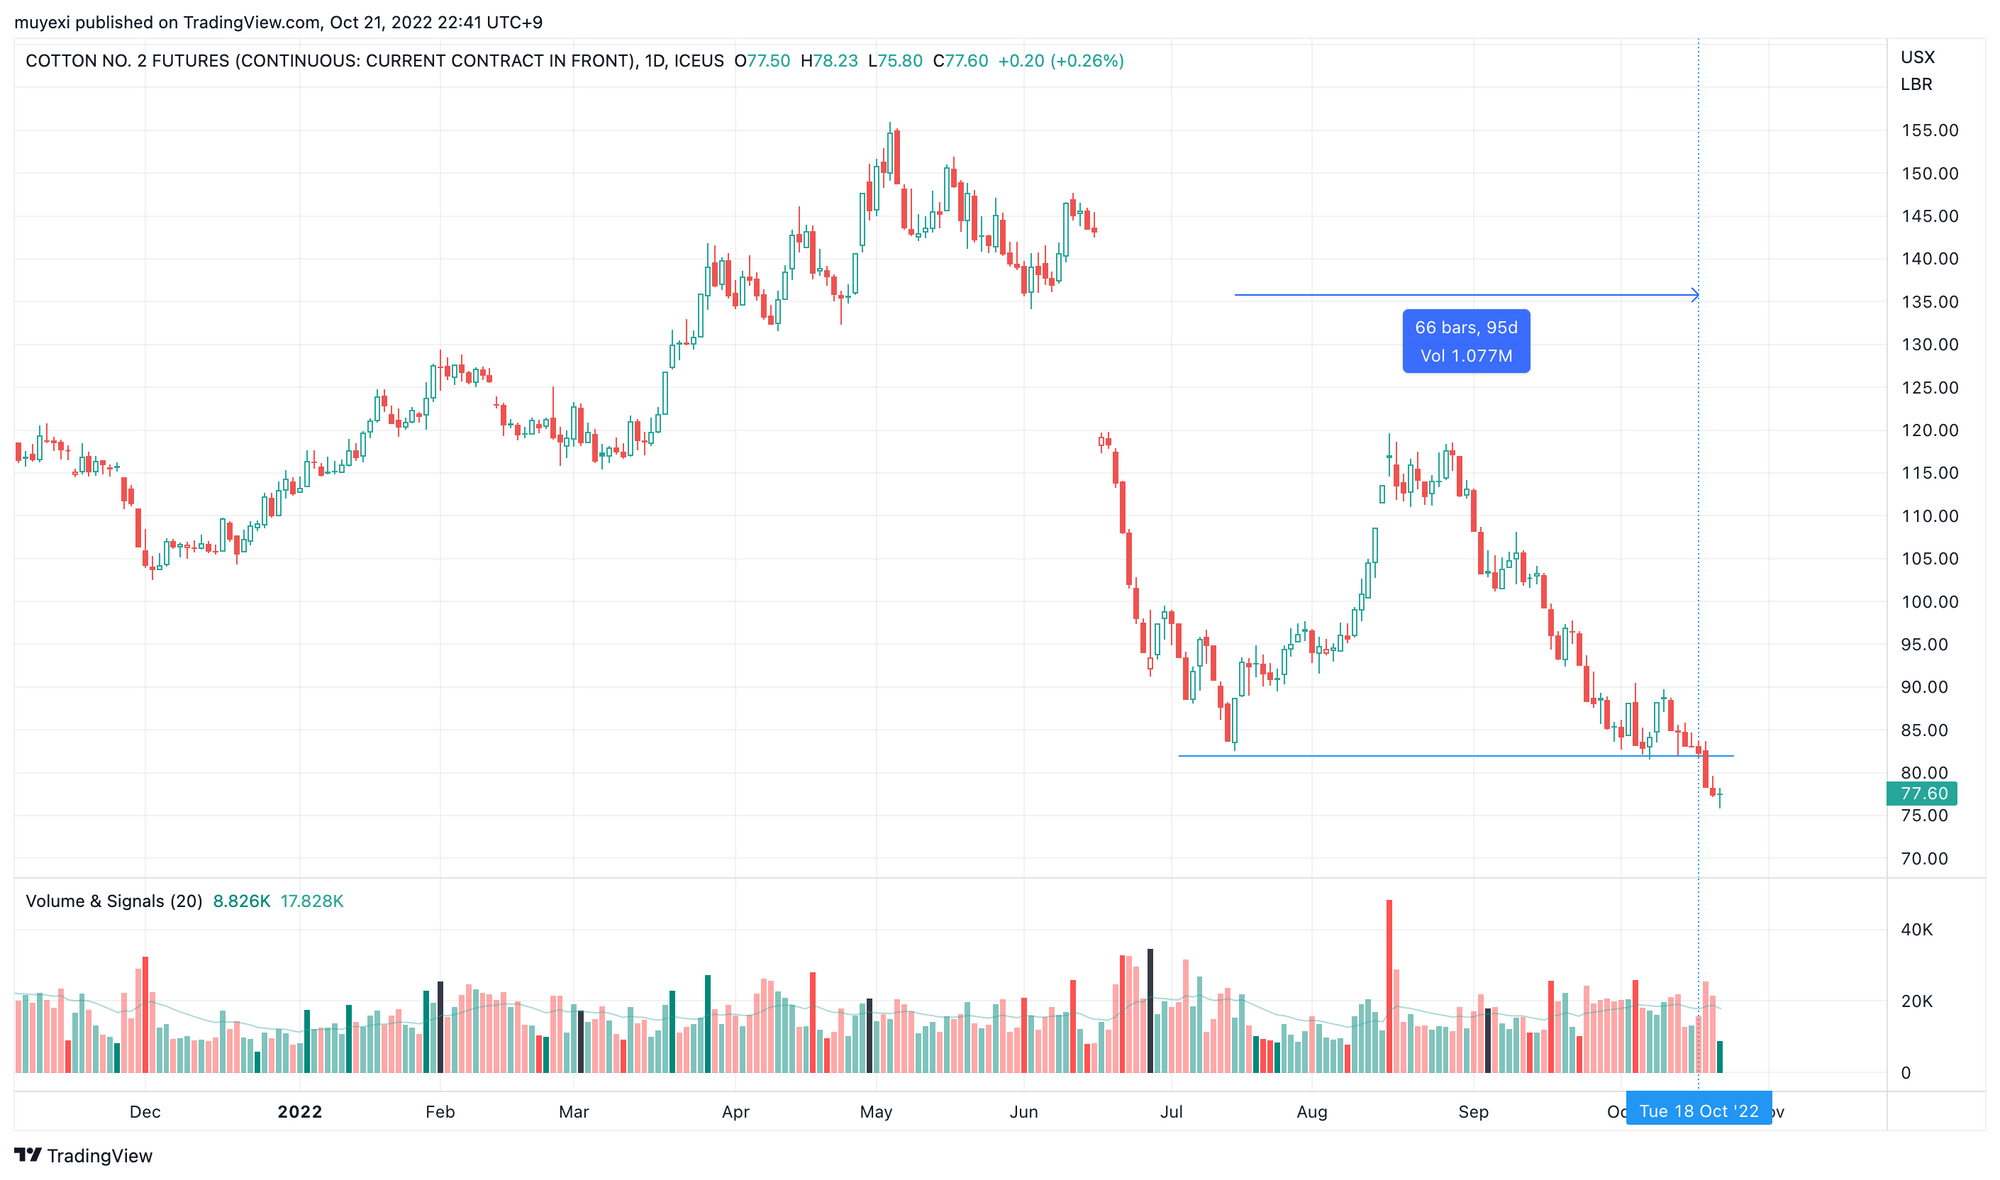
American cotton
Looking at the daily line first, prices fell to the lows of 3 months ago.
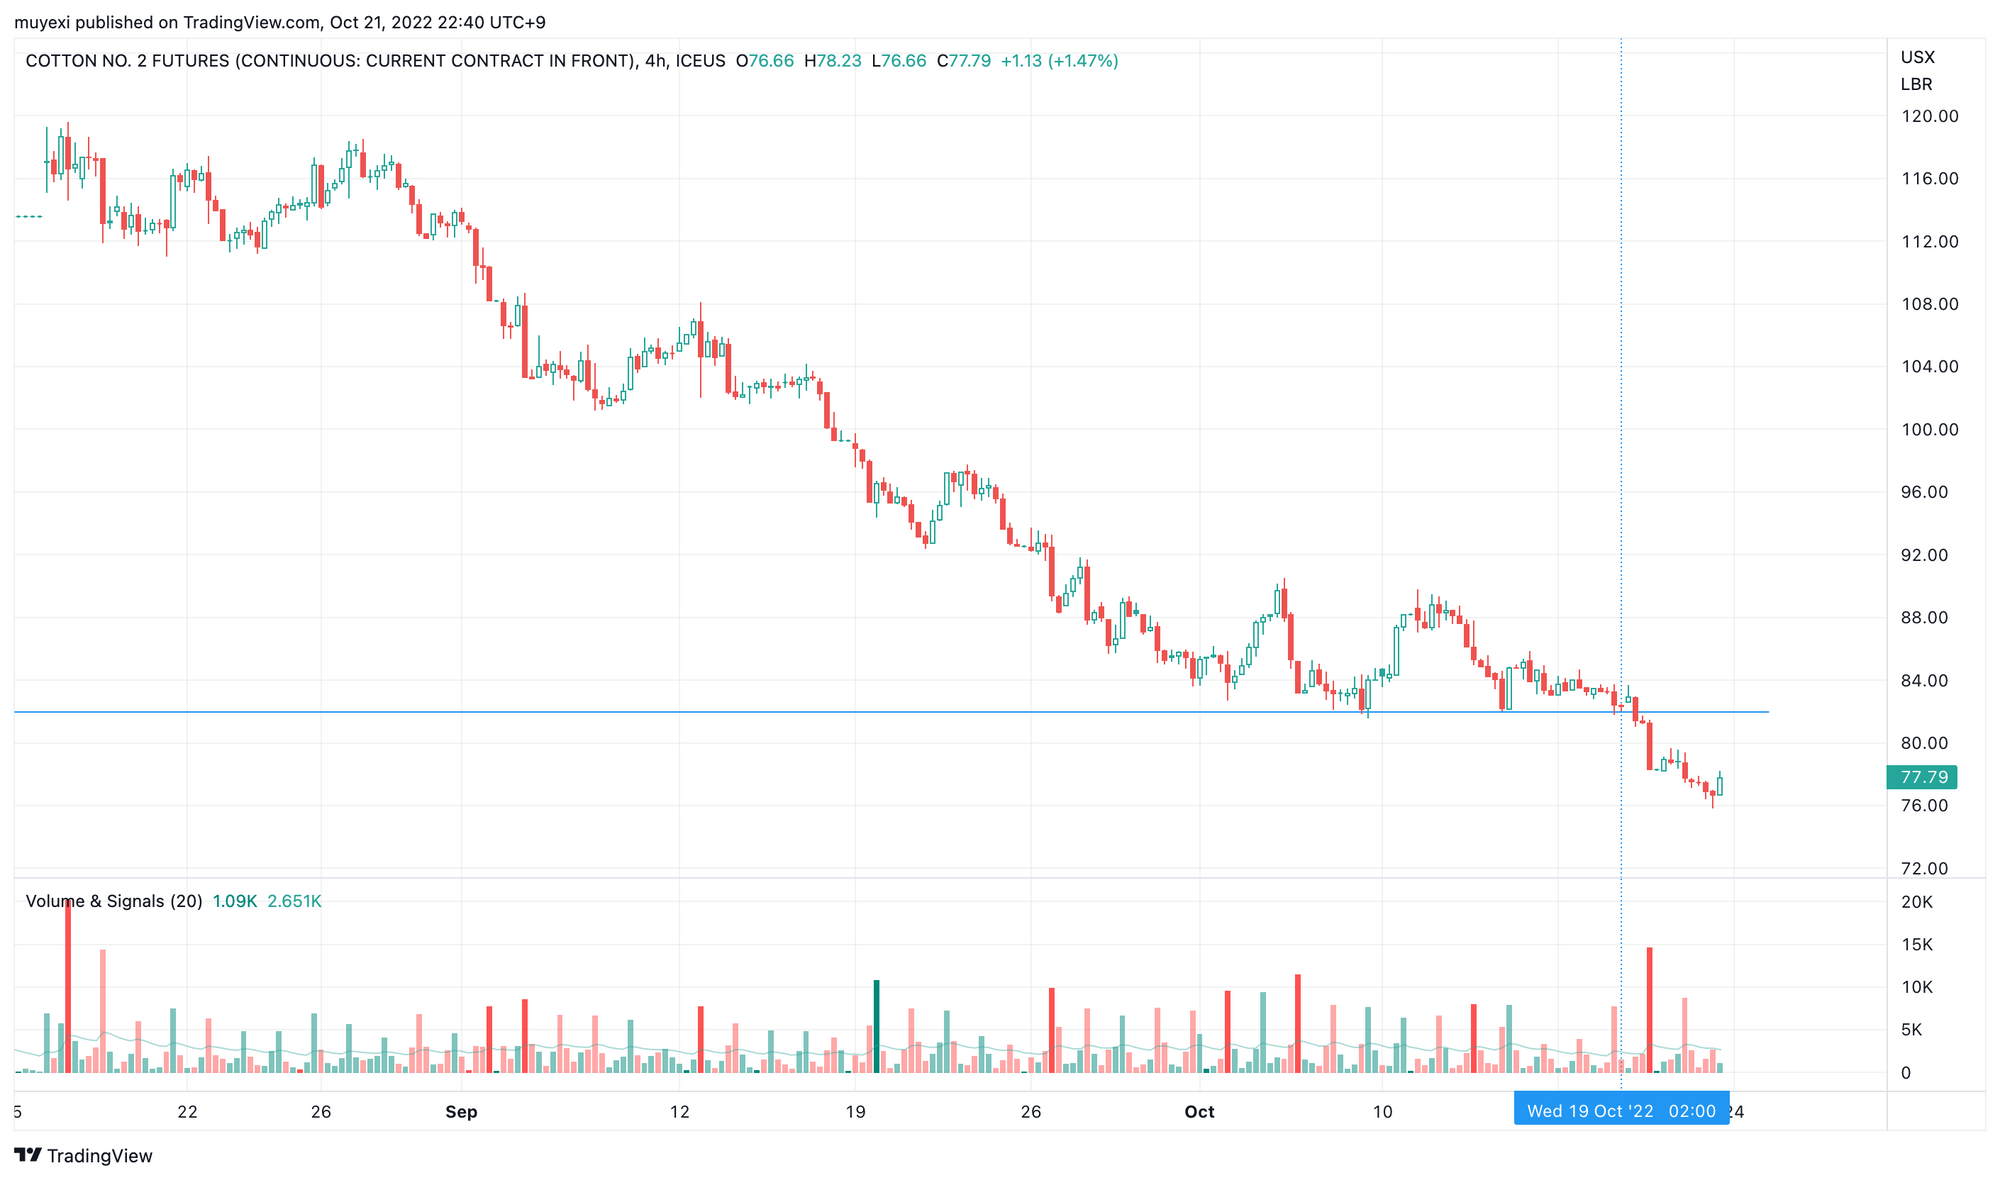
Looking at the 4-hour line again, the price is adsorbed on the lower boundary after two rebounds. The bounce does not bounce, indicating the weakness of the price.
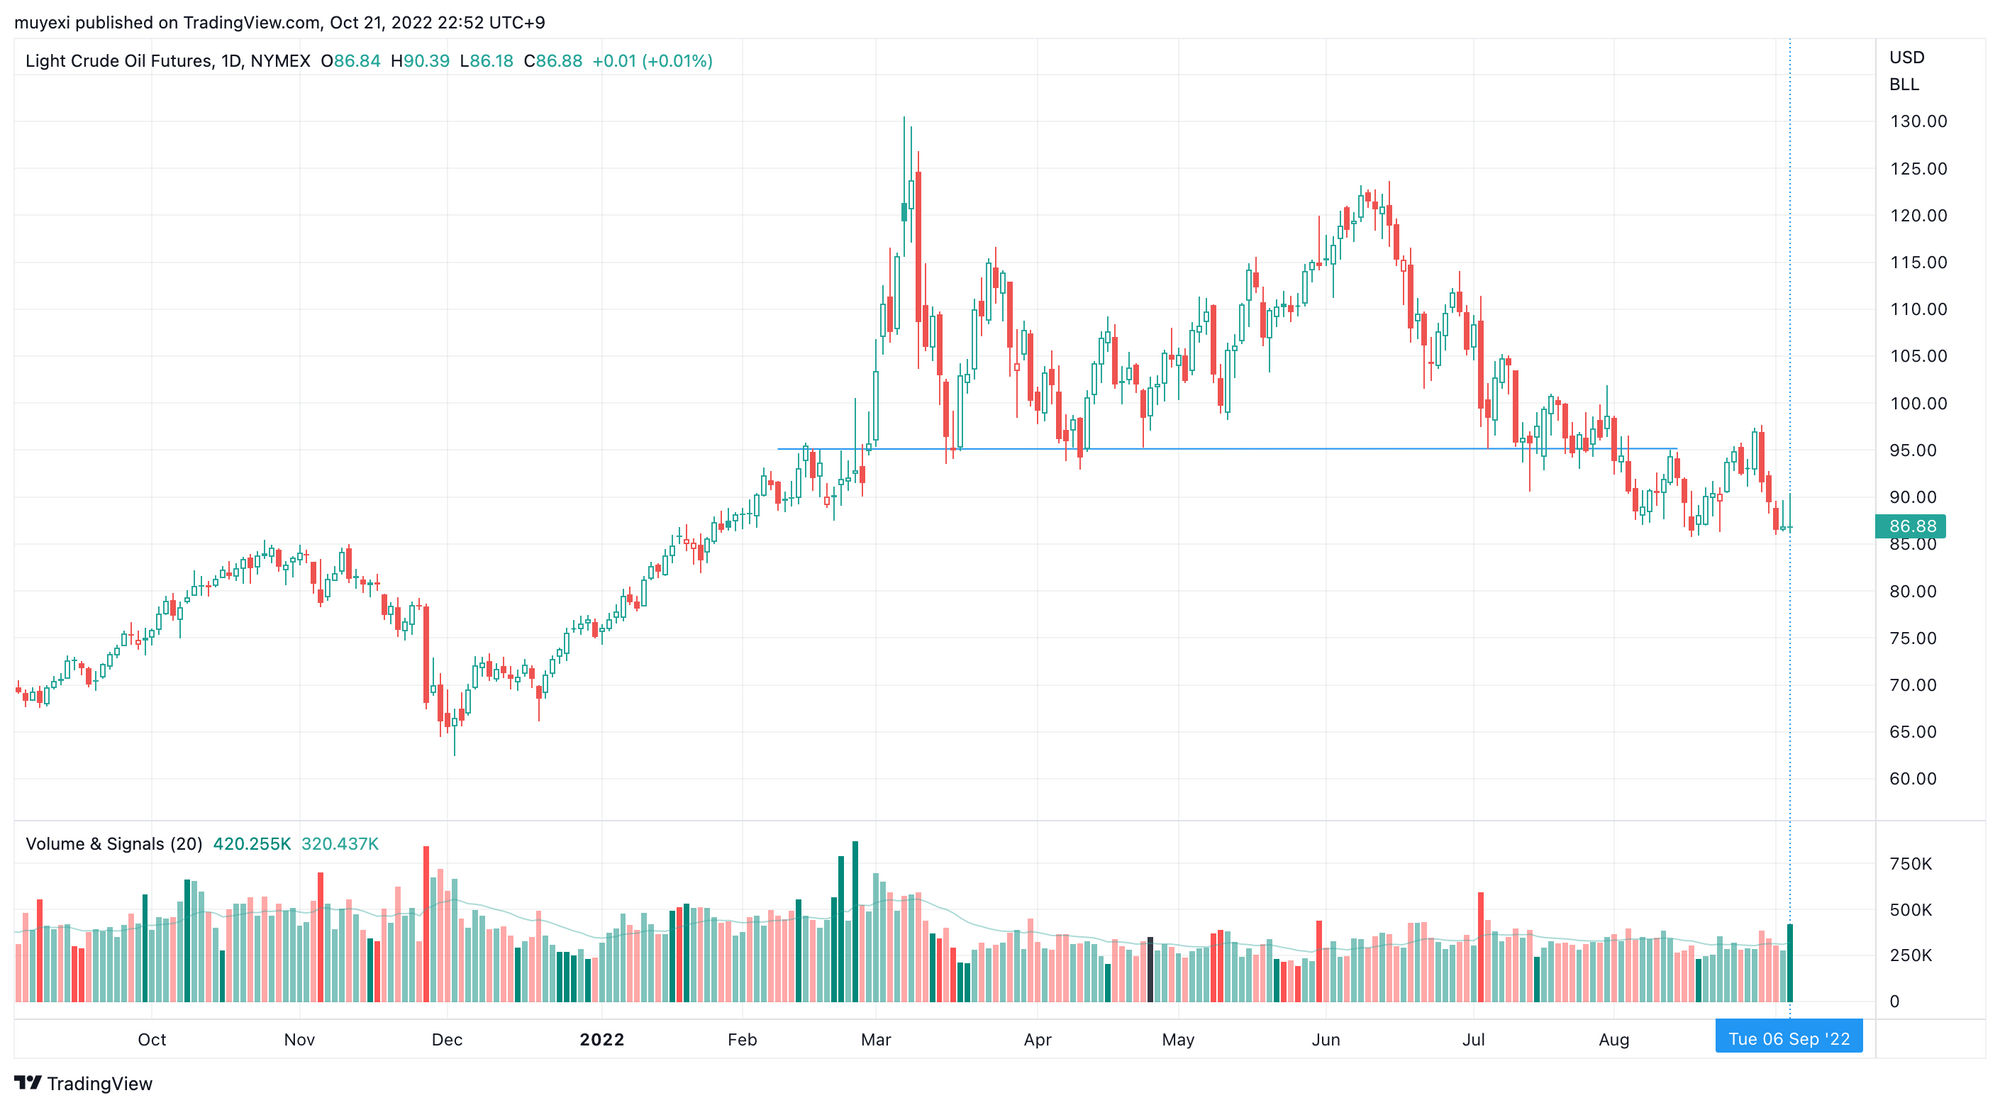
crude
Looking at the daily line first, the price has closed 2 long upper shadow lines at a low level before, which can clearly see the weakness of the price.
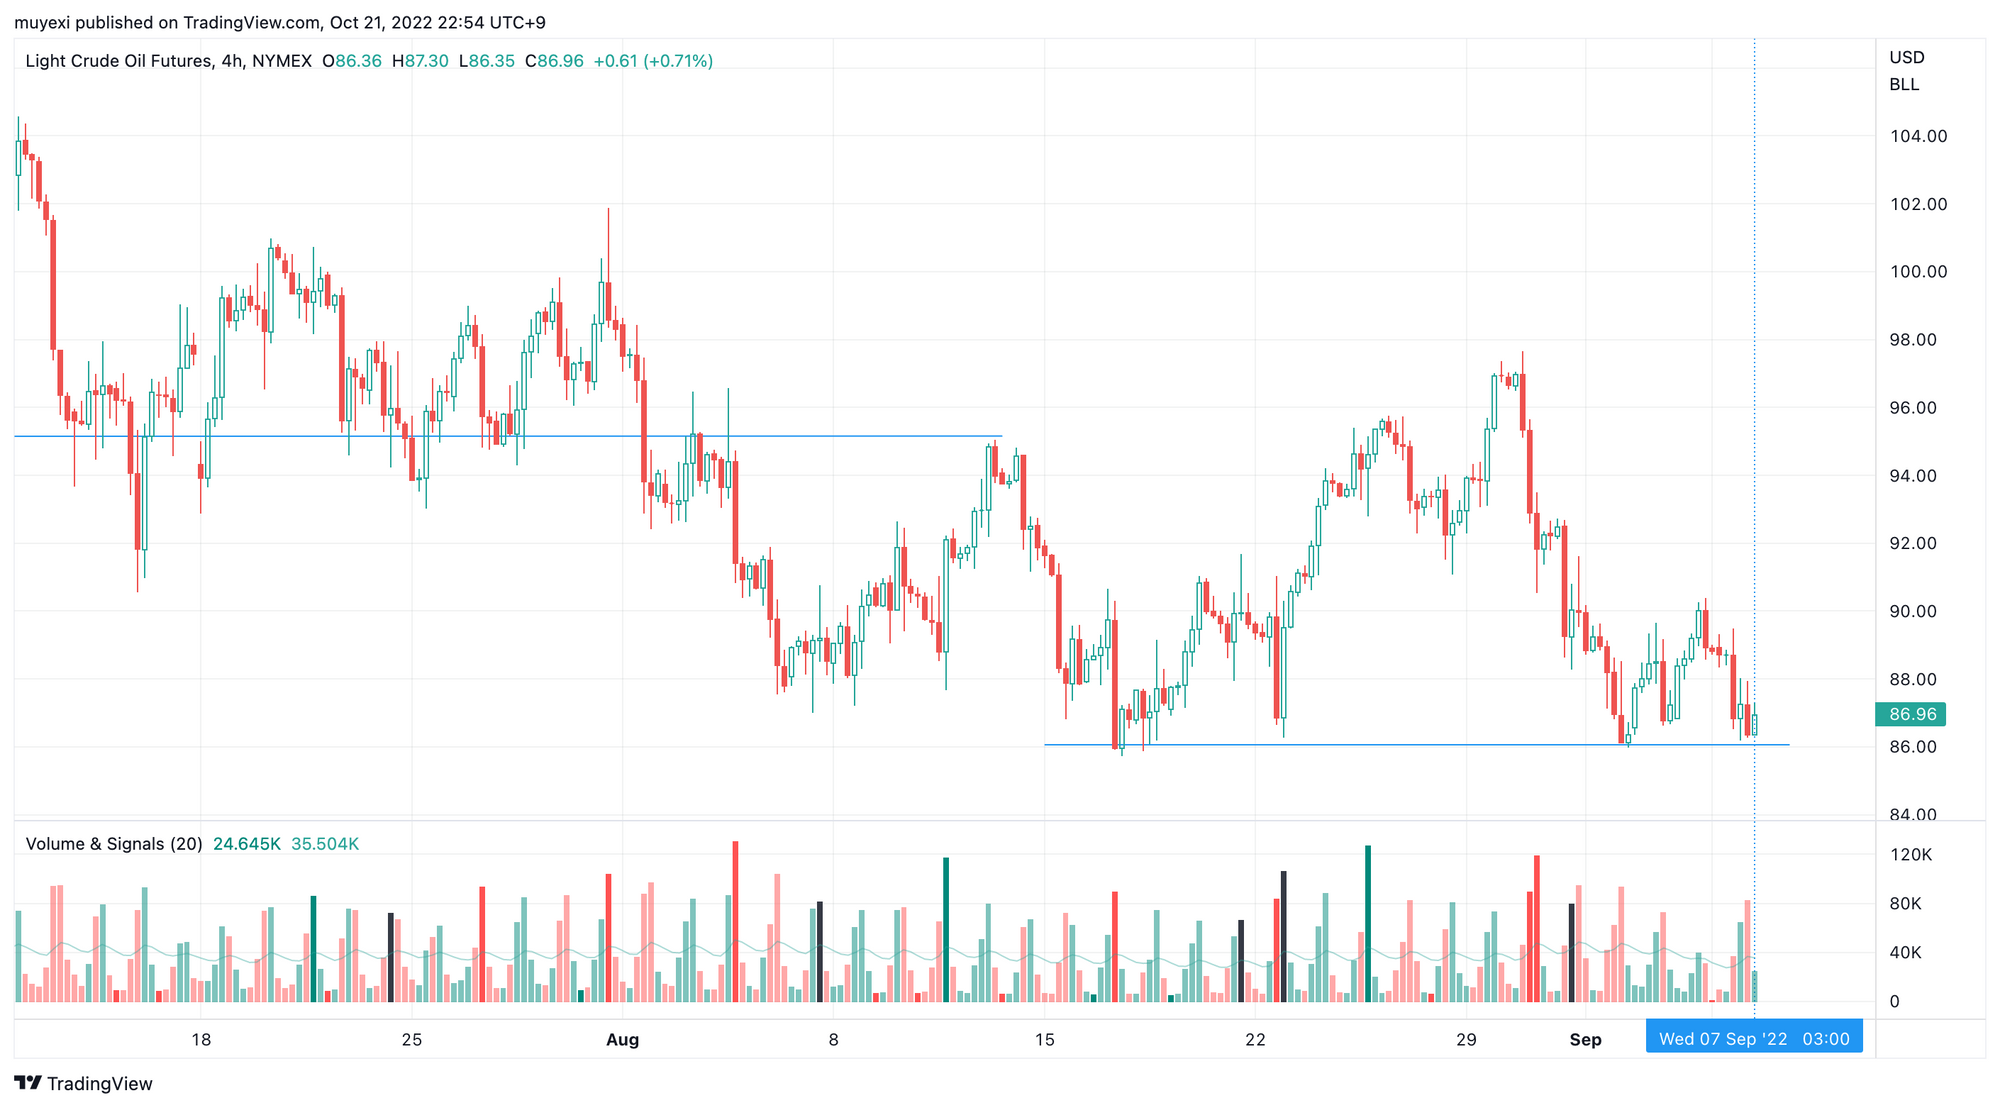
Looking at the 4-hour line again, it is not as obvious as the daily line, but if you look closely, you can see that the price center of gravity has moved down and gathered at the support level.
soybean meal
The last review article has a detailed analysis, and the 4-hour chart is as follows:
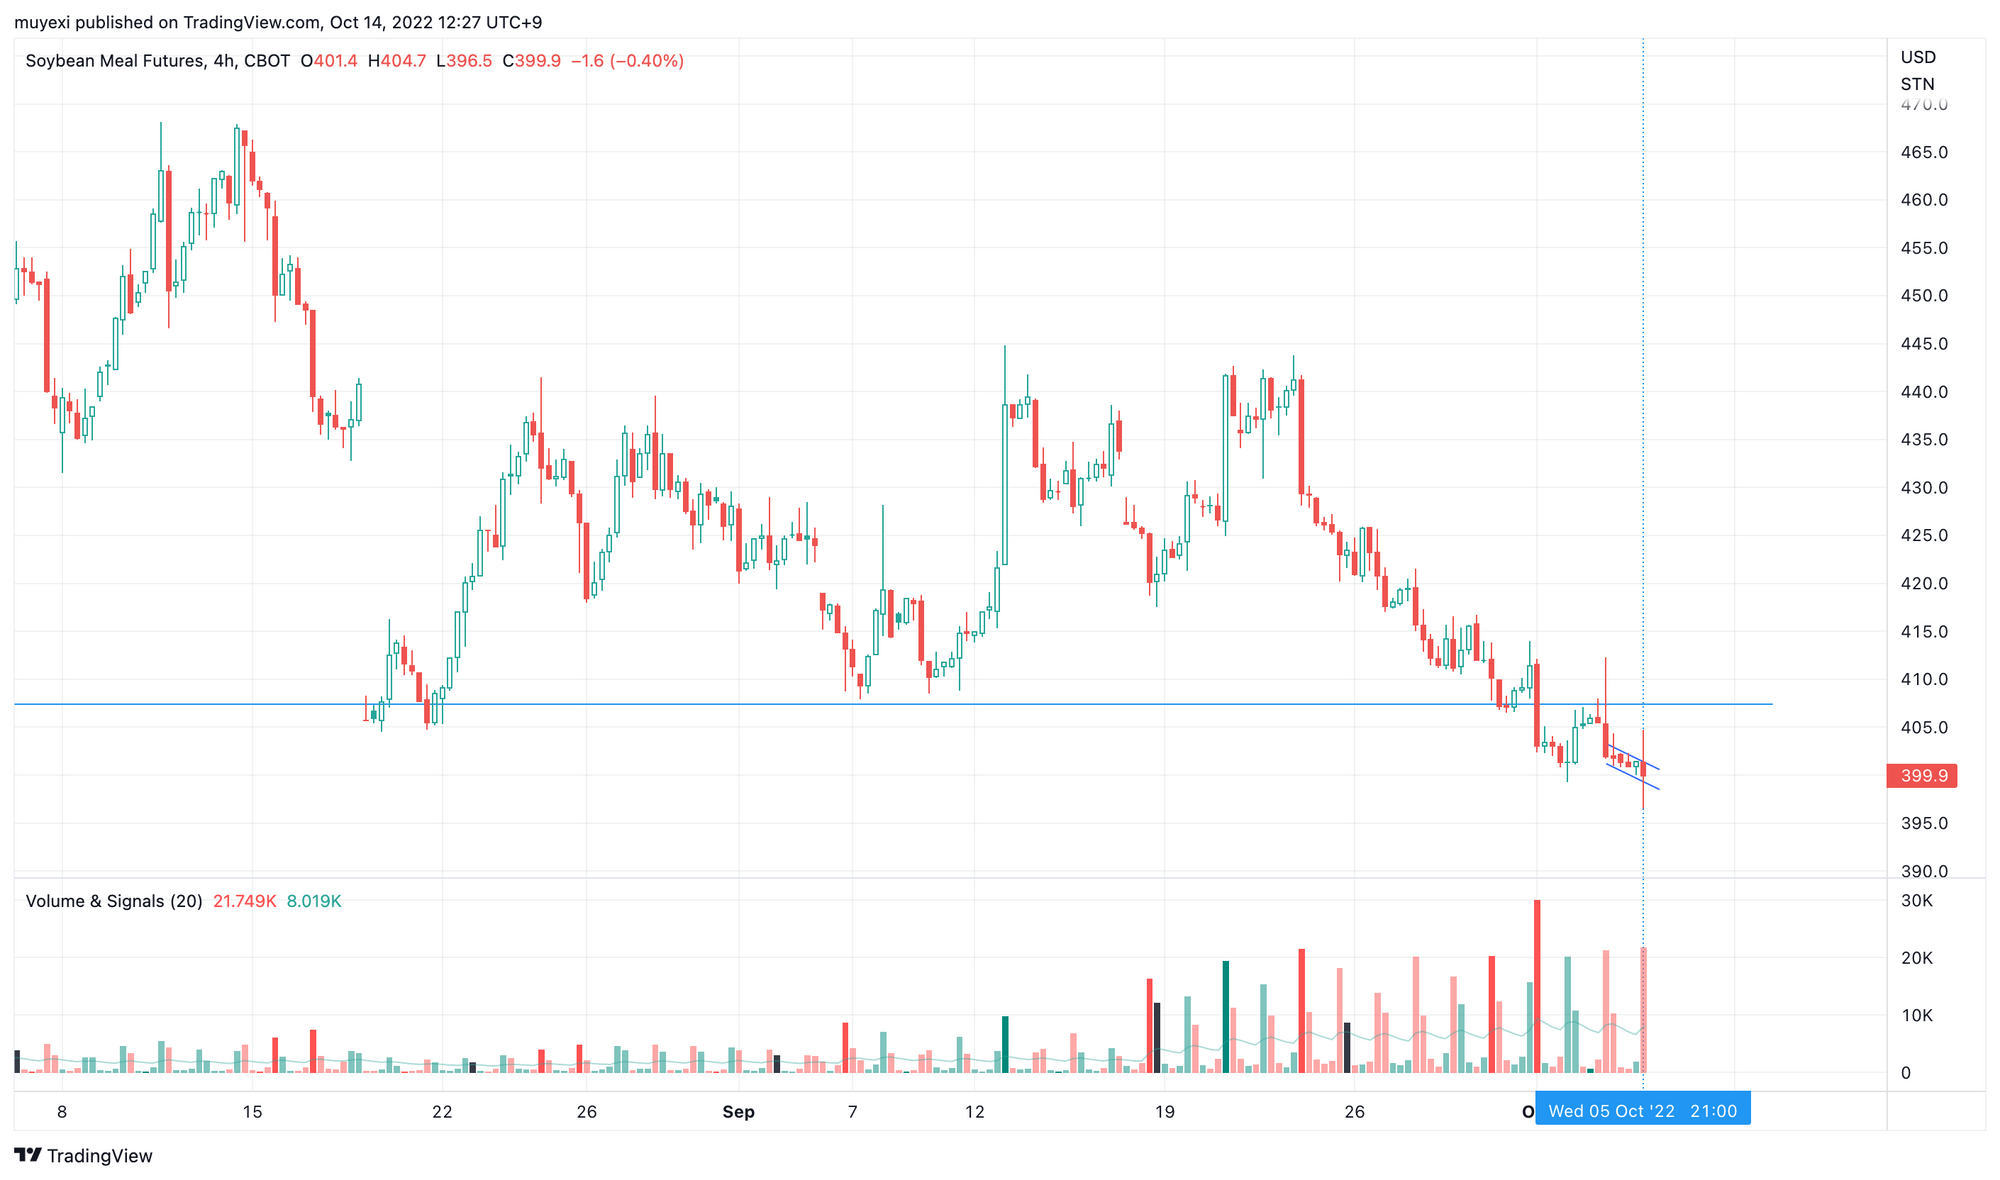
After falling below the key price, it rebounded, but it did not cross. After closing the shadow line, it fell in the former low channel.
This article is reprinted from: https://muyexi.im/guan-jian-jie-wei-de-guan-jian-bo-dong/
This site is for inclusion only, and the copyright belongs to the original author.