Original link: https://notes.ljl.li/introducing-tin/

I saw that some mathematical art is really delicate and elegant, and I also had the idea of mathematical creation, so I realized this idea.
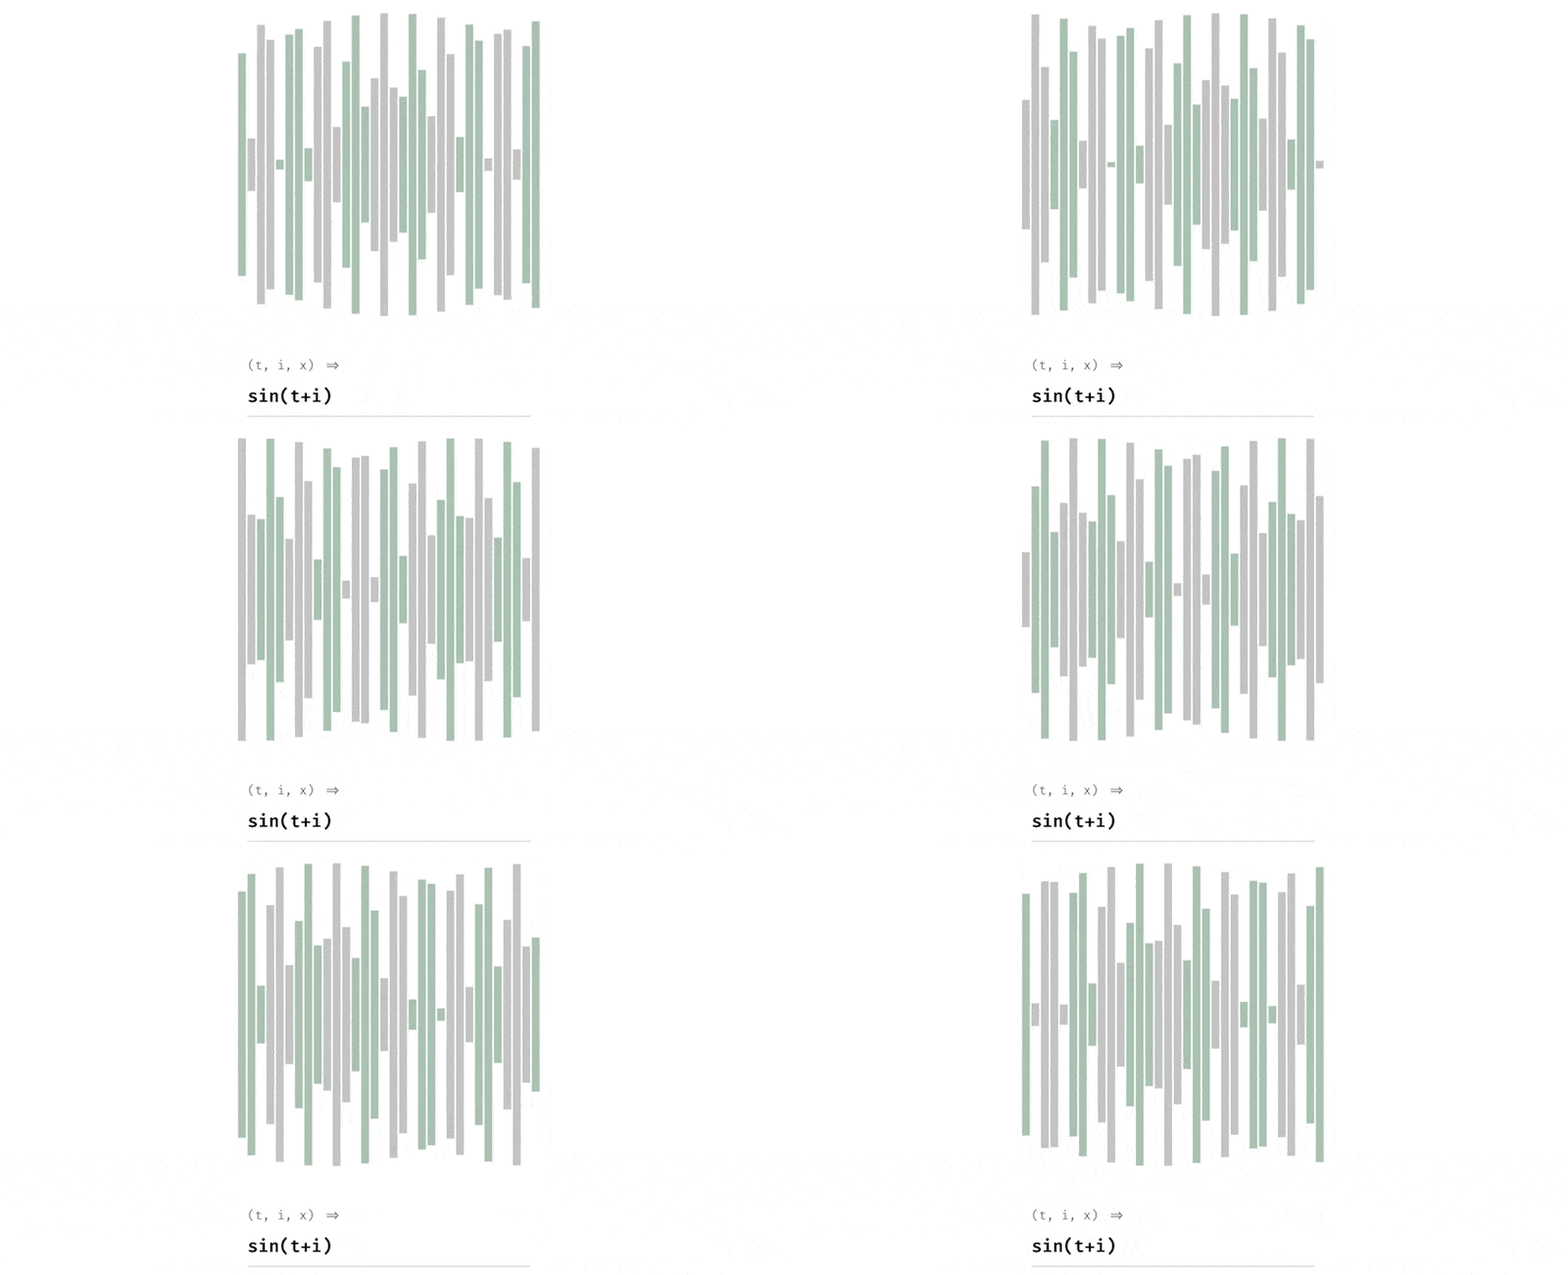
A tool that can generate graphs using functions, t , i , and other variables, named Tin .
 Tin
Tin
Highlights
- Click
(t, i, x)to select different dimensions. Currently, one-dimensional, two-dimensional, and three-dimensional coordinate systems can be selected, and polar coordinate systems may be added in the future. - Interactable. Select a point to view the state and curve of the function where the point is located.
 Spy Mode
More
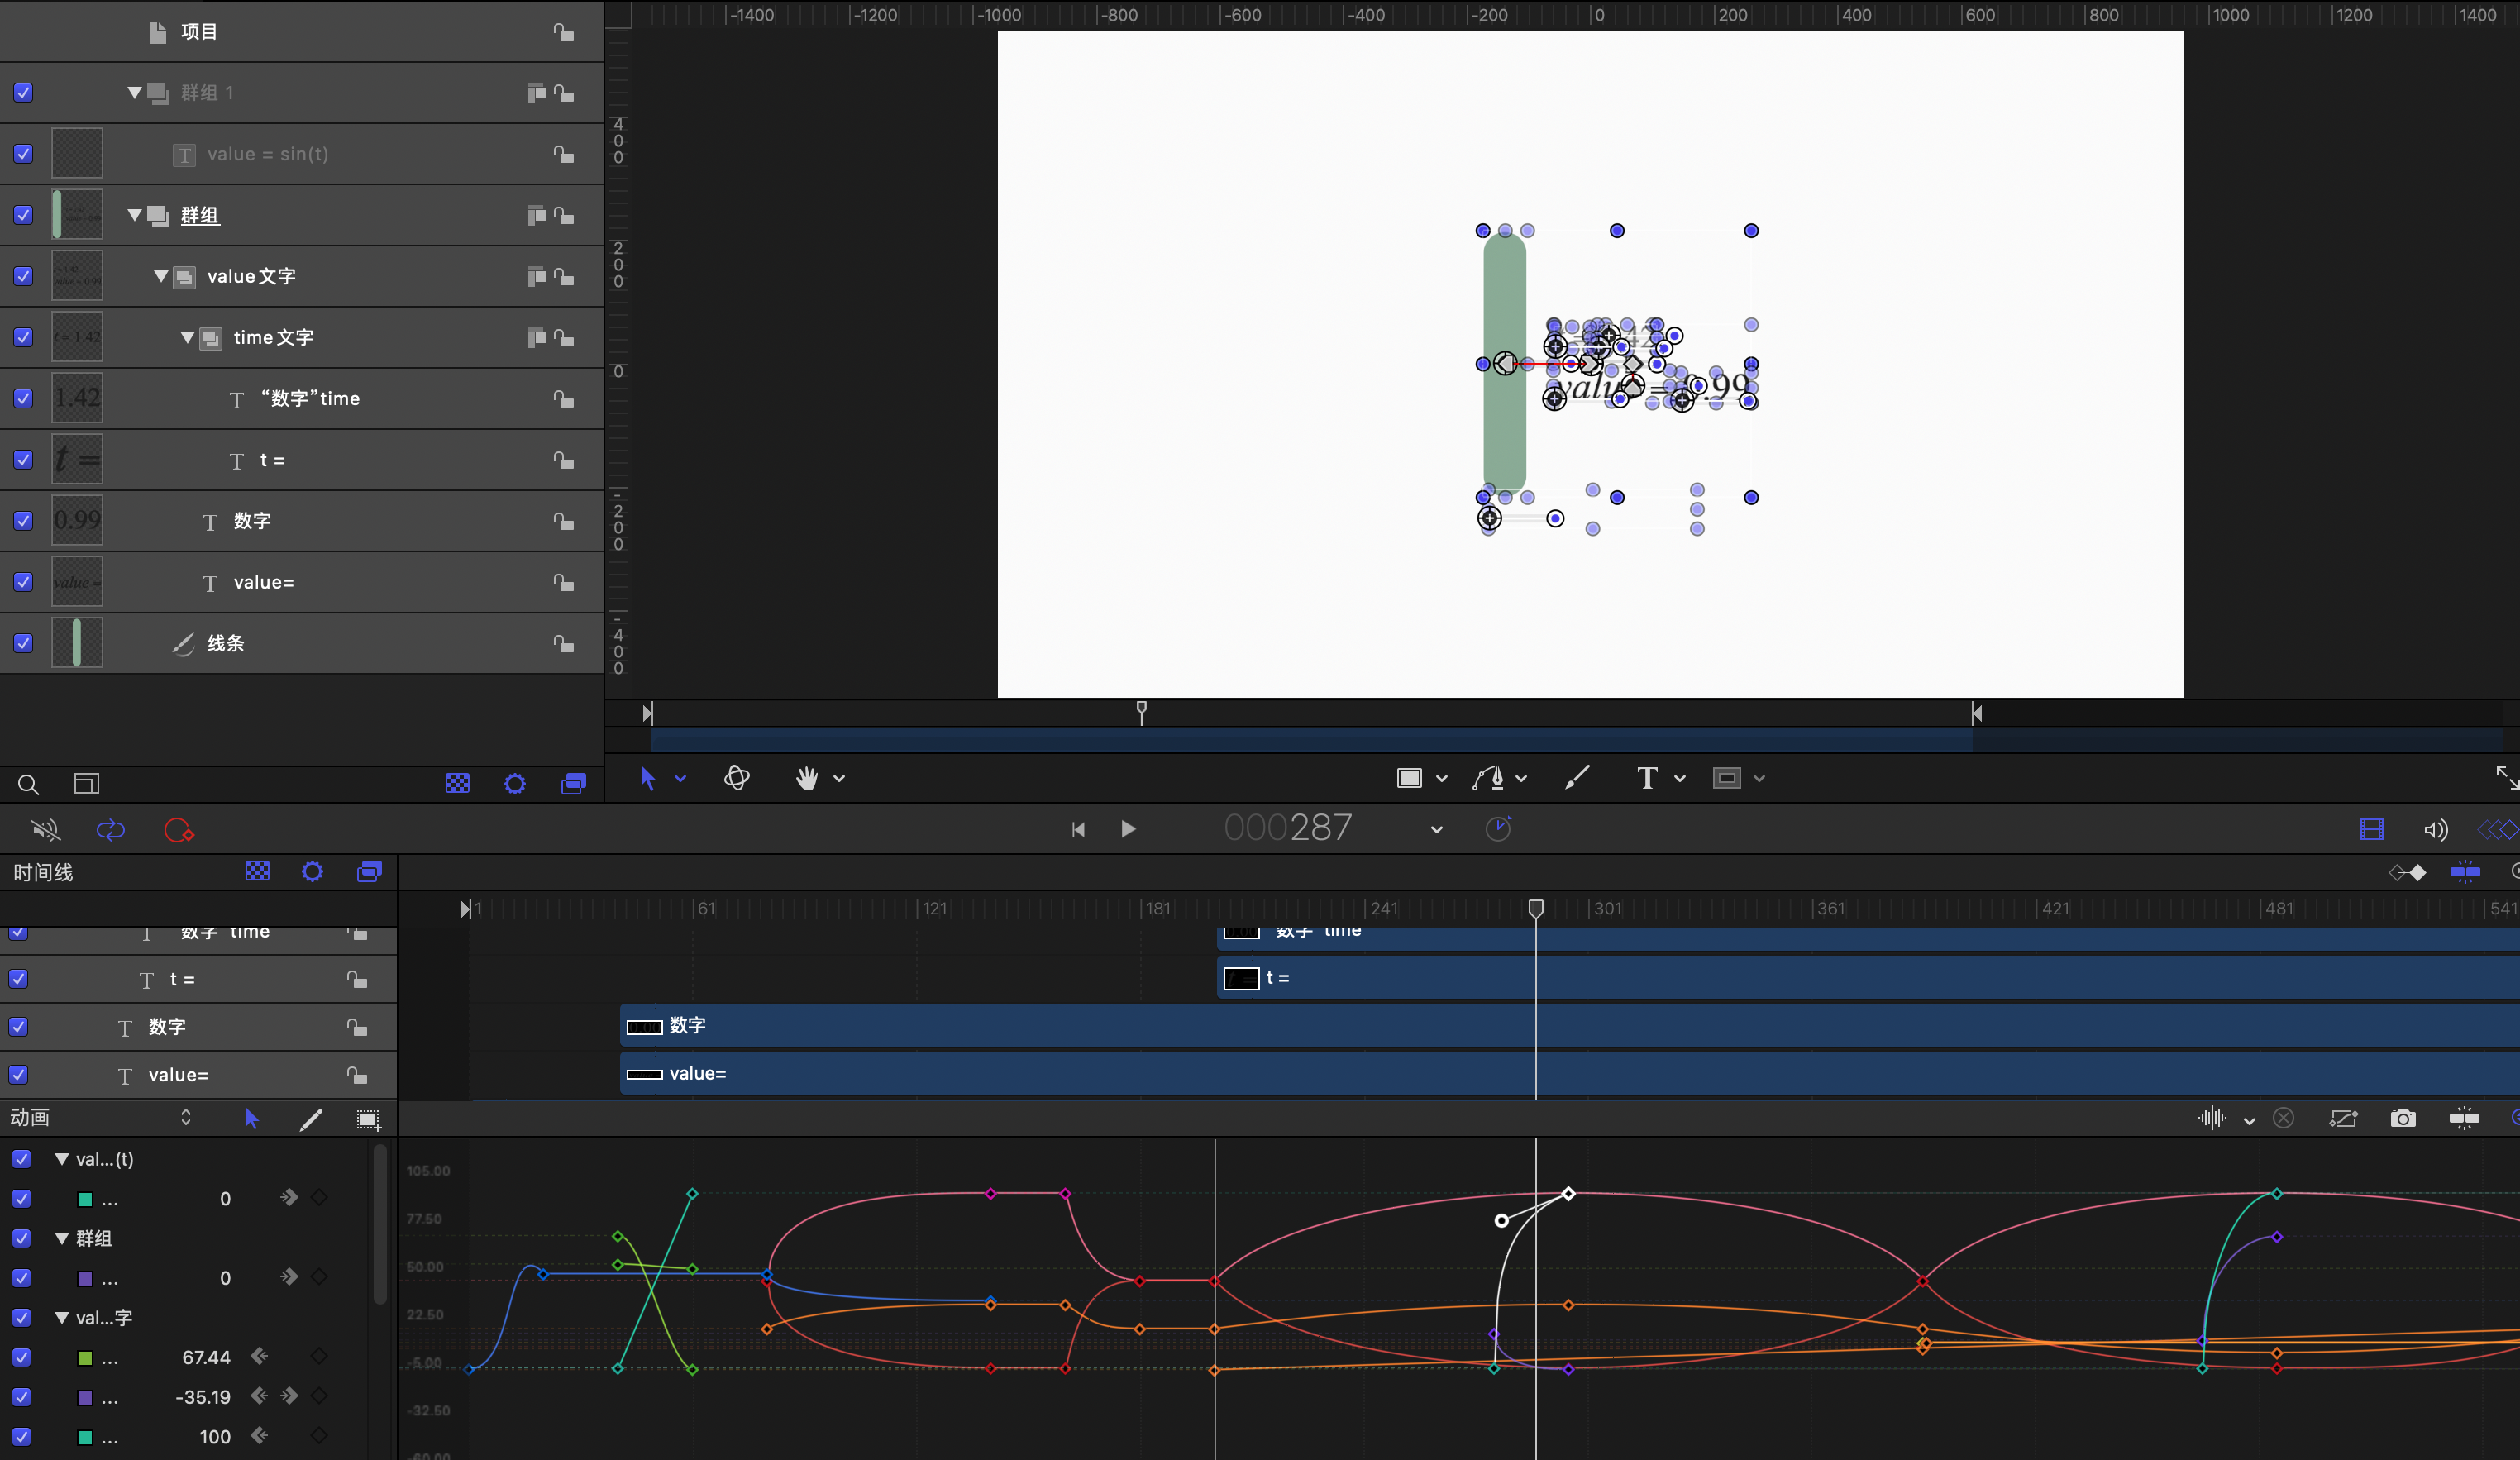
 Video made by Motion
Recently, I am also trying to video some projects. It took a few days to make a video of this project. You can click to view the video version:
https://www.bilibili.com/video/BV1NL4y1P7Gt
Link
- Github : https://github.com/ddiu8081/tin
- Website : https://tin.ddiu.io/
This article is reprinted from: https://notes.ljl.li/introducing-tin/
This site is for inclusion only, and the copyright belongs to the original author.