Original link: https://www.kawabangga.com/posts/5217
I maintain a service mesh platform in the company, mainly to act as a proxy for user requests. When the user’s service wants to call another service, the request is sent to our process, and then we forward it to the corresponding service.
I received a user work order today, which means that in a 50ms delay environment, the actual delay for them to call other services is much greater than 50ms, and there is a delay of about 200ms. I see that this problem is the same as the problem here in ” The Impact of TCP Congestion Control on Data Delay “, and it should be a sub-question. So I went to verify that if there is a high delay when the TCP connection is established, then it didn’t run. It turns out that the QPS of this user is not that low. Our TCP connection keepalive is 60s, and the user will have a request almost every 5s.
This is troublesome. This kind of problem is the most annoying, because the operating environment is relatively complicated. This kind of delay problem may be a problem of users, it may be a problem of our platform, it may be a problem of SDN (an overlay network architecture we use), or it may be a problem of our kernel. It is extremely difficult to troubleshoot.
Fortunately, the reason was finally located, and the final conclusion surprised me. I thought I knew more about TCP, but I didn’t expect it to be caused by a TCP behavior that I had never heard of! If you have heard of this parameter, 1 minute will do the trick. Here’s a trick first, let’s not talk about the parameters, let me start with the initial investigation of this problem.
The work order submitted by the user only said that the P99 delay increased, and a single request in the metrics monitoring system may fluctuate P99, so first locate the specific log with slow requests. According to the user’s description (after going back and forth in the middle), I grep the log to find that there are indeed outrageous requests with high latency. Finally, the problem on the user’s side was ruled out.
Then I asked the development of our platform to analyze why we spend so much extra time inside the platform? The answer was “network problem”. Hey, don’t know what I’m expecting, almost every time this kind of question is concluded as “network problem” (but this time it really is, lol). If you go to the network team and say “you have a problem with the network, please check it”, what can they do? At least you have to locate where there is a problem on the network and have evidence. Looks like I have to do it myself. Considering that I can see similar slow requests in the log of my tail -f , it is not difficult to analyze.
As mentioned earlier, since the user’s request is greater than one per minute, it should not be the overhead of TCP connection establishment. Here, I find a client-server IP pair to capture packets. When I observe slow requests from the logs, I stop capturing packets, and then use the keywords in the logs to locate the specific segment in the captured packets. Because it is a self-implemented TCP protocol, Wireshark does not know this protocol, so I have to use tcp.payload contains "request header" to filter the request directly from the payload.
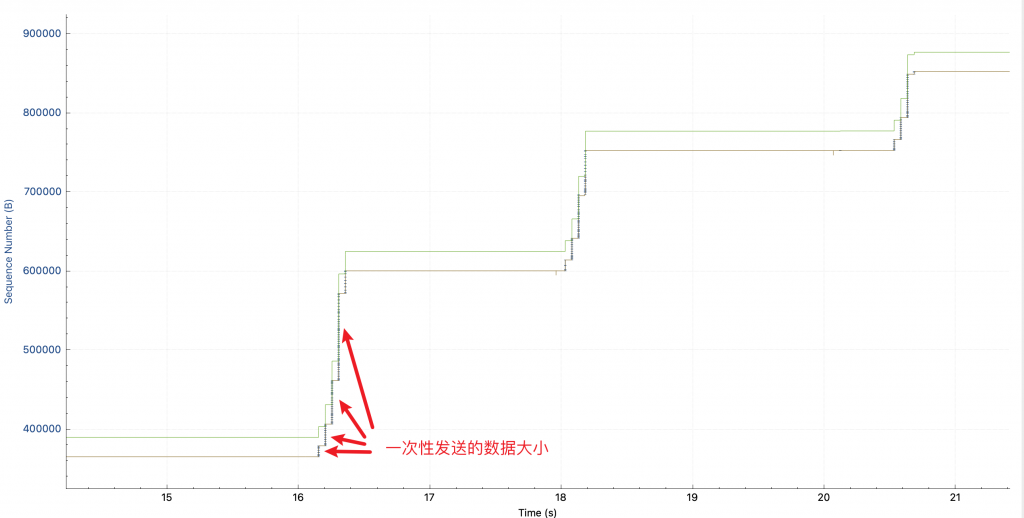
After finding the slow request, I found that the response was relatively large, so I analyzed tcptrace, and the picture I saw was as follows (if you don’t understand this picture, you can use Wireshark to analyze the TCP throughput bottleneck ):
On the way, the height of each vertical line can be understood as the amount of data sent at one time: in the first request (the first time it rises in the figure), it is sent slowly at first, and faster and faster. That is, the cwnd congestion control window is slowly opening. Among them, the green line rwnd is not the bottleneck, it looks relatively low, because the TCP connection already exists when I capture the packet, and no SYN packet is captured, so wireshark does not know the window scaling factor.
but! ! Why 2 seconds later, when sending the second request, the height of the vertical bar starts from very small again? This is the same TCP connection, no re-establishment. And there is no packet loss and retransmission.
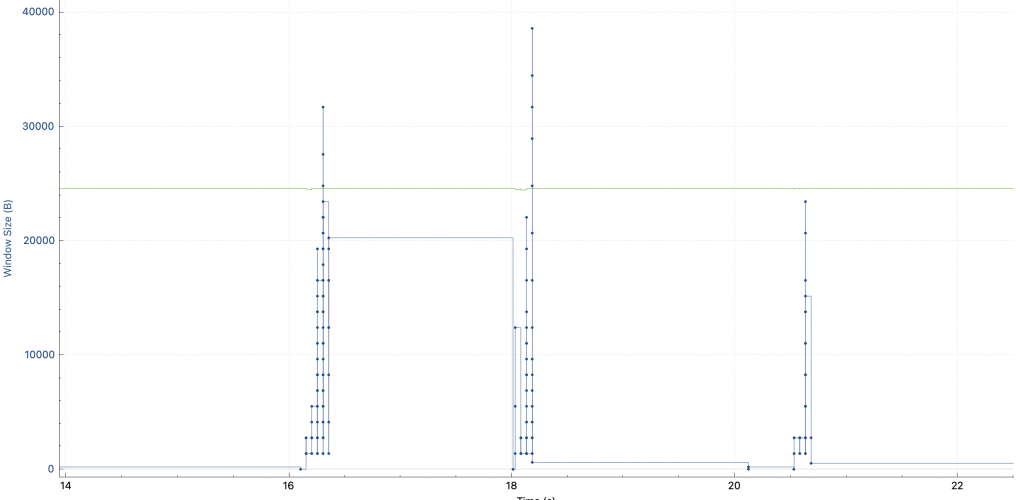
The congestion control algorithm cubic I understood before will only shrink cwnd when a congestion event occurs. So I thought I was wrong, but switched to the window scaling view and found that cwnd does reset every request.
This is different from the congestion control algorithm I understand! So I searched for “why my cwnd reduced without retrans”, but found almost no useful information.
Even confirmed from this answer : Cubic will not reset cwnd when it is idle. This answer mentions a possible application issue.
So, in the next step, I want to figure out whether it is the tcp usage problem of our platform code.
I wrote a simple code to simulate this behavior. As a client, it sends 1M data every 10s, then idles for 10s, and sends repeatedly.
 import socket
import sys
import time

ip = sys.argv[1]
port = int(sys. argv[2])

print("send data to %s:%d" % (ip, port))


s = socket. socket()

s. connect((ip, port))

char = "a". encode()
size = 1 * 1024 * 1024
data = char * size


def send():
    print("start sending data = %s bytes" % size)
    s. send(data)
    print("sending done")

while 1:
    send()
    for count in range(10, 0, -1):
        print("sending next in %ds..." % count)
        time. sleep(1)
Open a port with nc on the server: nc -l 10121 , then run the code on the client: python tcpsend.py 172.16.1.1 10121 , you can see that the data is being sent:
 start sending data = 1048576 bytes
sending done
sending next in 10s...
sending next in 9s...
sending next in 8s...
sending next in 7s...
sending next in 6s...
sending next in 5s...
sending next in 4s...
sending next in 3s...
sending next in 2s...
sending next in 1s...
start sending data = 1048576 bytes
sending done
sending next in 10s...
sending next in 9s...
sending next in 8s...
sending next in 7s...
I wrote a loop to print out the cwnd value of this connection using ss :
while true; do ss -i | grep 172.16.1.1 -A 1; sleep 0.1; done
From the output of this command, the problem was successfully reproduced! The problems of our platform code are sorted out:
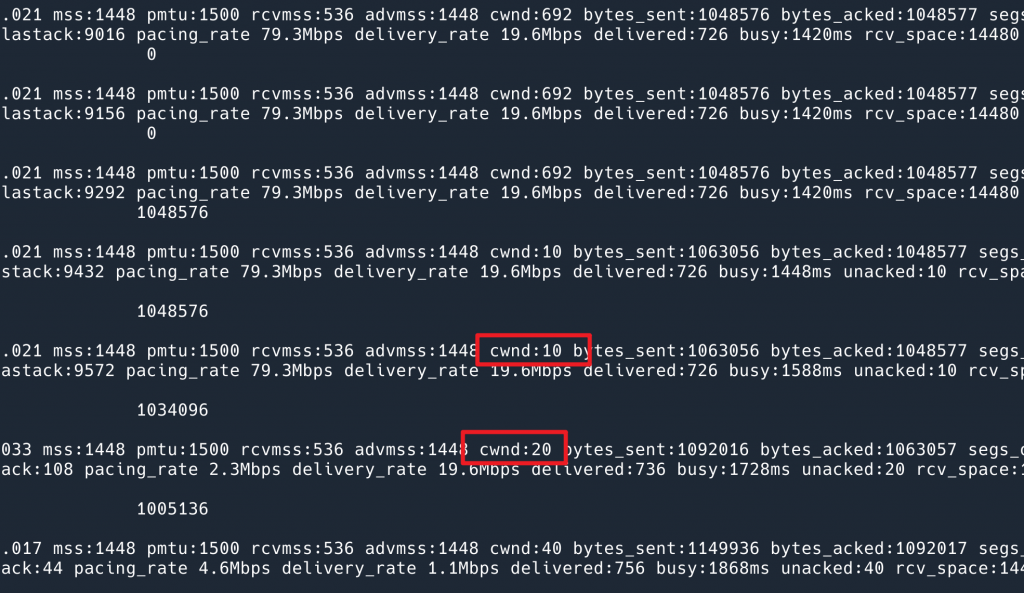 In order to hide the IP information, only part of the output is intercepted here. You can see that after sending the last 1M data, cwnd starts from 10 again when it is resent after 10s
At this point, I began to suspect that it was an SDN problem. To verify, I went to a simple network environment, a purely physical network, and ran my code again, and found that cwnd was not reset, indicating that it was an SDN problem.
So I called a colleague from the network group and showed him this. As a result, he also felt very surprised (again, I’m not the only one who doesn’t know about this behavior, so I have some comfort). Think this shouldn’t happen. But he was confident in their code that it couldn’t be an SDN problem. Then he suddenly said that this should be caused by network delay. The environment where SDN is located has a delay of 50ms, but the physical network I tested did not.
So I went to a physical network environment with a delay of 100ms to test, and the result… It really wasn’t an SDN problem, and I observed exactly the same phenomenon.
At this time, we have entered into unknown territory. I went to open the chatGPT waste , it said that the congestion control algorithm will reduce cwnd after idle. How fresh, never heard of it.
Our congestion control algorithm uses cubic, so my colleagues and I went to see the code of cubic . If you can see this logic, then everything makes sense.
After reading for a long time, there are only a few hundred lines, and it is detected and tested with eBPF, but I can’t find the logic of reset cwnd when it will idle. I feel that I have entered a dead end, and searching the Internet for cubic reset cwnd when idle is also in vain.
A colleague came up with an idea: Let’s switch to BBR to see if it can solve the problem? !
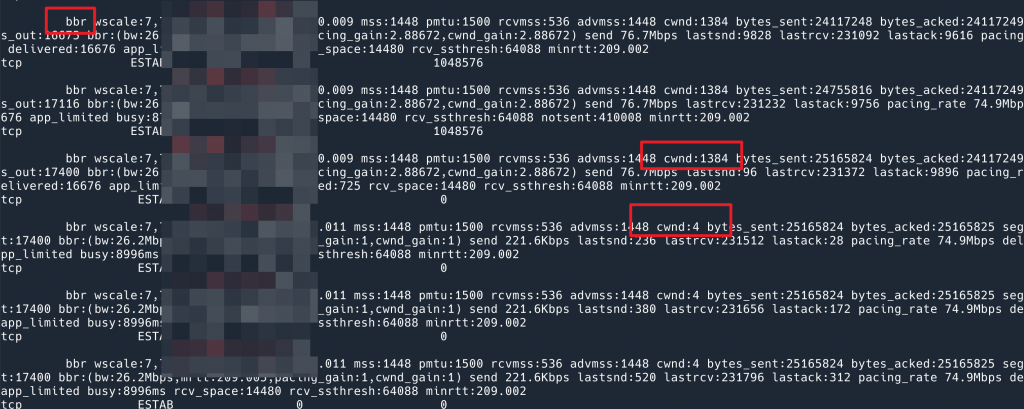
From the phenomenon point of view, BBR is much faster. I thought the problem was solved, but after looking at the output of my script, I found that the problem still exists. After the data is sent, the cwnd will drop to 4, but the BBR window scaling is very fast, and it jumps to 1384 as soon as the data is sent.
But this reminds me: either all the algorithms implement the ghost logic of reset cwnd when idle, or, this is not implemented by the algorithm at all, but by the system!
Considering that I have read the code of cubic all afternoon, I am more inclined to the latter.
What to do next? You can’t read the code of the protocol stack again.
At this time, I made an action by intuition. I printed out the system’s TCP-related configuration, sysctl -a | grep tcp , to see if there were any clues, and a net.ipv4.tcp_slow_start_after_idle directly woke me up. Isn’t this exactly the problem we have encountered?
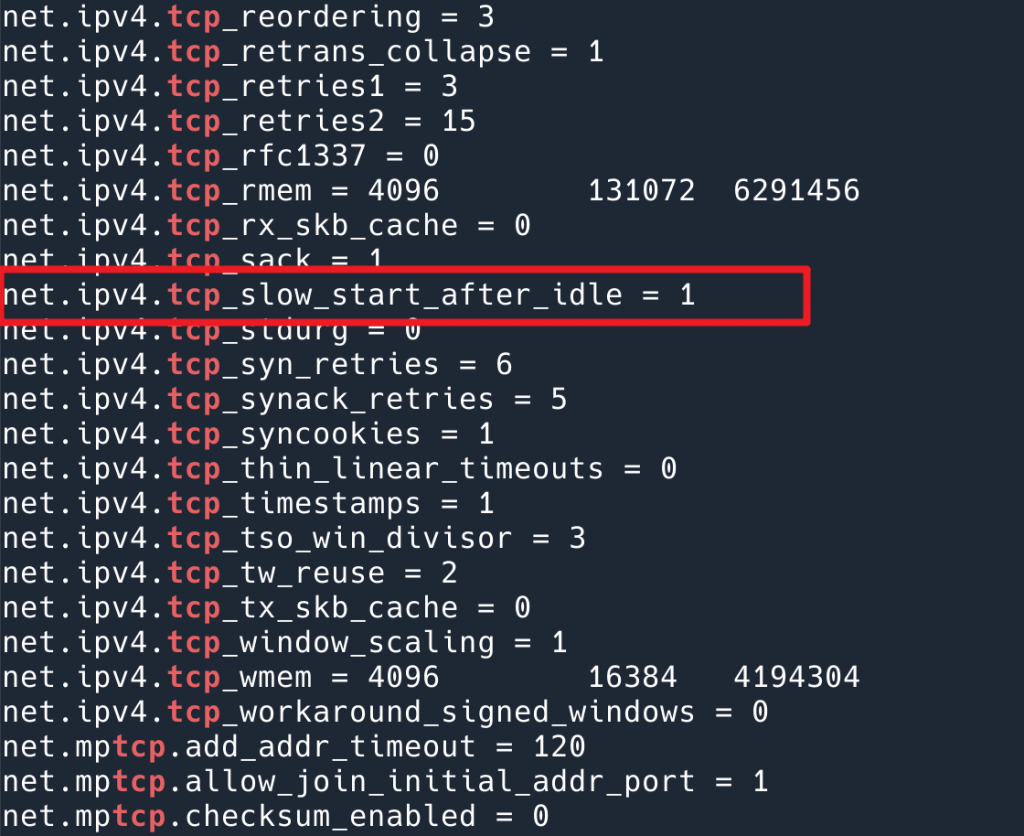 net.ipv4.tcp_slow_start_after_idle parameter, the default is 1 (open)
I changed it to 0 and the problem was completely solved:
 $ sysctl -w net.ipv4.tcp_slow_start_after_idle=0
net.ipv4.tcp_slow_start_after_idle = 0
Then observe cwnd later, and it is stable at around 1000.
With this behavior, it is easy for me to find the reason for doing so.
RFC2414 mentioned:
TCP needs to use slow start in three situations (from this statement, it can also be seen that slow_start_after_idle is not what the congestion control algorithm should do. What the congestion control algorithm needs to do is to implement slow start, and the implementation of TCP is to use slow start):
- When the connection is just established (Initial Window)
- After the connection is idle for a period of time, when restarting (Restart Window)
- When packet loss occurs (Loss Window)
So why do you need (2) slow start after idle? I found RFC 5681 , the section about “Restarting Idle Connections”, to the effect:
The congestion control algorithm uses the received ACK to confirm the network quality to avoid congestion, but after a period of idle time, no ACK is being transmitted, and the state saved by the congestion control algorithm may no longer reflect the network situation at this time. The load has not changed, but the network environment may have changed (routing table switching or the like?), which will also cause the knowledge before 10s to no longer apply.
So, this RFC defines:
Within the RTO (Retransmission Timeouts) time, if the sender does not send any segment out, then the next time data is sent, cwnd should be reduced to RW(Restart Window, RW = min(IW,cwnd) ).
At this point, the above behavior is explained.
So what’s the solution? Because this parameter is by network namespace, we intend to turn off this parameter for our process in a high-latency network.
A few details:
Why did I fail to reproduce it when I first tested it on a low-latency physical network?
In fact, I have the same problem, but the while loop above me has sleep 0.1 , because the delay of the environment is too low, so the command cannot be displayed. cwnd will also reset to zero.
RFC 5681 mentions: Van Jacobson’s original proposal is: when the sender does not receive a segment within the RTO time, then when sending data next time, cwnd is reduced to RW. This is problematic. For example, in an HTTP long connection, after being idle for a period of time, the server starts to send data, which should be slow start. At this time, the client suddenly sends another request, which will cause the server to no longer slow start. Therefore, it has been changed to the current situation: if the sender of the data has not sent data at the RTO, it needs to slow start.
In the previous article, the impact of TCP congestion control on data delay, we used long connections to try to solve the problem of high slow start delay of long fat pipelines, which was wrong.
related articles:
This article is transferred from: https://www.kawabangga.com/posts/5217
This site is only for collection, and the copyright belongs to the original author.
