Original link: https://www.luozhiyun.com/archives/725
This article uses Prometheus v2.40 source code
Please declare the source of the reprint~, this article was published on luozhiyun’s blog: https://www.luozhiyun.com/archives/725
This article is mainly to sort out how Prometheus’s time series database stores and manages data. I hope this article can bring some inspiration to everyone.
overview
Let’s take a look at the entire architecture diagram of Prometheus:
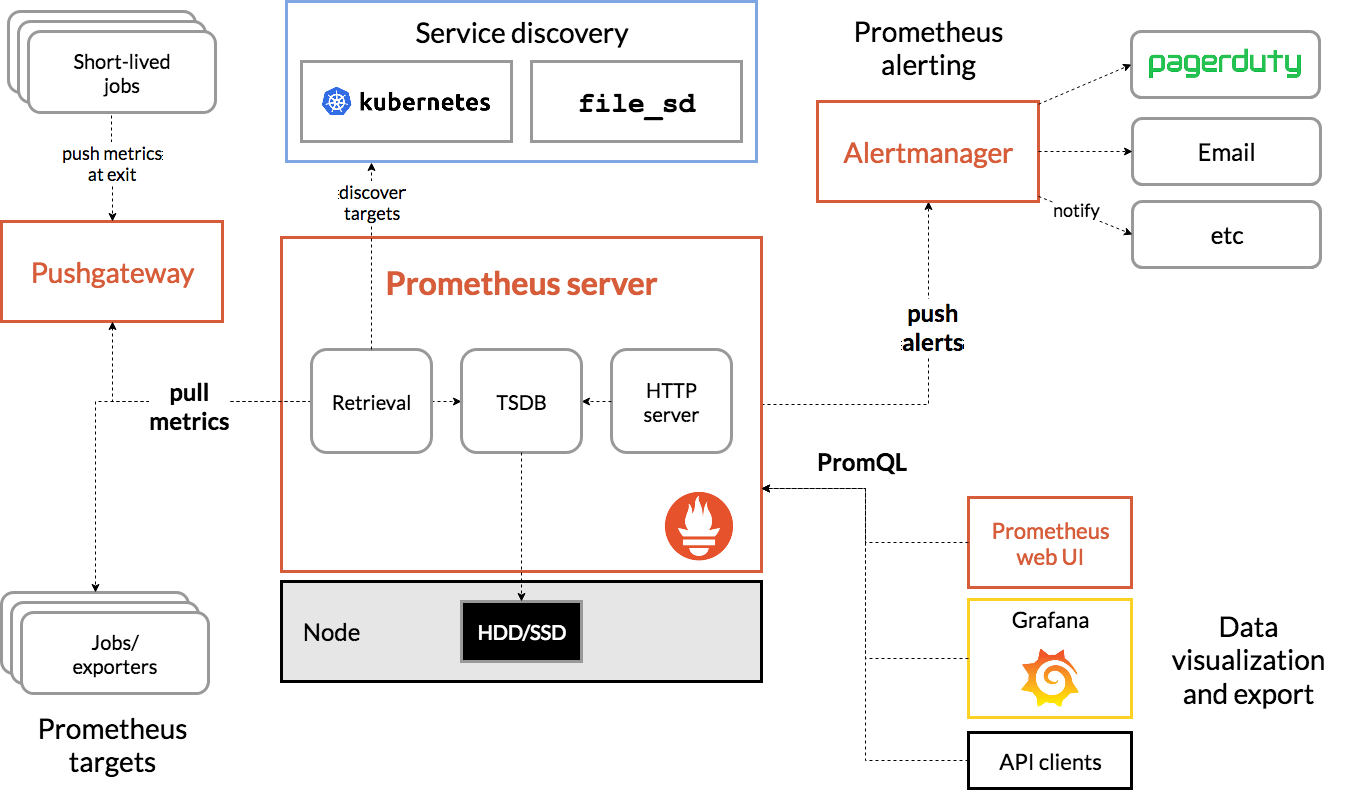
For Prometheus Server, the entire data processing process is divided into three parts: the collection of Exporter indicators, the capture of Scraper data, the storage and query of TSDB data; Exporter actually has different collection implementations for different services, similar to Mysqld-exporter, node Exporter, etc. We don’t do too much interpretation here, you basically only need to know that it will expose a port, and Scraper will collect from it at regular intervals. The Scraper data capture department will be explained in detail below.
Let’s first understand what is a time series database (Time Series Database, TSDB). TSDB is designed to store data that changes over time, such as stock prices, sensor data, etc. The time series (time-series) is all the history of a variable over time, and the sample (sample) refers to the instantaneous value of the variable in the history:
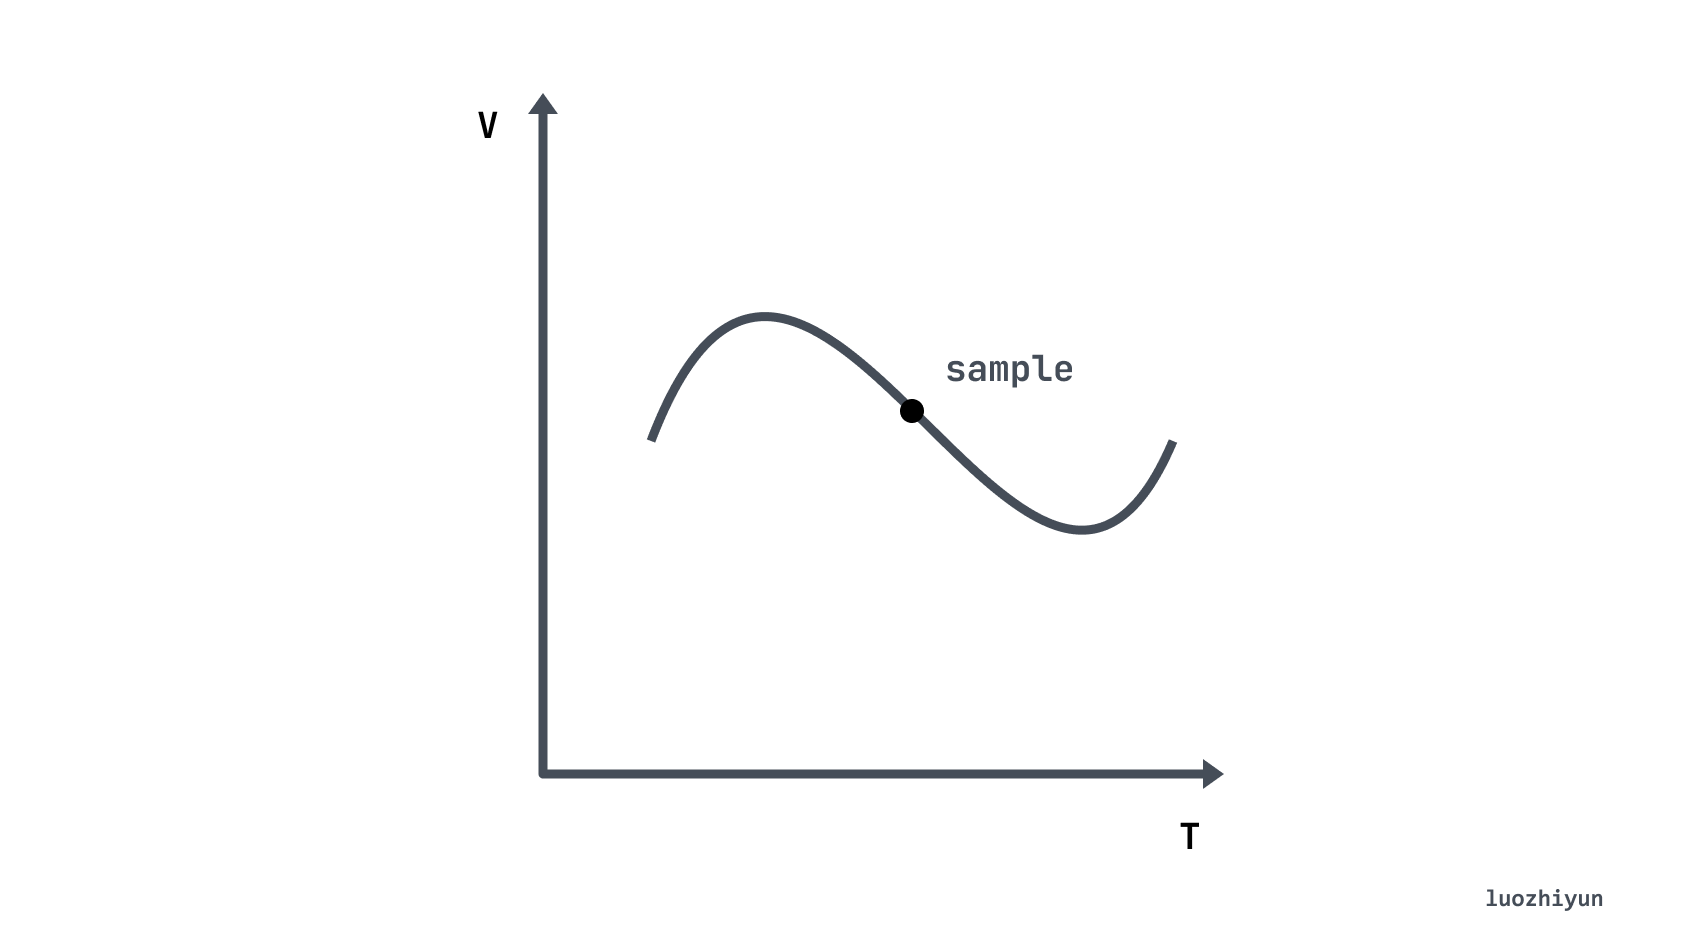
Going back to our protagonist Prometheus, it will save all the collected sample (sample) data in the form of time series (time-series) in the memory database, and save it to the hard disk at regular intervals. Time series are stored in the sequence order of timestamp and value, and each time-series is named by an indicator name (metrics name) and a set of label sets (labelset). As shown below, a time series can be understood as a matrix of numbers with time as the Y axis:
^ │ . . . . . . . . . . . . . . . . . . . node_cpu{cpu="cpu0",mode="idle"} │ . . . . . . . . . . . . . . . . . . . node_cpu{cpu="cpu0",mode="system"} │ . . . . . . . . . . . . . . . . . . node_load1{} │ . . . . . . . . . . . . . . . . . . v <------------------ 时间---------------->So according to the above figure, we can understand that each point is called a sample, and the sample consists of the following three parts:
-
Indicator (metric name): metric name and description of the current sample characteristics. For example, node_cpu above indicates the CPU information of the node;
-
Timestamp (timestamp): a timestamp accurate to milliseconds, indicating the time of data recording;
-
Labels: make the same time series have different dimensions of identification, for example
node_cpu{cpu="cpu0",mode="idle"}indicates that all cpu0 status is idle information, when mode is equal to system, it is a new the metric; -
Sample value (value): A float64 floating-point data represents the value of the current sample, which is the Y axis in the above figure.
TSDB data write
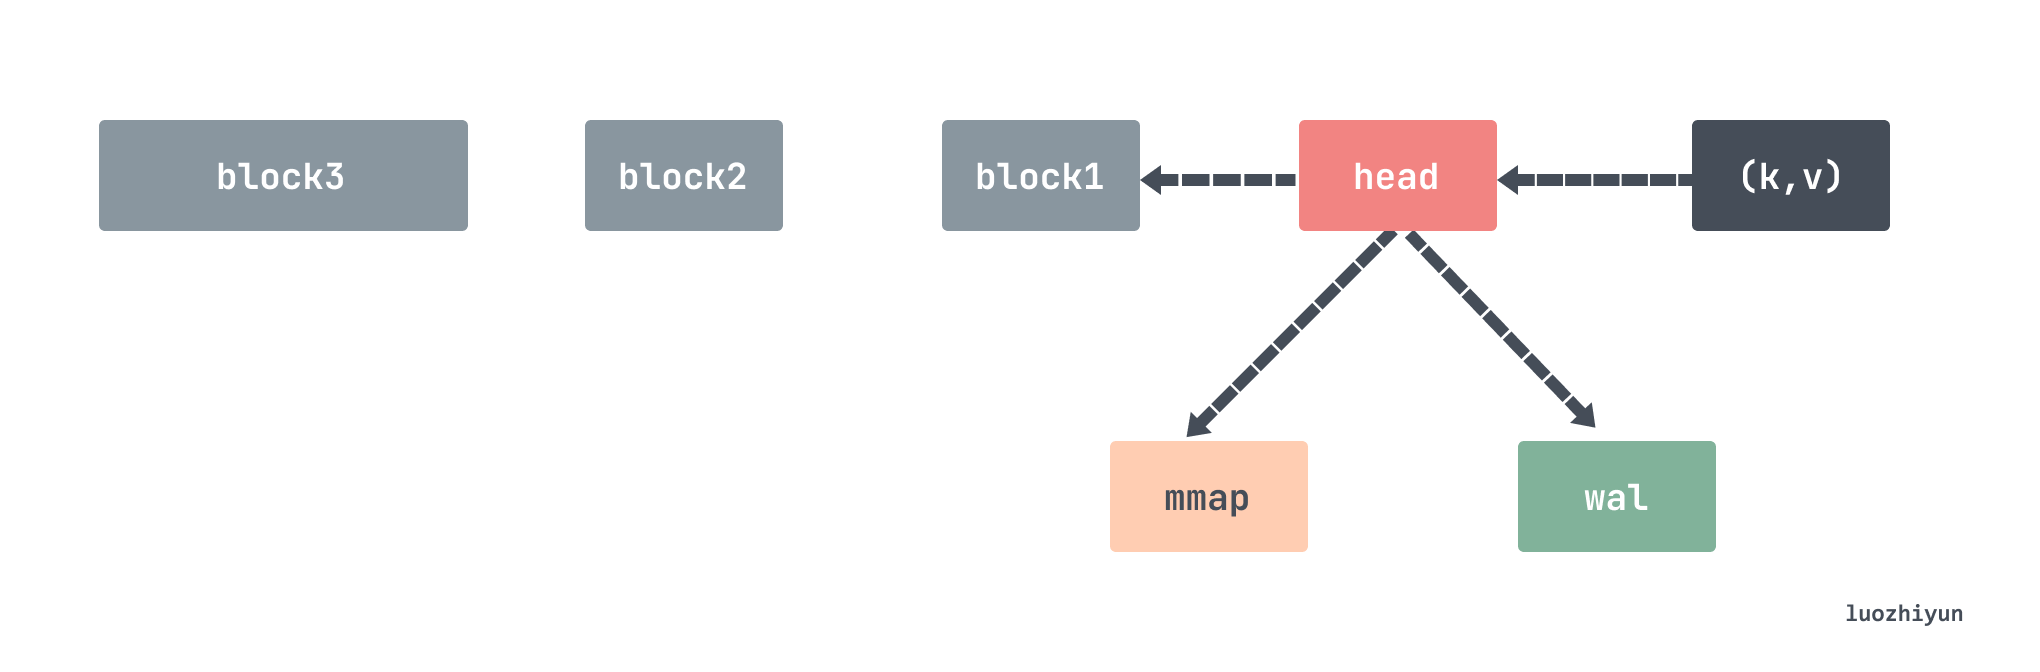
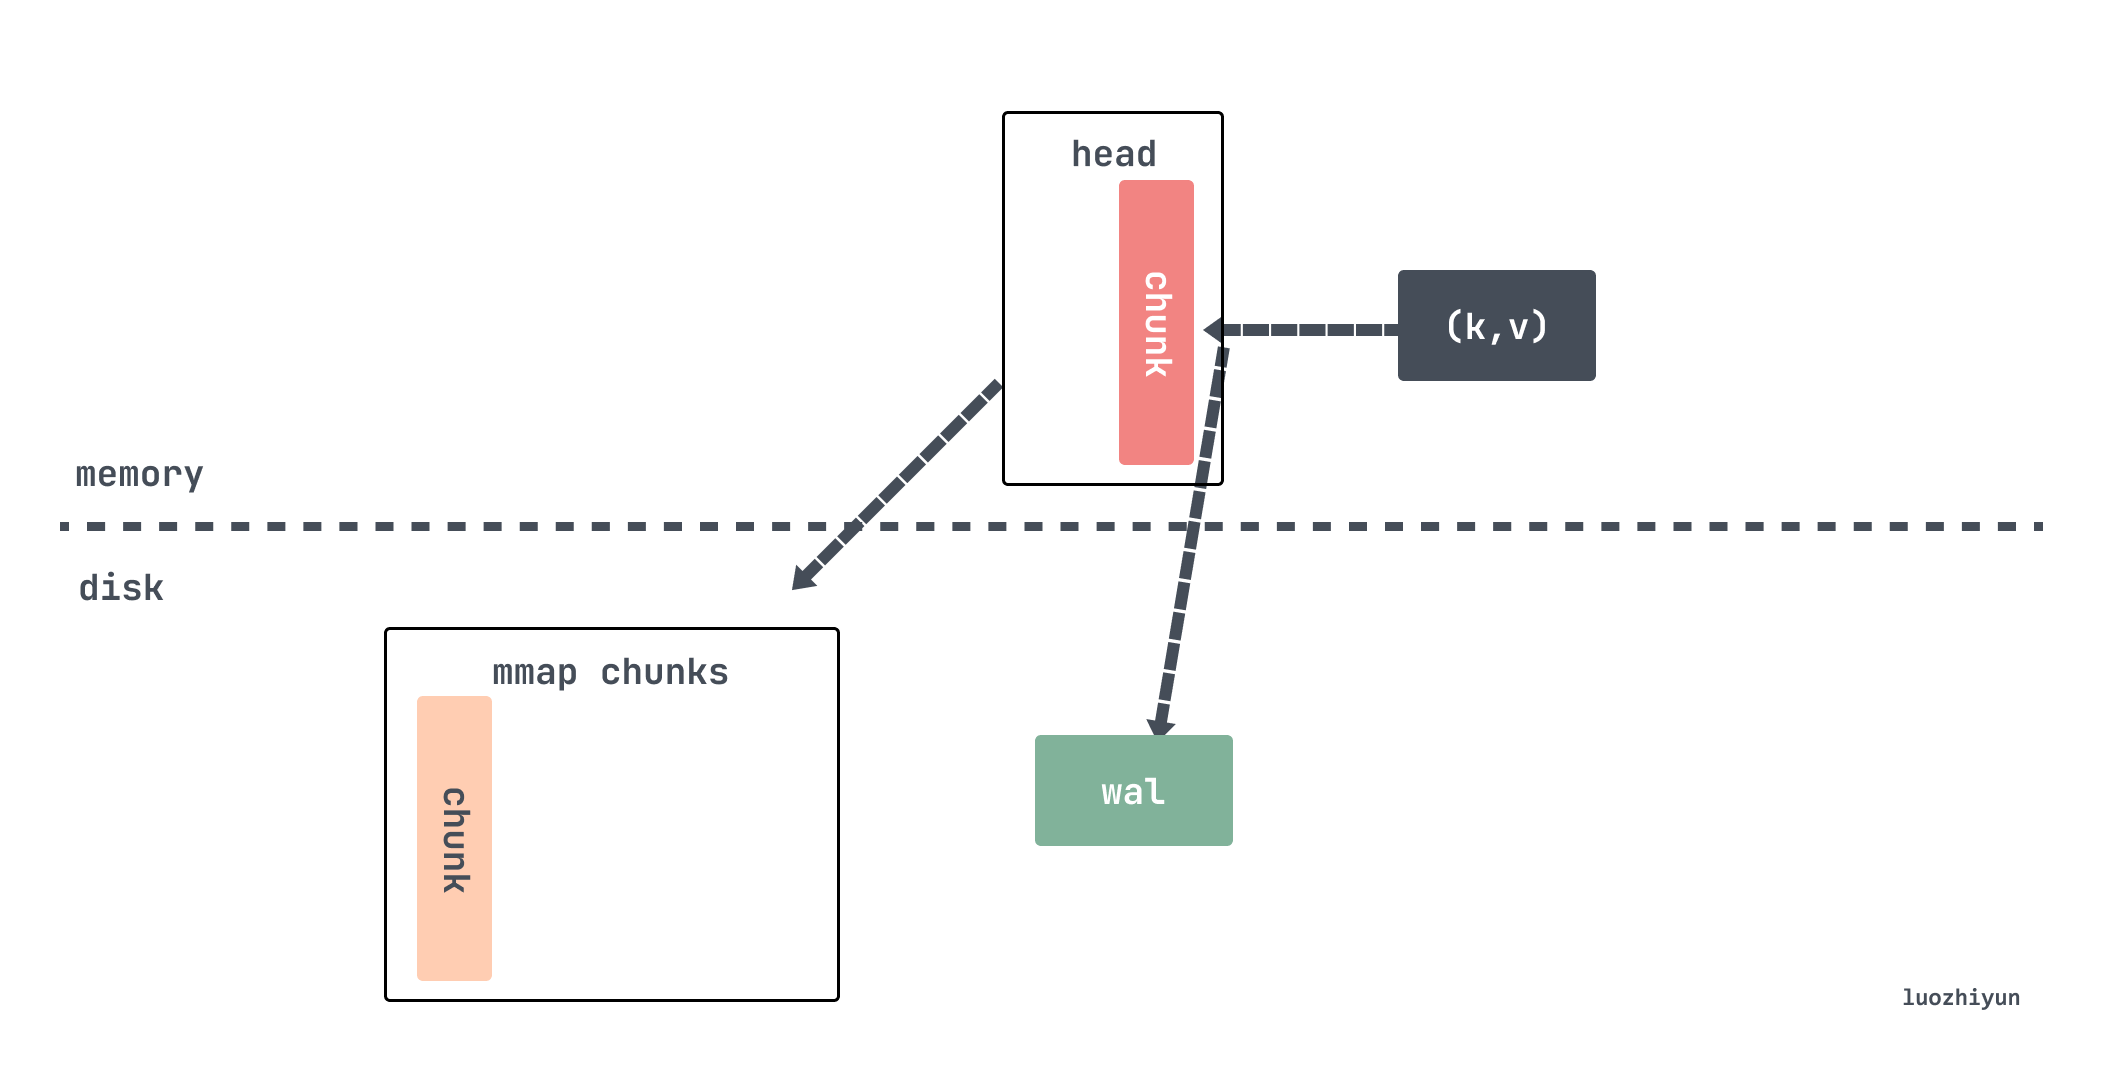
For Prometheus’s TSDB, it is first written to the head data block and WAL (Write-Ahead-Log) pre-write log. The head data block is located in memory, and the WAL log is used for temporary data persistence to prevent power failure. The data in the memory can still be restored after restarting. After the data in the head memory is written for a period of time, it will be flushed to the disk in the form of a data block chunk through mmap, and only the reference to the chunk is kept in the memory. When the amount of chunks data persisted to the disk reaches a certain threshold, this batch of old data will be stripped from the chunks and turned into block data blocks. Multiple older small blocks will periodically synthesize a large block, and finally the block will be deleted until the storage time reaches the threshold.
By default, all data will be placed under the ./data directory, which stores three types of data: chunks_head, wal, and block.
./data ├── 01GJ9EKDWSS1TA1V0RBP707V21 │ ├── chunks │ │ └── 000001 │ ├── index │ ├── meta.json │ └── tombstones ├── chunks_head │ └── 000012 └── wal ├── 00000013 ├── 00000014 ├── 00000015 └── checkpoint.00000012 └── 00000000
Each block will store all series indicator data within a 2-hour time window, and the file name of each block will use the library github.com/oklog/ulid to generate unique file names, which include metadata files, index files, and chunks folders , all indicator data are stored in the chunks folder, which contains multiple data segment information, each data segment will be divided into a file storage according to 512MB, and the deleted data will be stored in the tombstone folder.
The chunks_head folder also contains multiple chunks. When the head block of the memory cannot be written, the data will be stored under this folder and the reference to the file will be kept.
The data stored in the wal folder is the data currently being written. It contains multiple data segment files. The default maximum size of a file is 128M. Prometheus will keep at least 3 files, and it will keep at least 2 hours of data for high-load machines. The data in the wal folder is not compressed, so it will be slightly larger than the data in the block.
head block
Before v2.19, the indicator data of the last 2 hours was stored in the memory, v2.19 introduced the head block, the latest indicator data was stored in the memory, and when the memory was full, the data was flushed to the disk and associated with a reference Data flushed to disk.
The head block is the only active block, except for it, other blocks are immutable. We also said above that every time the data is grabbed from the scraper, it will be stored in the appender. This appender is actually the headAppender. The data is temporarily cached by calling the Append method, and the appender is used to add batches, and then commit Will actually write data.
// tsdb/head_append.go func (a *headAppender) Append(ref storage.SeriesRef, lset labels.Labels, t int64, v float64) (storage.SeriesRef, error) { // 获取该stripeseries对应的memSeries,ref实际上是lset的hash值s := a.head.series.getByID(chunks.HeadSeriesRef(ref)) if s == nil { var created bool var err error // 不存在则创建为该指标创建一个memSeries s, created, err = a.head.getOrCreate(lset.Hash(), lset) if err != nil { return 0, err } if created { a.series = append(a.series, record.RefSeries{ Ref: s.ref, Labels: lset, }) } } ... // 将数据缓存起来a.samples = append(a.samples, record.RefSample{ Ref: s.ref, T: t, V: v, }) a.sampleSeries = append(a.sampleSeries, s) return storage.SeriesRef(s.ref), nil }
All indicator data is stored in stripeseries. Every time lset (equivalent to the indicator key) is required to obtain the corresponding memSeries, getByID will lock according to the incoming lset dimension, and reduce lock conflicts by means of segmented locks. memSeries is where the real data is stored, storing the (t, v) key-value pairs corresponding to the recently added indicators. So here is just setting the relationship between sampleSeries and samples, and when Commit below, the corresponding data will be taken out and added to memSeries.
// tsdb/head_append.go func (a *headAppender) Commit() (err error) { // 写入wal日志if err := a.log(); err != nil { _ = a.Rollback() // Most likely the same error will happen again. return errors.Wrap(err, "write to WAL") } ... for i, s := range a.samples { series = a.sampleSeries[i] series.Lock() ... // 写入数据ok, chunkCreated = series.append(sT, sV, a.appendID, a.head.chunkDiskMapper, chunkRange) series.Unlock() } ... return nil }
The Commit method will take out the data stored in the samples, and then write the data circularly by calling the append of memSeries.
// tsdb/head_append.go func (s *memSeries) append(t int64, v float64, appendID uint64, chunkDiskMapper *chunks.ChunkDiskMapper, chunkRange int64) (sampleInOrder, chunkCreated bool) { // 判断head 里面的chunk 是否已满需要写入到磁盘,创建新的chunk c, sampleInOrder, chunkCreated := s.appendPreprocessor(t, chunkenc.EncXOR, chunkDiskMapper, chunkRange) // 调用xorAppender 添加指标数据s.app.Append(t, v) c.maxTime = t ... return true, chunkCreated }
When writing, it will check whether the currently written chunk is full of 120 samples. If it is full, then the old data needs to be written from the head chunk to the disk through mmap. If the capture interval is set to 15s, then the span of 120 samples is 30 minutes.
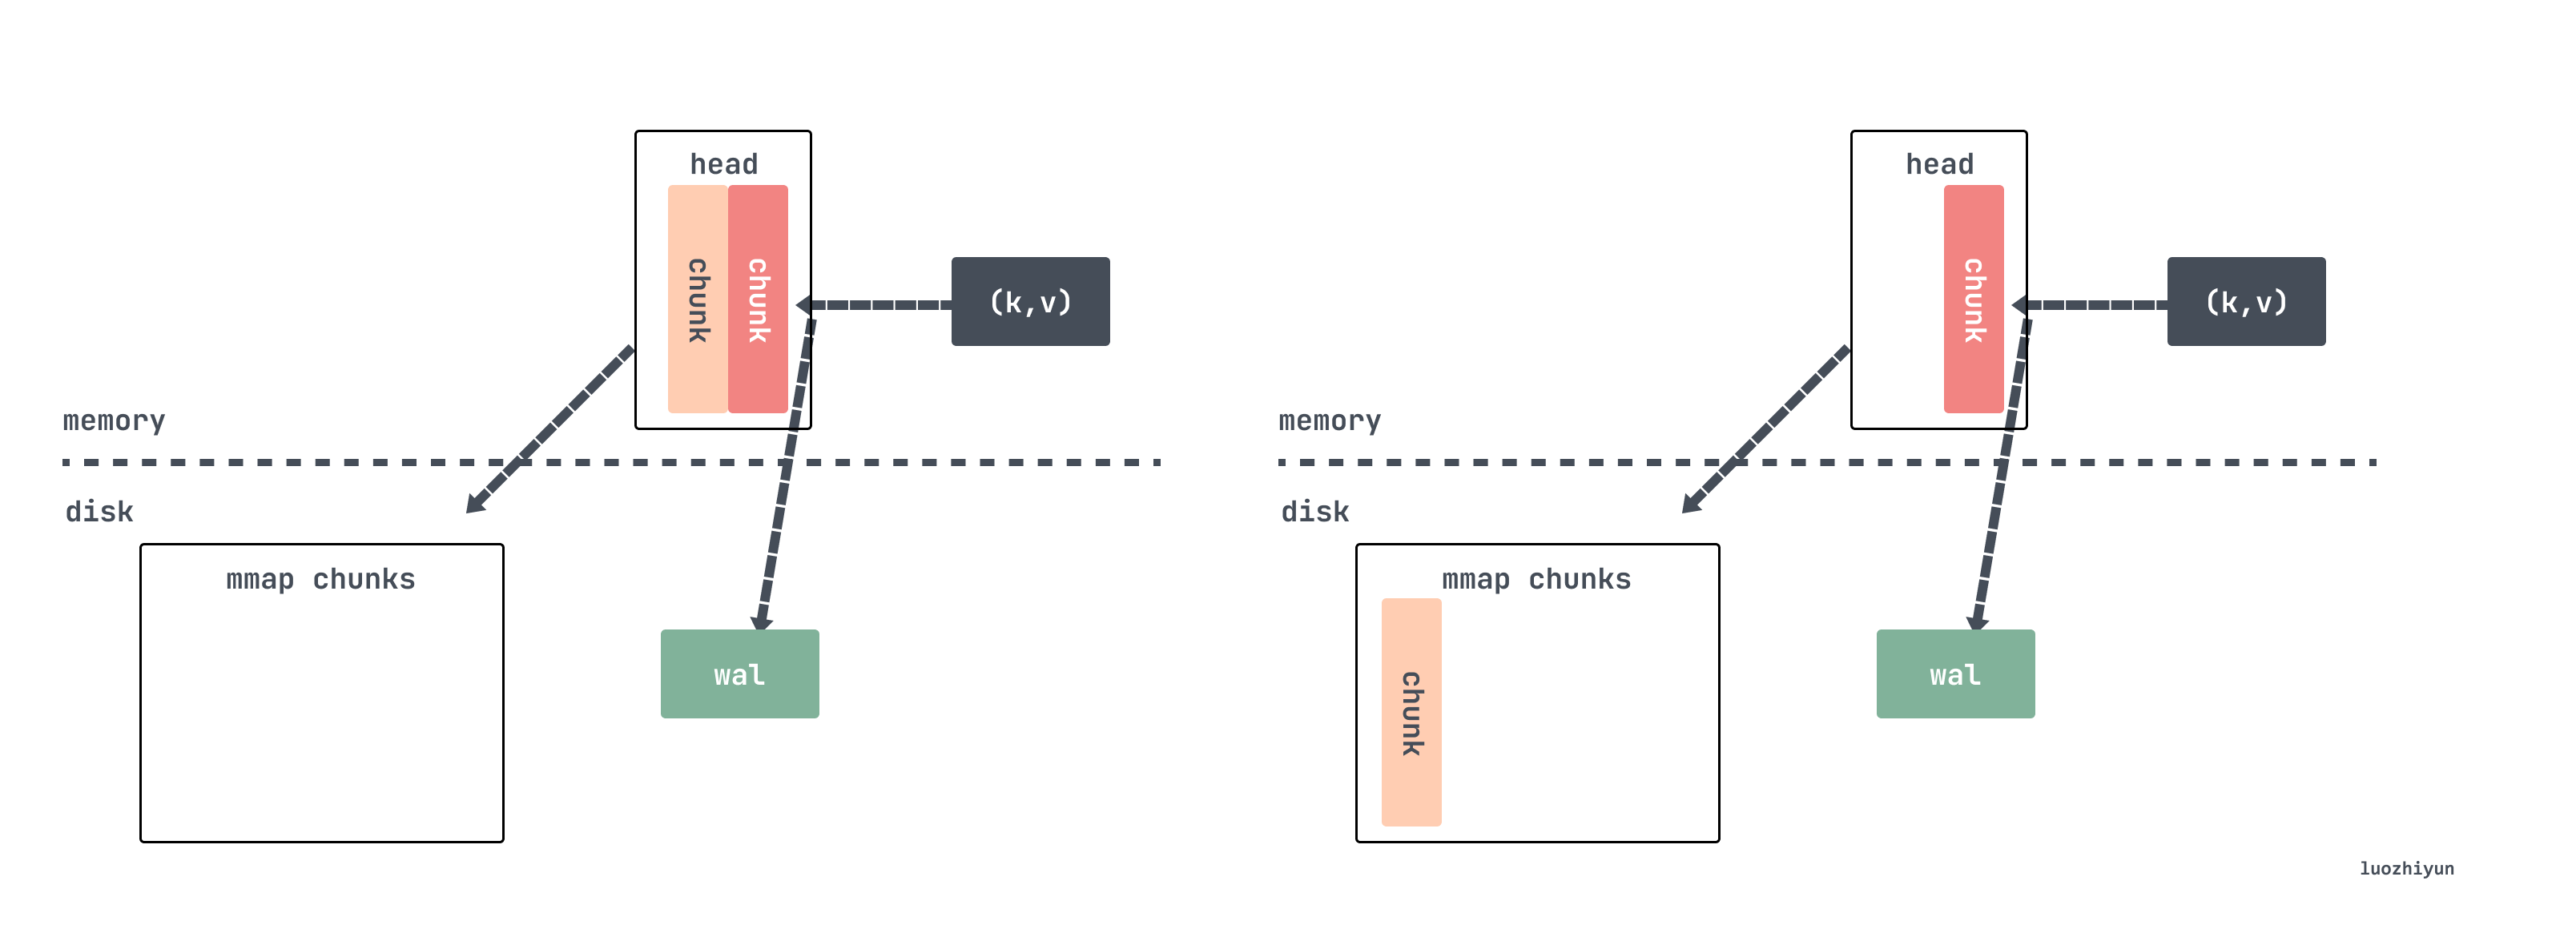
// tsdb/head_append.go func (s *memSeries) appendPreprocessor( t int64, e chunkenc.Encoding, chunkDiskMapper *chunks.ChunkDiskMapper, chunkRange int64, ) (c *memChunk, sampleInOrder, chunkCreated bool) { const samplesPerChunk = 120 c = s.head() if c == nil { // head chunk 里面还没有chunk ,那么先创建一个c = s.cutNewHeadChunk(t, e, chunkDiskMapper, chunkRange) chunkCreated = true } numSamples := c.chunk.NumSamples() if numSamples == 0 { c.minTime = t // chunkRange 默认是2hour,这里算的下次开始的时间是个以2为倍数的整数时间s.nextAt = rangeForTimestamp(c.minTime, chunkRange) } // 到1/4时,重新计算预估nextAt,下一个chunk的时间if numSamples == samplesPerChunk/4 { s.nextAt = computeChunkEndTime(c.minTime, c.maxTime, s.nextAt) } // 到达时间,或数据刷的太快,以至于chunk里面数据量已经超过240个samples,创建新的headChunk if t >= s.nextAt || numSamples >= samplesPerChunk*2 { c = s.cutNewHeadChunk(t, e, chunkDiskMapper, chunkRange) chunkCreated = true } return c, true, chunkCreated }
The above time calculation is very interesting. When writing the head chunk, it will check whether the number of writes has reached 1/4. If so, call the computeChunkEndTime function to calculate the average write rate based on 1/4 of the written data. Calculate About when the 120 samples will be written, and then return the time as the chunk cutting time
Here it is not cut by directly judging whether the number of writes reaches samplesPerChunk, but by time, which has a lot of room for flexibility. If the data is suddenly written slowly, the number of chunks will be cut if the number of samples is less than 120. If the number of samples in the chunk is too fast, the number of samples in the chunk will exceed 120, but not more than 2 times samplesPerChunk.
Of course, there is still a size limit when writing the head chunk, and the size is also 128M. Write for a file:
const MaxHeadChunkFileSize = 128 * 1024 * 1024 // 128 MiB. func (f *chunkPos) shouldCutNewFile(bytesToWrite uint64) bool { return f.offset == 0 || // First head chunk file. f.offset+bytesToWrite > MaxHeadChunkFileSize // Exceeds the max head chunk file size. }
If it is determined to cut the chunk, it will call the cutNewHeadChunk method to write the old data to the disk through mmap, and then create a new head chunk for memSeries, only retaining the reference to the old data.
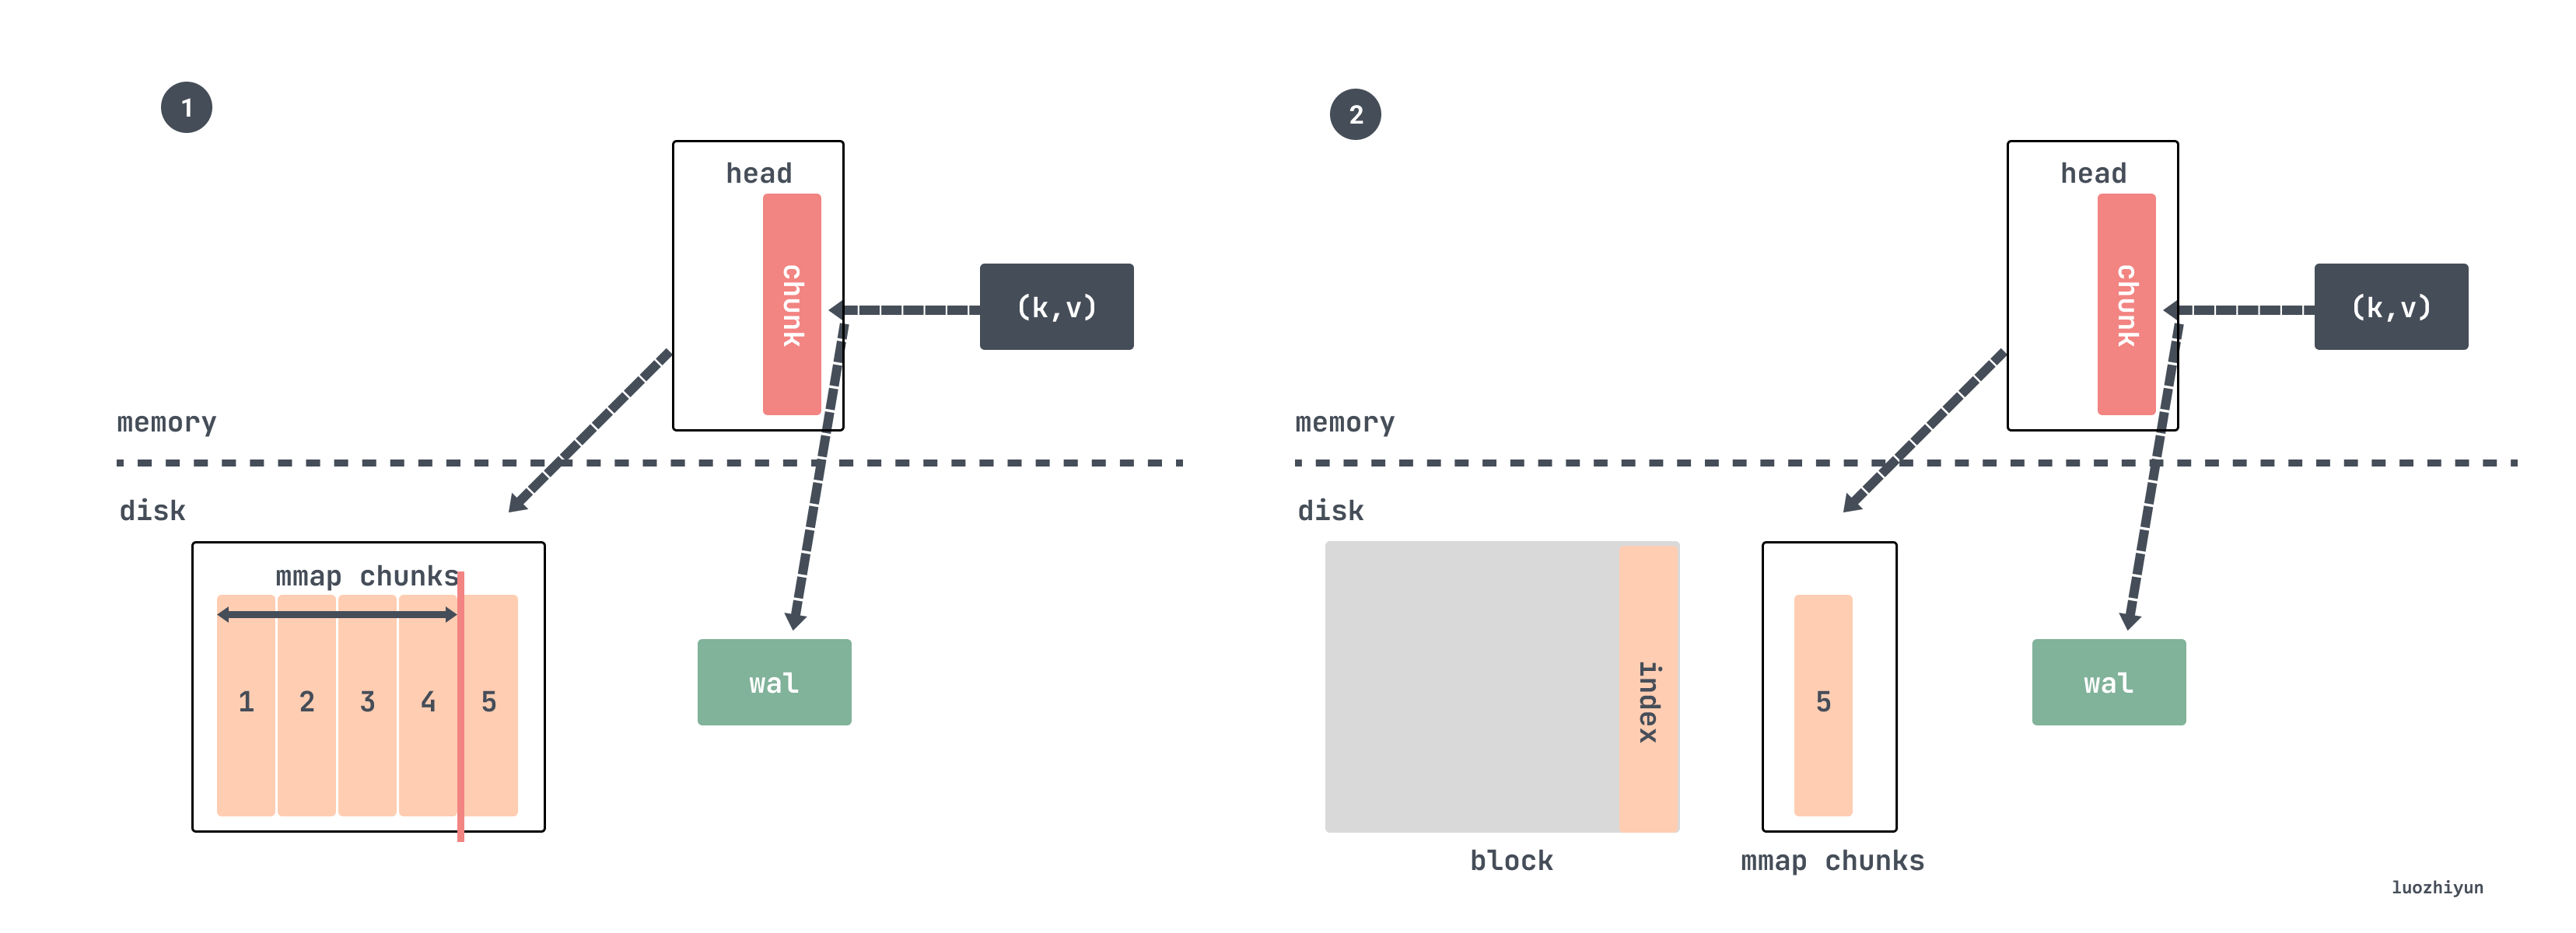
Now assuming that the data continues to be written, after a period of time, the chunk mapped by mmap will be compressed and persisted as a block.
When tsdb is initialized, it will run a goroutine in the background to check whether the chunkRange span of Chuan is larger than chunkRange*3/2 every minute:
//tsdb/db.go func (db *DB) run() { for { select { case <-time.After(1 * time.Minute): select { case db.compactc <- struct{}{}: default: } case <-db.compactc: // 校验是否进行压缩err := db.Compact() ... case <-db.stopc: return } } }
The Compact method will be verified by calling the compactable method:
func (h *Head) compactable() bool { return h.MaxTime()-h.MinTime() > h.chunkRange.Load()/2*3 }
The default value of chunkRange is DefaultBlockDuration is 2 hours:
DefaultBlockDuration = int64(2 * time.Hour / time.Millisecond)
That is to check whether the time span of the currently written data exceeds 3 hours, and if it exceeds, data compression will be performed. We assume that it is set to capture every 15s, and a chunk is filled with 120 samples, which is 30 minutes, so every 6 chunks will be compressed and a block will be generated every 3 hours.
Then when compressing, select the index data of the last 2 hours to compress, and the specific code is also relatively flattering. It obtains the minimum data time in the head and rounds up to 2 hours to obtain a time return:
//tsdb/db.go // 最小数据时间mint := db.head.MinTime() // 最大数据时间maxt := rangeForTimestamp(mint, db.head.chunkRange.Load()) func rangeForTimestamp(t, width int64) (maxt int64) { // width 为2小时return (t/width)*width + width }
So for our example above, it takes 30 minutes to fill a chunk, so compressing two hours of data is exactly 4 chunks.
According to the benchmark results of this New in Prometheus v2.19.0: Memory-mapping of full chunks of the head block reduces memory usage by as much as 40% article, removing part of the data in the head block and keeping only 120 samples saves about About 40% of the memory usage is reduced, and this part of the memory no longer needs to be reset from the WAL log after restarting, which also brings a faster startup speed.
wal
wal is a log sequence used to record some operations that occur in the database, each time before writing, modifying, or deleting, a record will be recorded in the wal log. The main function is to use this log data for recovery after the program hangs, because as we said earlier, the chunks in the head are not persistent.
wal is stored in the wal folder incrementally according to the serial number, and each file is called a segment with a default size of 128MB. Prometheus calls such a file a Segment, which stores a backup of the series and sample data in memory.
In addition, it also contains a subdirectory prefixed with checkpoint. Since the time series data in memory is often persisted, the data in wal will also be redundant. So every time the memory data is persisted, the Segment needs to be cleaned up. However, part of the data in the deleted segment may still be useful, so we will delete the data that is definitely invalid during cleaning, and the remaining data will be stored in the checkpoint. When Prometheus restarts, the content in the checkpoint should be loaded first, and then the content of each segment should be loaded sequentially.
The directory structure for the files on disk looks like this:
data └── wal ├── checkpoint.000003 | ├── 000000 | └── 000001 ├── 000004 └── 000005
During cleaning, 2/3 of the segments will be selected for deletion:
//tsdb/head.go // 获取磁盘的wal Segments 时间跨度范围first, last, err := wlog.Segments(h.wal.Dir()) // 重新调整被删除的结束时间,只删除2/3 的数据last = first + (last-first)*2/3
So let’s say there are 5 segments now:
data └── wal ├── 000000 ├── 000001 ├── 000002 ├── 000003 ├── 000004 └── 000005
Then 000000 000001 000002 000003 these files will be deleted. However, these records cannot be deleted directly. For example, series records are only written once, so they need to be found out. There are also some samples that do not need to be deleted at present, but need to be found out, and then checkpoint files are created and written.
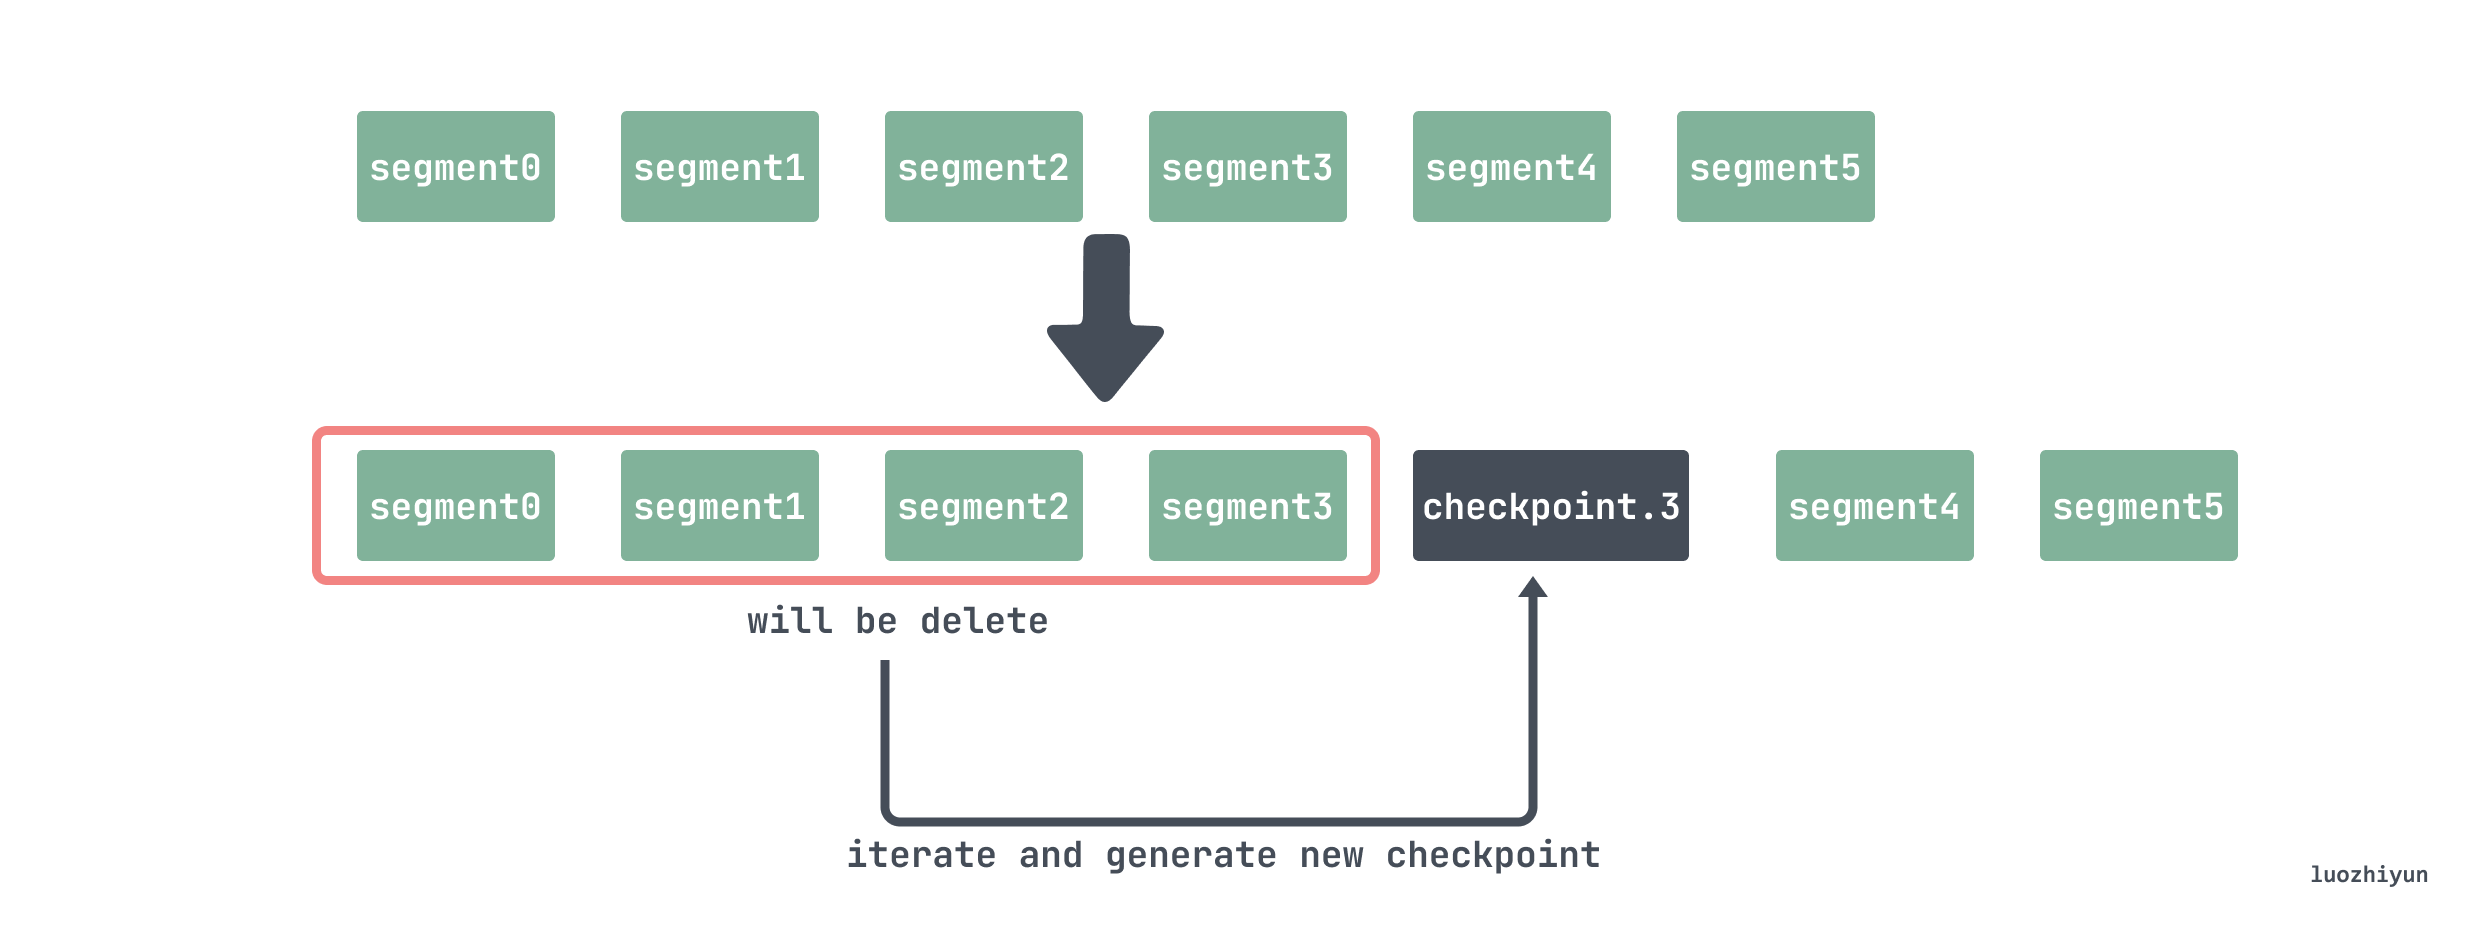
Therefore, when deleting, you need to traverse the files 000000 000001 000002 000003 and delete the series that are no longer used in the head; because when deleting a segment, a time T will be passed in, indicating that the data before this time point is all It has been persisted into a block, so wal does not need to be saved, so the data recorded in samples before time T needs to be deleted;
// tsdb/wlog/checkpoint.go func Checkpoint(logger log.Logger, w *WL, from, to int, keep func(id chunks.HeadSeriesRef) bool, mint int64) (*CheckpointStats, error) { ... var ( buf []byte recs [][]byte ) // segment reader r := NewReader(sgmReader) ... for r.Next() { // buf 起始位置start := len(buf) //读出数据rec := r.Record() switch dec.Type(rec) { case record.Series: series, err = dec.Series(rec, series) // Drop irrelevant series in place. repl := series[:0] for _, s := range series { // 校验该series 是否还存在在head 中if keep(s.Ref) { //保留repl = append(repl, s) } } if len(repl) > 0 { // 将要保留的数据写入到buffer 中buf = enc.Series(repl, buf) } stats.TotalSeries += len(series) stats.DroppedSeries += len(series) - len(repl) ... case record.Samples: samples, err = dec.Samples(rec, samples) repl := samples[:0] for _, s := range samples { // 校验该sample的时间是否在mint之后if sT >= mint { //之后的数据需要保留repl = append(repl, s) } } if len(repl) > 0 {// 将要保留的数据写入到buffer 中buf = enc.Samples(repl, buf) } stats.TotalSamples += len(samples) stats.DroppedSamples += len(samples) - len(repl) ... // 将buf数据写入到recs中recs = append(recs, buf[start:]) // 如果buf 中的数据已经超过1M,需要将数据写入到checkpoint中if len(buf) > 1*1024*1024 { if err := cp.Log(recs...); err != nil { return nil, errors.Wrap(err, "flush records") } buf, recs = buf[:0], recs[:0] } } // 遍历完之后将残余数据checkpoint中if err := cp.Log(recs...); err != nil { return nil, errors.Wrap(err, "flush records") } }
block
Each block is actually a small database that internally stores all time series data within the time window, so it needs to have its own index and chunks. Except for the latest block, which is receiving fresh data, all other blocks are immutable.
All data within a time period (default 2 hours), read-only, named with ULID . Each block mainly includes:
./data ├── 01BKGTZQ1SYQJTR4PB43C8PD98 │ ├── chunks │ │ └── 000001 │ ├── tombstones │ ├── index │ └── meta.json
- meta.json meta information, mainly including the minTime/maxTime of the block, which is convenient for filtering during query;
- chunks is a subdirectory that contains several files numbered starting from 000001. Generally, the upper limit of each file size is 512M. All samples stored in the file are within the time window [minTime, maxTime];
- tombstones are used to store delete records for series. If a time series is deleted, Prometheus will not clean it up immediately, but will make a record in tombstones, and wait until the next block compression and merge to clean up;
- index Index file, mainly contains the information of the inverted index;
index data lookup
Let’s now look at the overall data structure of index:
┌────────────────────────────┬─────────────────────┐ │ magic(0xBAAAD700) <4b> │ version(1) <1 byte> │ ├────────────────────────────┴─────────────────────┤ │ ┌──────────────────────────────────────────────┐ │ │ │ Symbol Table │ │ │ ├──────────────────────────────────────────────┤ │ │ │ Series │ │ │ ├──────────────────────────────────────────────┤ │ │ │ Label Index 1 │ │ │ ├──────────────────────────────────────────────┤ │ │ │ ... │ │ │ ├──────────────────────────────────────────────┤ │ │ │ Label Index N │ │ │ ├──────────────────────────────────────────────┤ │ │ │ Postings 1 │ │ │ ├──────────────────────────────────────────────┤ │ │ │ ... │ │ │ ├──────────────────────────────────────────────┤ │ │ │ Postings N │ │ │ ├──────────────────────────────────────────────┤ │ │ │ Label Index Table │ │ │ ├──────────────────────────────────────────────┤ │ │ │ Postings Table │ │ │ ├──────────────────────────────────────────────┤ │ │ │ TOC │ │ │ └──────────────────────────────────────────────┘ │ └──────────────────────────────────────────────────┘
Here we introduce some structures related to data query, and the rest of the details can be found here: index .
The first is TOC (Table Of Content), which stores the position information of the remaining six parts, that is, the offsets of their starting positions in the index file. The structure is as follows:
┌─────────────────────────────────────────┐ │ ref(symbols) <8b> │ ├─────────────────────────────────────────┤ │ ref(series) <8b> │ ├─────────────────────────────────────────┤ │ ref(label indices start) <8b> │ ├─────────────────────────────────────────┤ │ ref(label offset table) <8b> │ ├─────────────────────────────────────────┤ │ ref(postings start) <8b> │ ├─────────────────────────────────────────┤ │ ref(postings offset table) <8b> │ ├─────────────────────────────────────────┤ │ CRC32 <4b> │ └─────────────────────────────────────────┘
If we want to find the position of an index in the chunk, we can first use the above offsets to find the inverted index. Because prometheus stores a lot of key/value data, an inverted index is built in the index for quick search, and the data is stored in Posting offset table and Posting.
The inverted index is organized as follows:
- First assign an id to each series, and use the seriesId to query the series, which is a forward index, and the query time complexity = O(1);
- Construct the index of label, if
seriesId={2,5,10,29}all containlabel: app='nginx', then, forapp='nginx",{2,5,10,29}is its inversion index;
In this way, the corresponding seriesId can be quickly found.
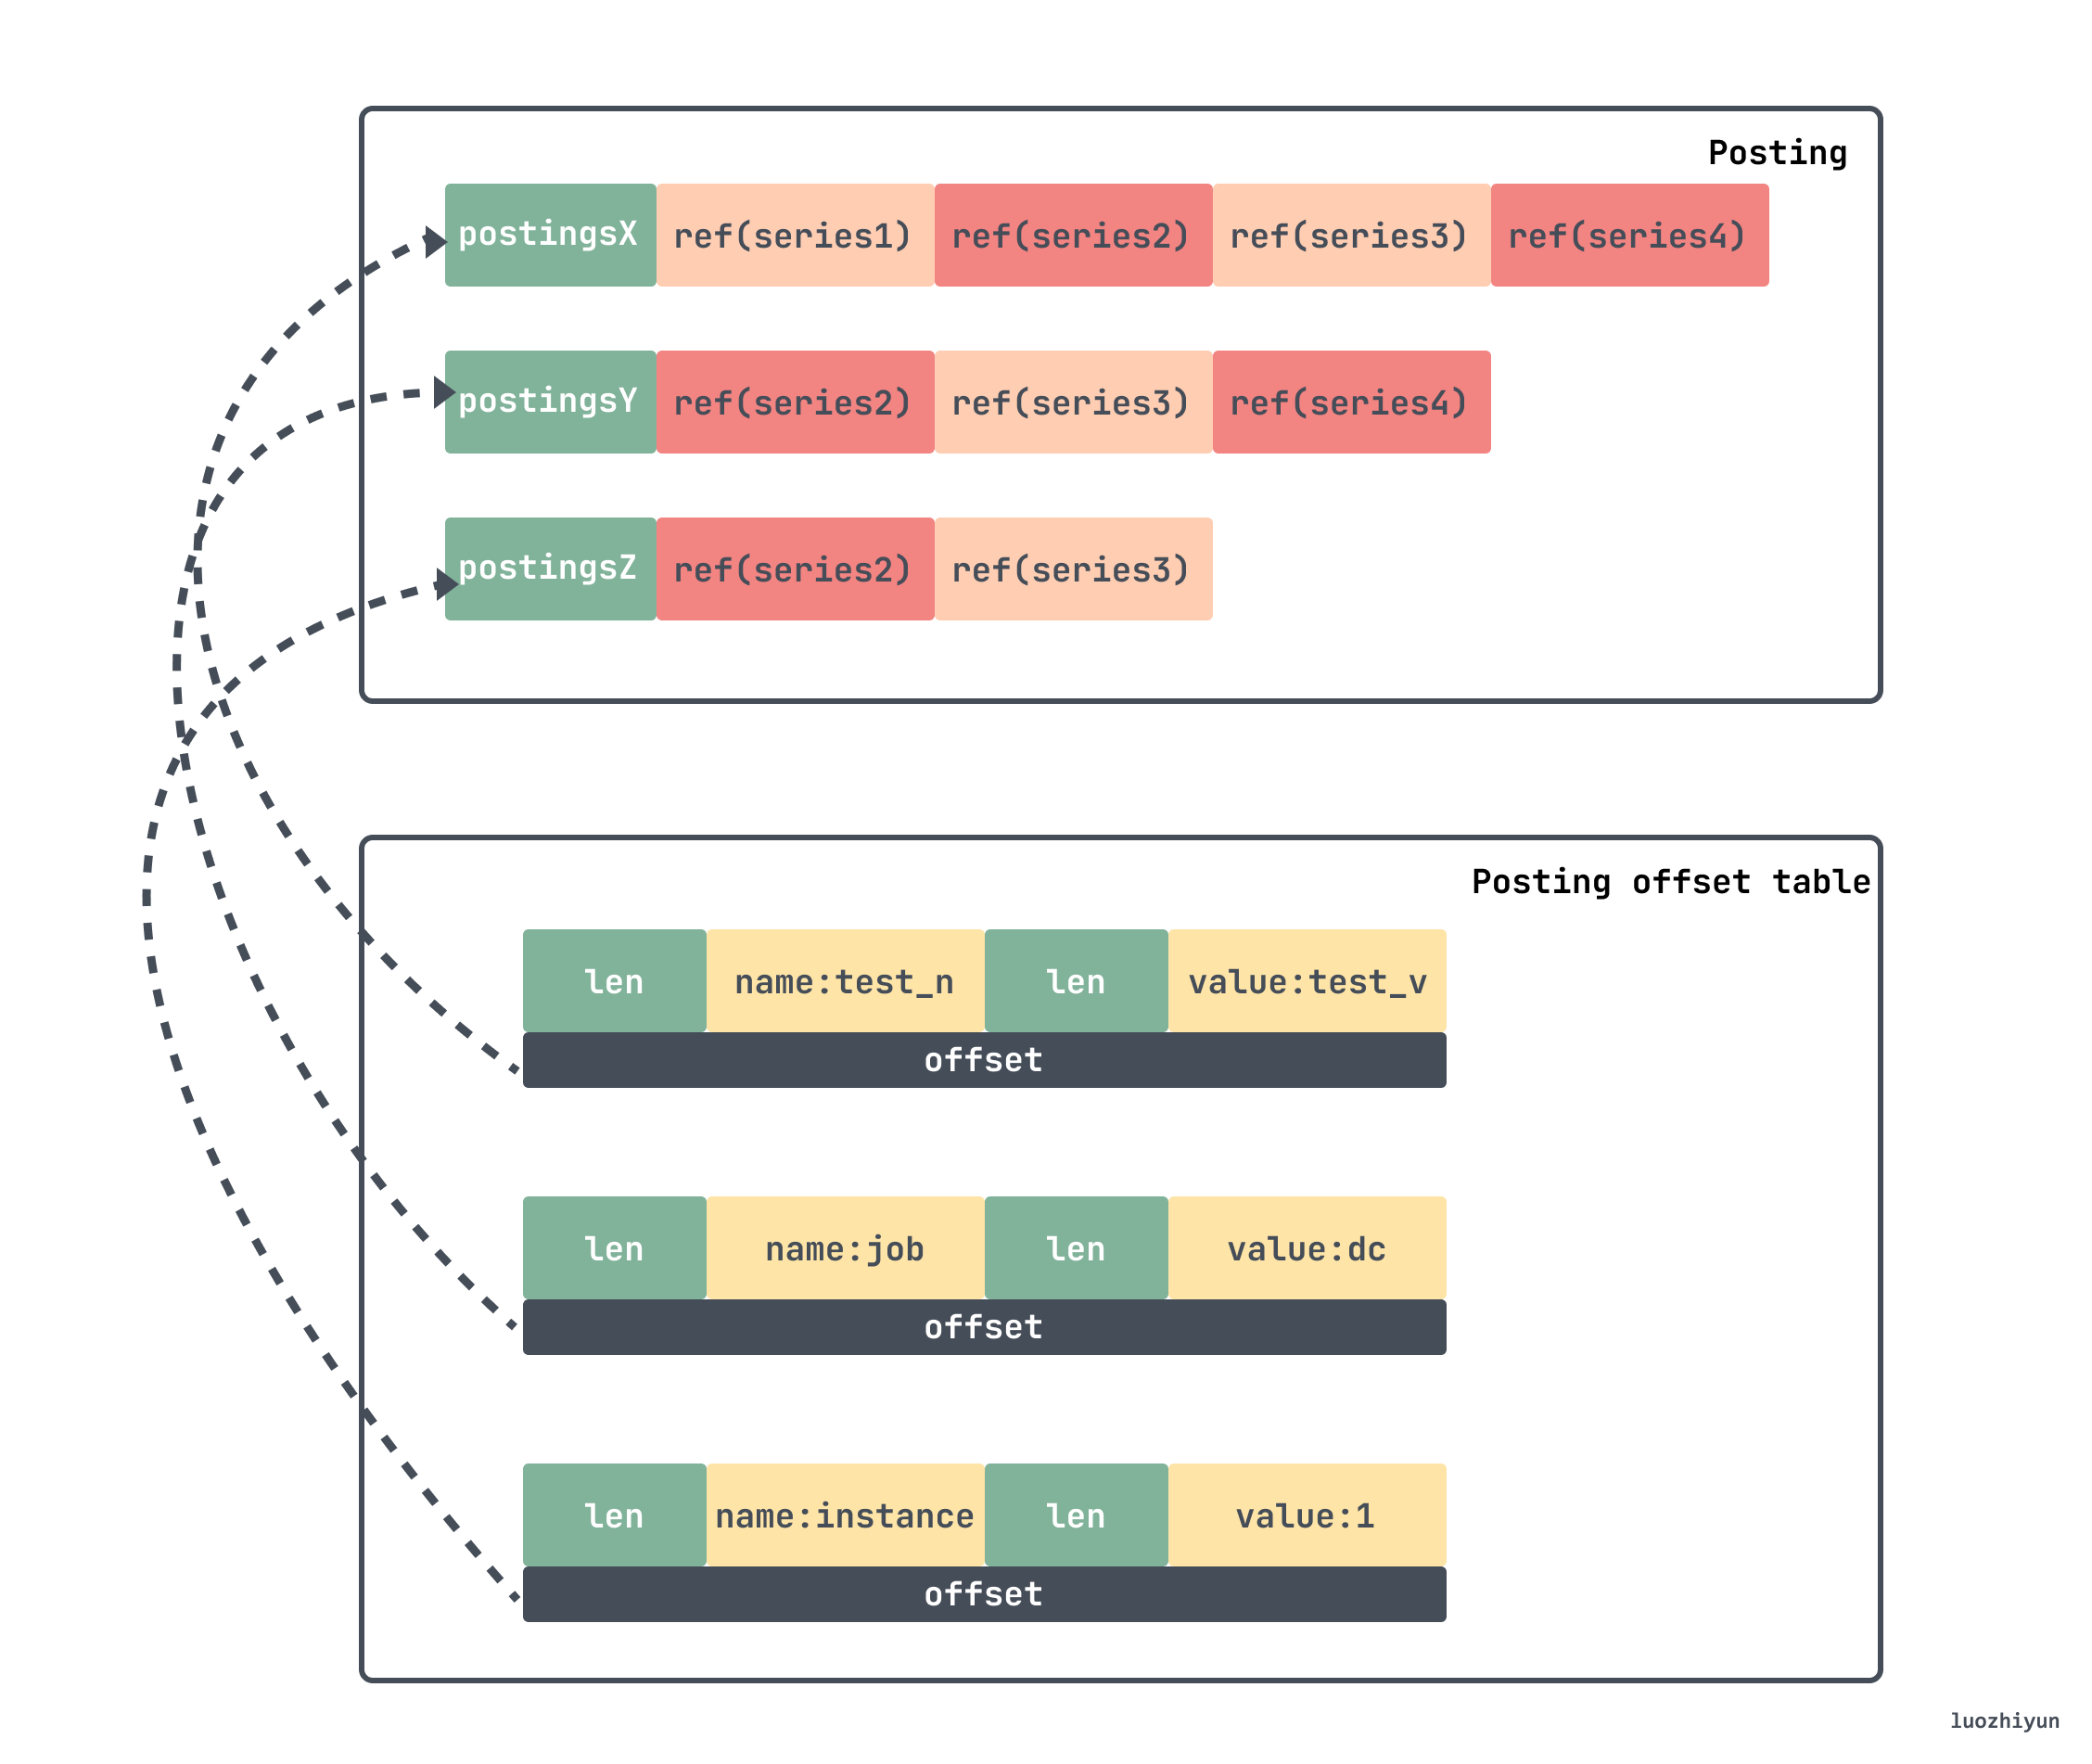
If we want to find the series corresponding to the above lable, then we need to find the corresponding offset in the Posting offset table first, this offset is the offset of Posting, go to it to find the corresponding entry, and then get the corresponding seriesId. Then the final seriesId list obtained in our above example is {Series2,Series3} .
After finding the corresponding seriesId, go to the series section of the index to find the corresponding chunk information. The key/value information of each label of the series is first stored in the series segment. Then store the chunks information related to the series, including the time window of each chunk, and the specific location information of the chunk in the chunks subdirectory, and then access the chunk file to find the final original data.
┌──────────────────────────────────────────────────────────────────────────┐ │ len <uvarint> │ ├──────────────────────────────────────────────────────────────────────────┤ │ ┌──────────────────────────────────────────────────────────────────────┐ │ │ │ labels count <uvarint64> //lable数量│ │ │ ├──────────────────────────────────────────────────────────────────────┤ │ │ │ lable列表┌────────────────────────────────────────────┐ │ │ │ │ │ ref(l_i.name) <uvarint32> //label名│ │ │ │ │ ├────────────────────────────────────────────┤ │ │ │ │ │ ref(l_i.value) <uvarint32> //label值│ │ │ │ │ └────────────────────────────────────────────┘ │ │ │ │ ... │ │ │ ├──────────────────────────────────────────────────────────────────────┤ │ │ │ chunks count <uvarint64> //chunk数量│ │ │ ├──────────────────────────────────────────────────────────────────────┤ │ │ │ chunk列表┌────────────────────────────────────────────┐ │ │ │ │ │ c_0.mint <varint64> │ │ │ │ │ ├────────────────────────────────────────────┤ │ │ │ │ │ c_0.maxt - c_0.mint <uvarint64> │ │ │ │ │ ├────────────────────────────────────────────┤ │ │ │ │ │ ref(c_0.data) <uvarint64> │ │ │ │ │ └────────────────────────────────────────────┘ │ │ │ │ ┌────────────────────────────────────────────┐ │ │ │ │ │ c_i.mint - c_i-1.maxt <uvarint64> │ │ │ │ │ ├────────────────────────────────────────────┤ │ │ │ │ │ c_i.maxt - c_i.mint <uvarint64> │ │ │ │ │ ├────────────────────────────────────────────┤ │ │ │ │ │ ref(c_i.data) - ref(c_i-1.data) <varint64> │ │ │ │ │ └────────────────────────────────────────────┘ │ │ │ │ ... │ │ │ └──────────────────────────────────────────────────────────────────────┘ │ ├──────────────────────────────────────────────────────────────────────────┤ │ CRC32 <4b> │ └──────────────────────────────────────────────────────────────────────────┘
Summarize
In fact, after reading the whole article, we can clearly understand that the idea of writing Prometheus data is actually very clear. Because tsdb data has its own characteristics, it is based on a series of indicator monitoring data continuously generated at a relatively stable frequency, so the storage is some tag keys plus a time series as a large key, and the value is a number, and these data constitute a time Sequence data, so the key-value database can naturally be used as the carrier of time series data.
Then, for data storage, Prometheus separates hot and cold data. The most recent data must be viewed the most, so it is cached in memory. In order to prevent data loss caused by downtime, wal is introduced for fault recovery. After the data exceeds a certain amount, it will be stripped from the memory and stored on the disk in the form of chunks. This is the head chunk. For earlier data, it will be compressed and persisted into blocks and stored on disk.
Since the data in the block will not change, the data is relatively fixed, so each block indexes the data in it through the index, and in order to speed up the query of the data, the inverted index is used to quickly locate the corresponding chunk.
Reference
https://tech.ipalfish.com/blog/2020/03/31/the-evolution-of-prometheus-storage-layer/
https://github.com/prometheus/prometheus/blob/main/tsdb/docs/format/index.md
https://liujiacai.net/blog/2021/04/11/prometheus-storage-engine/
Be smarter in how we look at matchers https://github.com/prometheus-junkyard/tsdb/pull/572
Prometheus TSDB (Part 1): The Head Block https://ganeshvernekar.com/blog/prometheus-tsdb-the-head-block/
https://prometheus.kpingfan.com/
Index Disk Format https://github.com/prometheus/prometheus/blob/main/tsdb/docs/format/index.md
https://yunlzheng.gitbook.io/prometheus-book/
TSDB format https://github.com/prometheus/prometheus/blob/release-2.40/tsdb/docs/format/README.md
https://prometheus.io/docs/prometheus/latest/storage/
https://grafana.com/blog/2022/09/07/new-in-grafana-mimir-introducing-out-of-order-sample-ingestion/
https://github.com/prometheus/prometheus/blob/release-2.40/tsdb/docs/refs.md
Persistent Block and its Index https://ganeshvernekar.com/blog/prometheus-tsdb-persistent-block-and-its-index
head block https://segmentfault.com/a/1190000041199554
New in Grafana Mimir: Introducing out-of-order sample ingestion https://grafana.com/blog/2022/09/07/new-in-grafana-mimir-introducing-out-of-order-sample-ingestion/? mdm=social
https://segmentfault.com/a/1190000041117609
https://heapdump.cn/article/2282672

The things about Prometheus data storage first appeared on luozhiyun`s Blog .
This article is transferred from: https://www.luozhiyun.com/archives/725
This site is only for collection, and the copyright belongs to the original author.