1. Gold: from base currency to “spare tire” currency
Currency is the medium used by humans for material exchange, and precious metals such as gold are physical currencies that have been used for thousands of years. However, when human society entered the era of industrialization, GDP and the accompanying demand for goods transactions increased exponentially, while the limited output and non-portable properties of precious metals could not meet the needs of economic development, for example, it would cause deflation from time to time. When human beings develop into a credit society, the function of gold and other precious metals as the basic currency will completely withdraw from the historical stage ![]() ). Since then, precious metals such as gold have existed as substitutes for modern currencies. The modern currency system is mainly based on credit. When this credit is impacted, precious metals such as gold have opportunities as currency substitutes. Similar commodities include Bitcoin, which has become more popular in recent years.
). Since then, precious metals such as gold have existed as substitutes for modern currencies. The modern currency system is mainly based on credit. When this credit is impacted, precious metals such as gold have opportunities as currency substitutes. Similar commodities include Bitcoin, which has become more popular in recent years.
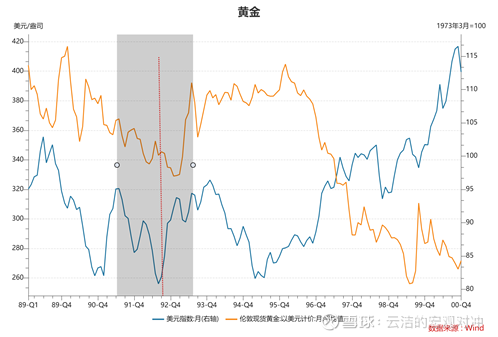
So who replaced gold as the global base currency? A long time ago, it was the British pound. After World War I, due to the decline of British national strength, the U.S. dollar replaced the British pound as the dominant base currency in the world, and thus became the biggest competitor of gold. Take the sterling crisis in September 1992 as an example. In 1978, Europe established a very unreliable “European Monetary System” in order to counter the US dollar. In 1990, the economic crisis broke out in Western countries (the gray part in the figure below), and international hot money began to attack the pound. Roth’s famous work). On September 16, 1992 (the red line in the figure below), the United Kingdom announced its withdrawal from the currency system, the pound depreciated sharply, and the dollar and gold rose sharply. This is a classic case of a dispute over the status of the base currency.
2. Gold driving force: risk aversion and inflation
As mentioned above, the modern economy is a credit society, and credit will generate interest. For an investor, the opportunity cost of holding gold depends not only on the rise and fall of the US dollar, but also on the trend of the risk-free interest rate of the US dollar (the storage cost of gold itself neglect). Therefore, when gold is used as a currency substitute, the first thing to look at is the trend of the U.S. dollar index, and the other is to look at the trend of the ten-year U.S. bond yield. We collectively refer to it as the dollar value (dollar index + U.S. bond interest rate). As shown in the figure below, selecting the data from 1971 to November this year, the correlation between the London gold price and the U.S. dollar index is -38%, and the correlation with the 10-year U.S. bond yield is -68%.
The logic of the above-mentioned currency substitution corresponds to the actual role of gold in a special environment, which is reflected in two functions: hedging and anti-inflation.
——Hedging means that when a crisis breaks out, the confidence in the US dollar-based global credit system will be shaken, and funds will sell risky assets and flood into risk-free assets (U.S. debt, gold, etc.) to hedge. This will drive down U.S. bond yields and push up gold prices. For example, the subprime mortgage crisis in 2008-09, the European debt crisis in 2010-2012, the new crown epidemic in 2020 and the conflict between Russia and Ukraine at the beginning of this year.
— Anti-inflation is the job of gold . The Fed’s “flooding” will naturally shake the confidence of the US dollar, which is reflected in lowering the US dollar index and US bond interest rates, thereby pushing up the price of gold. For example, the Fed’s “big release” from 2009 to 2012, and the second “big release” of the Fed in 2020.
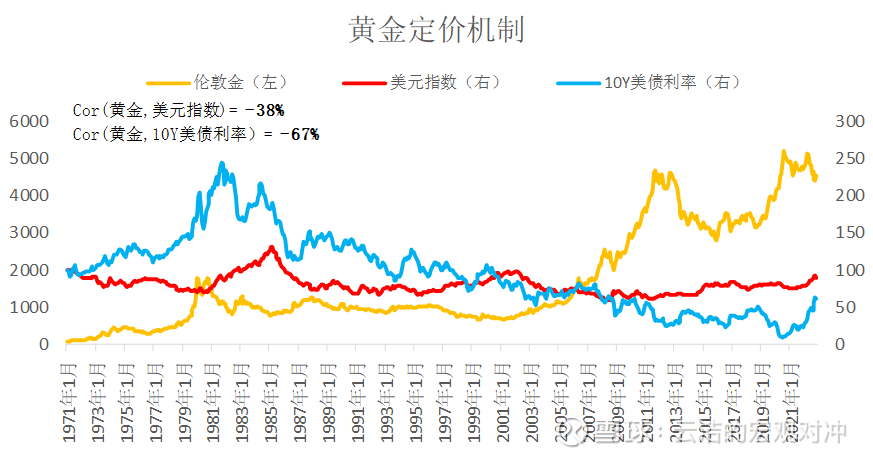
Data source: Bloomberg Note: The above data are all normalized to 100 in January 1971
3. Prospects for the future gold price: grasp the allocation opportunity
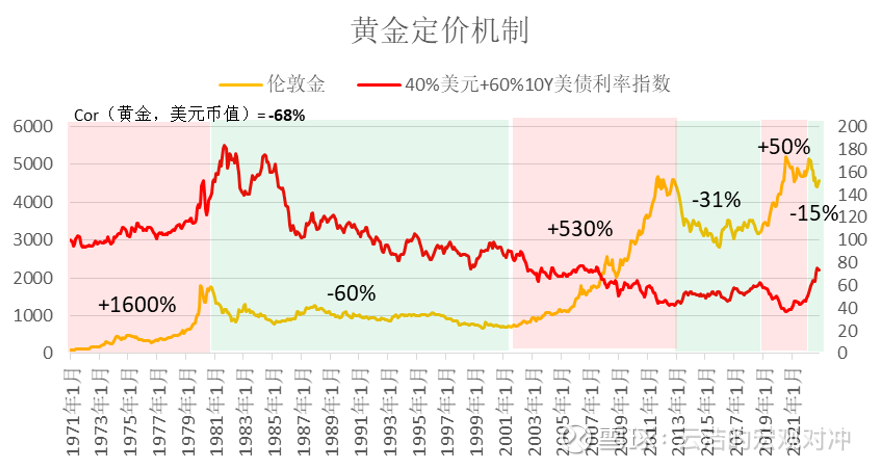
In the previous analysis, the price of gold is mainly negatively correlated with the U.S. dollar index and U.S. bond interest rates. For this reason, we use 40% U.S. dollar index + 60% U.S. bond yield to construct a “dollar currency value” indicator to measure the purchasing power of the U.S. dollar relative to gold. As can be seen from the figure below, the correlation between the gold price and the full sample of this indicator The gold bull market over the years is driven by the above two driving factors in turn, but the focus of each stage is different.
Data source: Bloomberg
Since 1972 when the U.S. dollar was pegged to gold, the gold market has experienced two rounds of bull markets.
In the first round, inflation dominated in the 1970s. Gold mainly depends on the U.S. dollar index, and gold rose by 1600%.
Gold entered its first 10-year bull market in 1972 as the U.S. de-pegged the U.S. dollar from gold. From the 1970s to the early 1980s, the United States struggled with inflation. Especially after 1974, inflation gradually became out of control. High inflation has laid a good foundation for the gold bull market. Gold has risen about 16 times in 10 years.
In the 1980s and 1990s, Volcker, then chairman of the Federal Reserve, raised interest rates sharply to end the repeated stagflation in the United States in the 1970s. In the 1990s, the United States experienced a technological revolution, and the credit of the US dollar was greatly restored. In the past two decades, the US dollar index And the interest rate of U.S. bonds was very strong as a whole. During this period, gold continued to fall as a whole. There was only a medium-term rebound opportunity in 1985-1988 (caused by the Fed’s interest rate cut).
In the second round, the crisis of the 21st century dominated. Gold mainly depends on the interest rate of U.S. debt, and gold rose 530%.
Since 2002, with the slowdown of economic stimulus from the American technological revolution in the 1990s and the outbreak of multiple financial crises, gold ushered in the second round of a 10-year bull market. After 2000, the U.S. trade deficit and financial project deficit increased rapidly at the same time. In the same period, the Federal Reserve’s policy was relatively loose from 2002 to 2005 in order to stimulate employment, and the dollar depreciated.
After the outbreak of the subprime mortgage crisis in 2007, the Federal Reserve carried out unprecedented interest rate cuts and quantitative easing in order to quell the crisis and stimulate the economy to recover at a faster speed. After the outbreak of the subprime mortgage crisis in 2008, the Federal Reserve’s substantial expansion of assets caused gold to be hyped under the two major expectations of hedging and fighting inflation. From the end of 2008 to September 2011, it rose 2.6 times in three years. From 2002 to 2011, the maximum increase of gold was about 5.3 times.
During the halftime period from 2011 to 2018, gold fell 31%. From 2007 to 2011, the crisis of gold speculation was over and inflation was speculated, and a considerable bubble was accumulated. When the economy fully recovers and the central bank begins to tighten, which pushes up the U.S. bond interest rate and the U.S. dollar index successively, gold enters a 7-year rest period.
Gold rose by 50% from 2018 to March 2022. In December 2018, the Federal Reserve unexpectedly turned dovish, superimposed on the new crown epidemic in 2020, the global central bank’s joint release of water, and the conflict between Russia and Ukraine in early 2022. Gold regained its upward trend and rose by 50% .
During the halftime period from March 2022 to October 2022, gold fell 15%. In the past two years, the Federal Reserve has released a lot of water. In order to recover the huge amount of liquidity released during the epidemic, the Federal Reserve has started an unprecedented tightening cycle. Since March, it has raised interest rates 6 times in a row, with a cumulative increase of 375BP, and the interest rate level is close to the end of 2007. Aggressive tightening has pushed up the dollar and U.S. bond yields. Since the lowest point in August 2020, the U.S. dollar index has risen by 27.7% in the past two years, and U.S. bond yields have soared by 373BP. According to the previous pricing mechanism, the decline of gold is very reasonable.
From the above review of the big historical cycle of gold, we can find that the big bull market of gold in the 1970s originated from high inflation and relied on the depreciation of the US dollar. The bull market in the first two decades of the 21st century originated from repeated crises, during which the U.S. dollar and U.S. bond interest rates took turns to influence the price of gold. The 20-year bear market in gold in the 1980s and 1990s originated from a radical Federal Reserve and a strong U.S. economy. From a long-term perspective, we believe that the global politics and economy will face more uncertainties in the next ten years, so gold has a higher allocation value. Also, watch for signs of marginal faltering in the dollar’s dominance as the base currency (below).
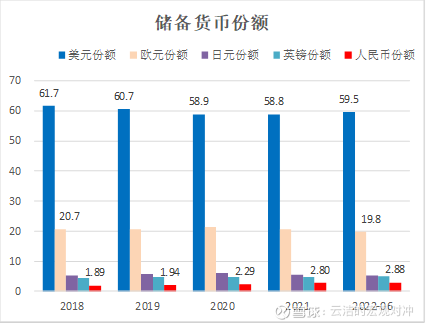
Data source: IMF
4. Prospects for future gold prices: opportunities on the right may have appeared
Judging from the U.S. dollar index and U.S. bond yields, we believe that these two indicators may have peaked, and the opportunity on the right side of gold allocation has now appeared.
First of all, our previous report ” Is the Chairman of the Federal Reserve Really the Eagle King?” As analyzed in “, the apex of this round of Fed “hawks” may have passed with the end of the US mid-term elections.
On November 2, the Federal Reserve raised interest rates by 75bp as scheduled, but added to the monetary policy statement that “when determining the rate of interest rate hikes in the future target range, the committee will consider the lagged impact of monetary policy on economic activities and inflation…”, although The statement after the meeting emphasized that “it is still too early to consider stopping interest rate hikes, and the end point of interest rates will be higher than previously expected”-on the whole, it continued this year’s attitude of “fighting inflation at all costs”. However, the FOMC statement left a hole for the slowdown of interest rate hikes. In the context of the current market’s expectations for interest rate hikes to be above 5%-5.25%, any inflation or economic data that is lower than expected will be greatly eased. market concerns.
On December 1, Federal Reserve Chairman Powell unexpectedly released a dovish signal in his speech, which triggered a sharp rise in U.S. stocks that day, and a sharp drop in U.S. bond yields and the U.S. dollar index.
On December 2, the US core PCE index fell as scheduled. If the U.S. stock market’s November non-agricultural employment data slows down again tonight, the market’s Fed tightening curve may move further down. Both gold and emerging markets may bring very good trending market conditions.
In our experience, markets trade poor expectations for things that can be fully expected. That is, even if the Fed is still raising interest rates, the marginal release of a dovish signal will be regarded by the market as the beginning of the “retreat” of the tightening policy. The US dollar index will really confirm the inflection point.
So next, just observe the following indicators:
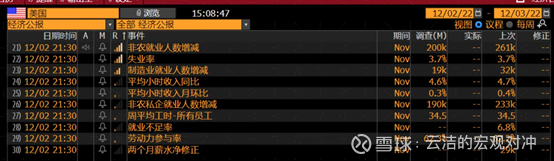
1. The worse the US economic data, the better. During this period, there may be trading opportunities for gold and emerging market stocks. Focus on tonight’s non-agricultural employment data (see chart below), lower than expected is positive.
2. In the early morning of December 14, the Federal Reserve’s interest rate hike statement and press conference speech. If the dove, the top of the dollar is really confirmed. Emerging markets, gold, trending opportunities are here.
Data source: Bloomberg
over
$Shanghai Gold ETF(SZ159830)$ $Celestica Vietnam Market Stock C(F008764)$ $Celestica Securities Hong Kong Stock Connect 50 Index C(F012990)$
The above views are for reference only and do not constitute investment advice. The market is risky, and investment needs to be cautious. Before buying a fund, please carefully read the fund contract and other legal documents, and choose a product that suits your risk tolerance. Index funds suffer from tracking error.
There are 3 discussions on this topic in Xueqiu, click to view.
Snowball is an investor social network where smart investors are all here.
Click to download Xueqiu mobile client http://xueqiu.com/xz ]]>
This article is transferred from: http://xueqiu.com/3621716791/236898730
This site is only for collection, and the copyright belongs to the original author.