Original link: https://blog.forecho.com/stock-indicators-boll.html
introduction
Bollinger Bands (BOLL) is a concept proposed by the American economist John Bollinger (John Bollinger) combining the moving average and statistical standard deviation. This indicator can help investors understand the relative highs and lows of prices and the volatility of prices, so as to make more informed investment decisions.
What is Bollinger Bands
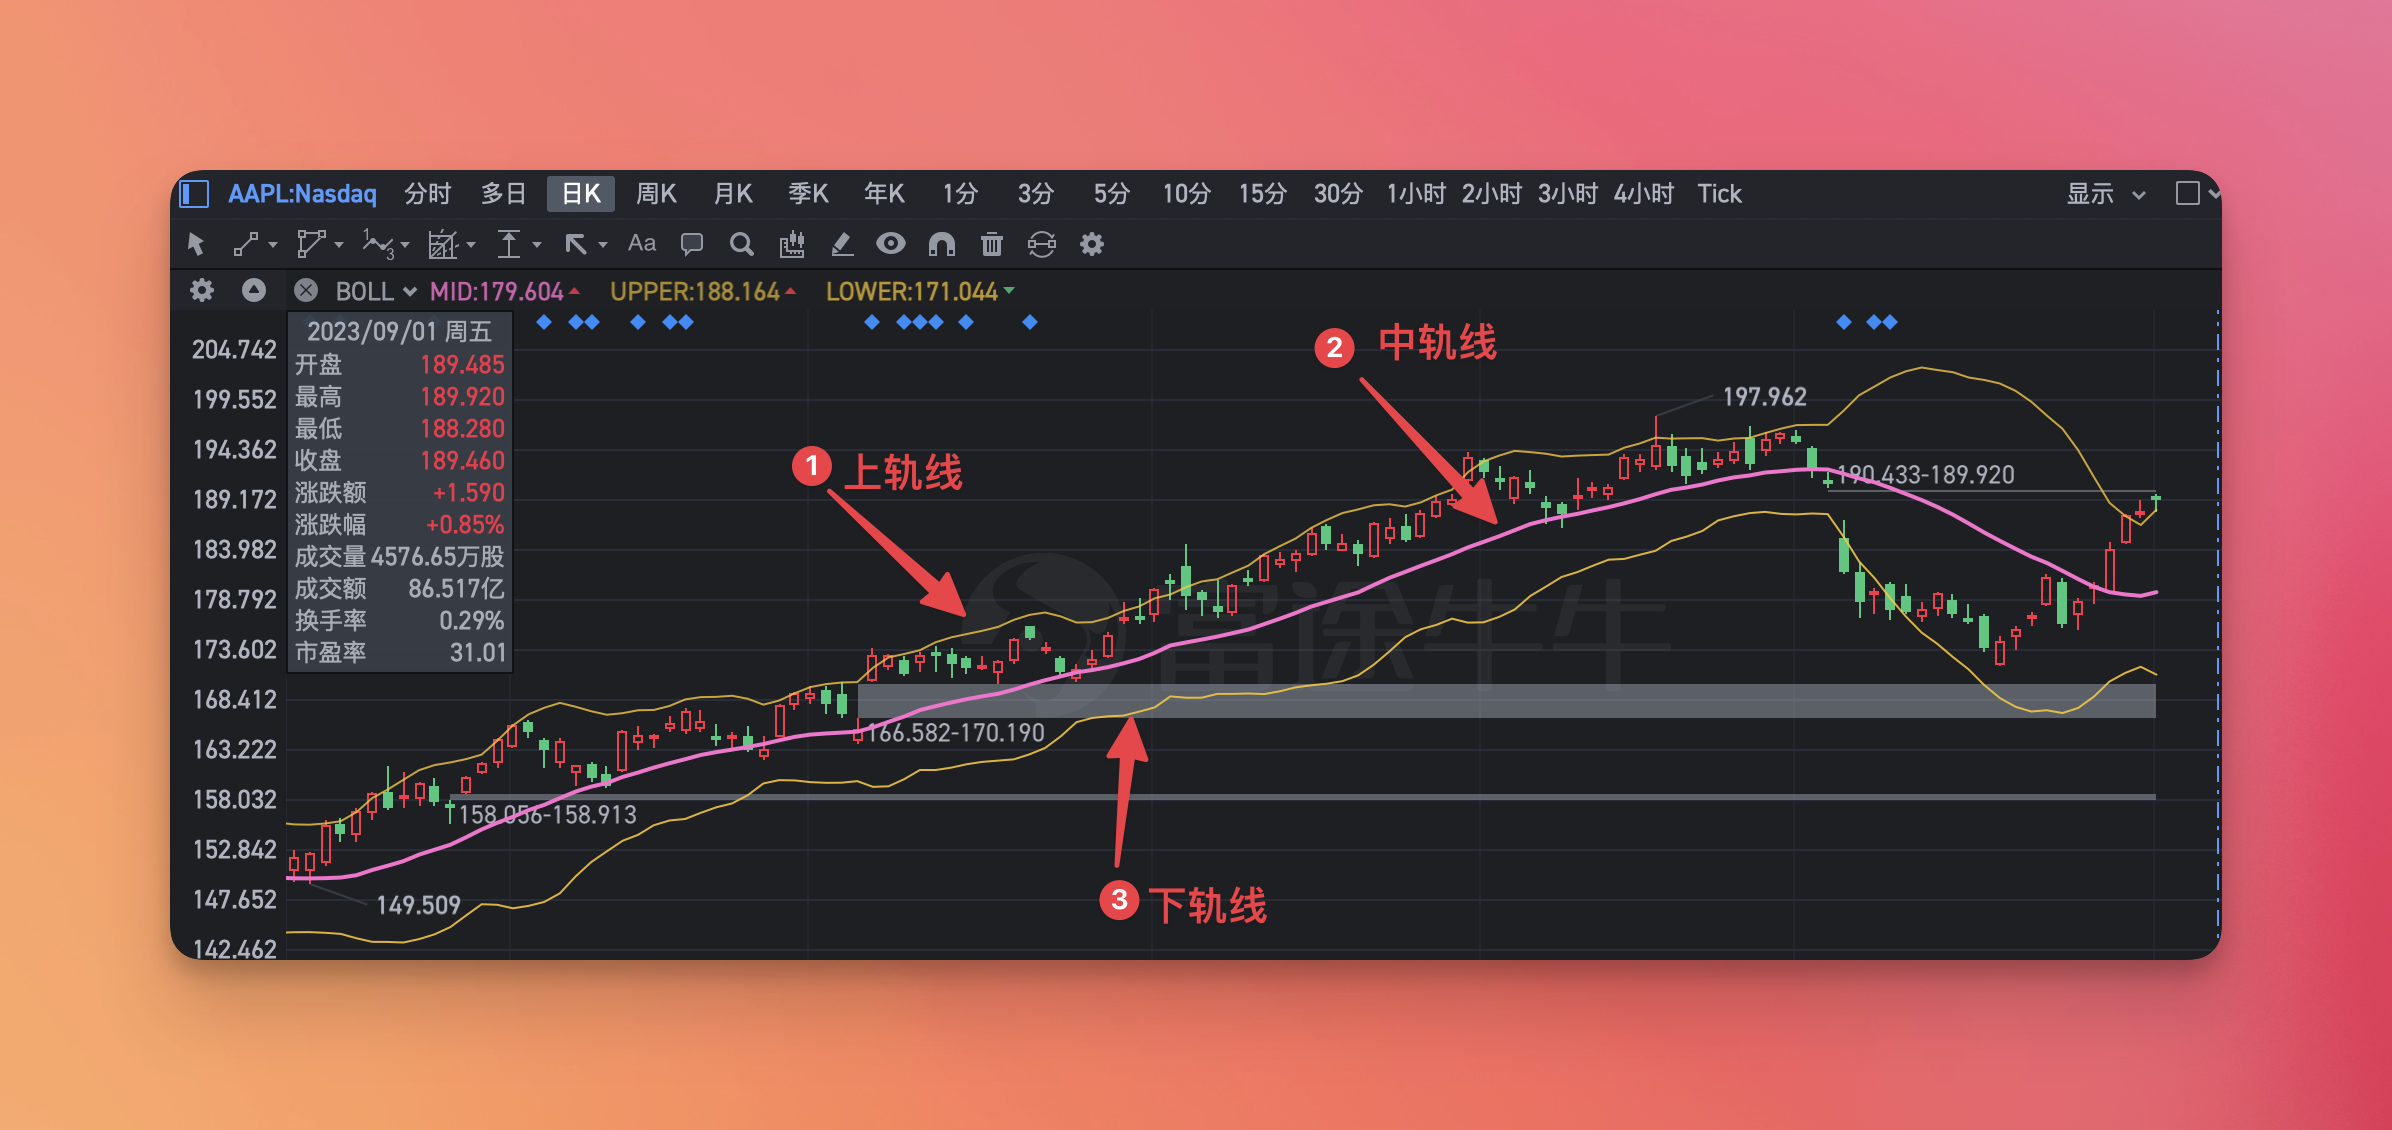
Bollinger Bands is the concept of moving average and standard deviation. Taking MA20 as the central axis, the upper and lower sides deviate from each other by 2 standard deviations to form a channel. Bollinger Bands consist of three orbital lines:
- Upper trajectory = MA20 + 2 * standard deviation
- Middle trajectory = MA20
- Lower Track = MA20 – 2 * Standard Deviation
PS: The standard deviation here is a concept in statistics. The core idea is that most stock prices will fall when they rise to a certain height, and rebound when they fall to a certain low level. This height and low level are the standard deviation.
Theoretical Basis of Bollinger Bands
The design principle of Bollinger Bands is that the stock price usually fluctuates within a certain range around a certain central axis. Through the statistical analysis of the stock price, the standard deviation of the stock price can be obtained, thereby determining the fluctuation range of the stock price and forming a band. The stock price usually fluctuates within this banded range.
The width of the band will also vary with the volatility of the stock price:
- When the stock price fluctuates violently , the banded range widens, like an opening
- When the stock price fluctuates smoothly , the band narrows, like a closed mouth
Application of Bollinger Bands
Bollinger Bands are mainly for support and resistance, generally speaking (95.4% possibility):
- The lower line has a supportive effect on the stock price : even if it falls below, it is usually not far away, and it usually rebounds quickly
- The upper track line has a resistance effect on the stock price : when it hits the upper track, it may not come down. We need to identify the signal of falling back. If the stock price hits the upper track and it is a green heavy-volume K line, then there is a high probability that it will fall back
- The middle rail line has both support and resistance functions
grab rebound
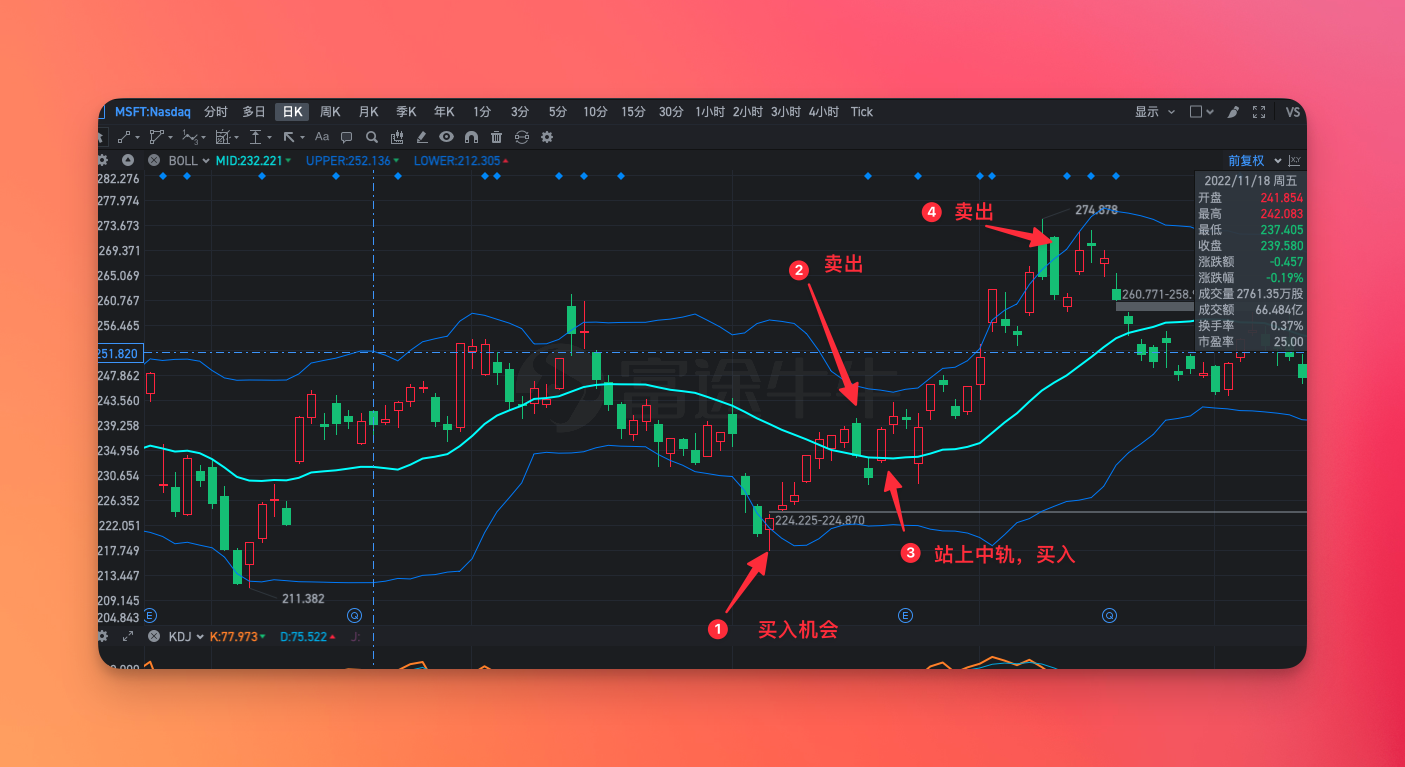
- Buy: When the stock price falls below the lower track line and the red K appears, you can grab a rebound. You can target the middle track line. When the market is good, you can also target the upper track line.
- Sell: When the stock price breaks through the middle track or the upper track, if it encounters the green K line and the stock price falls below yesterday’s lowest point, then sell it. If it does not fall below, you can continue to hold it
Pull back to buy
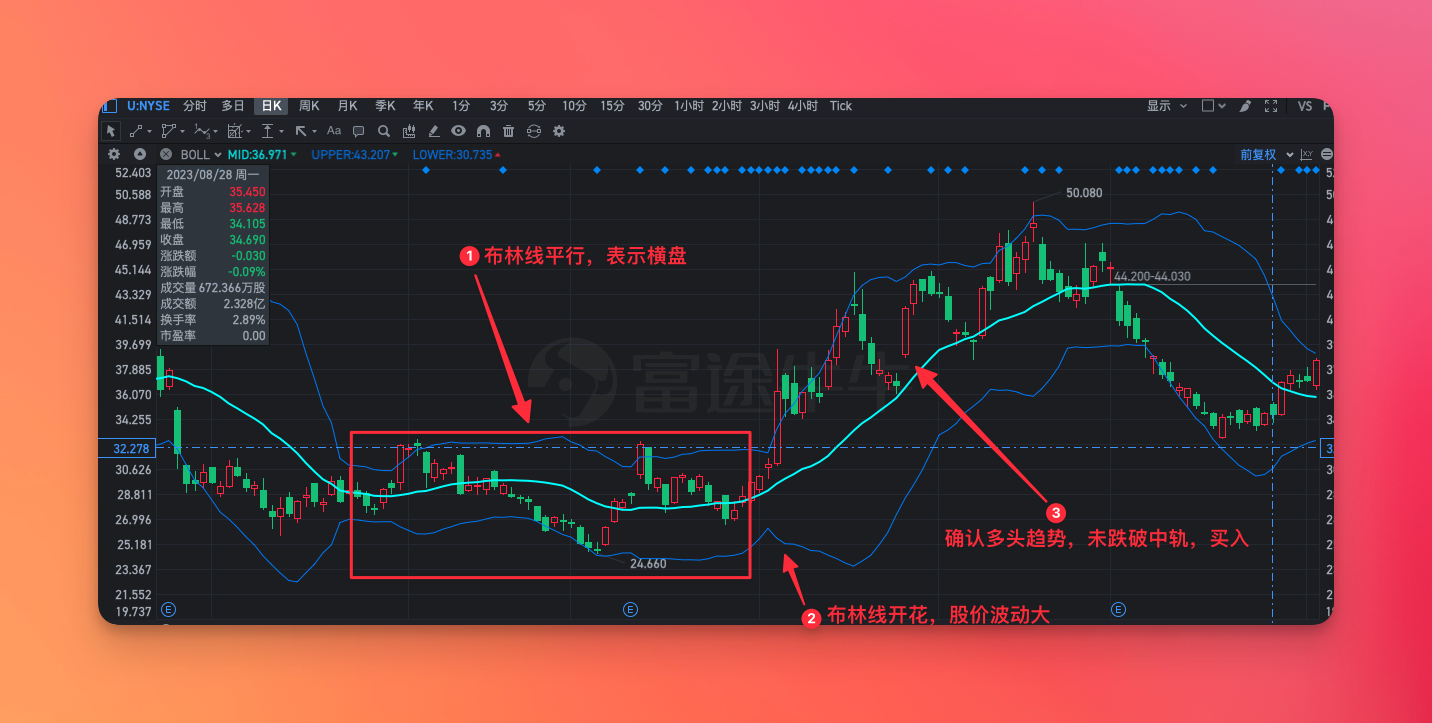
Before using Bollinger Bands, we need to determine the trend of the stock. If it is an upward trend, then we can use the strategy of falling back and buying.
long-term strategy
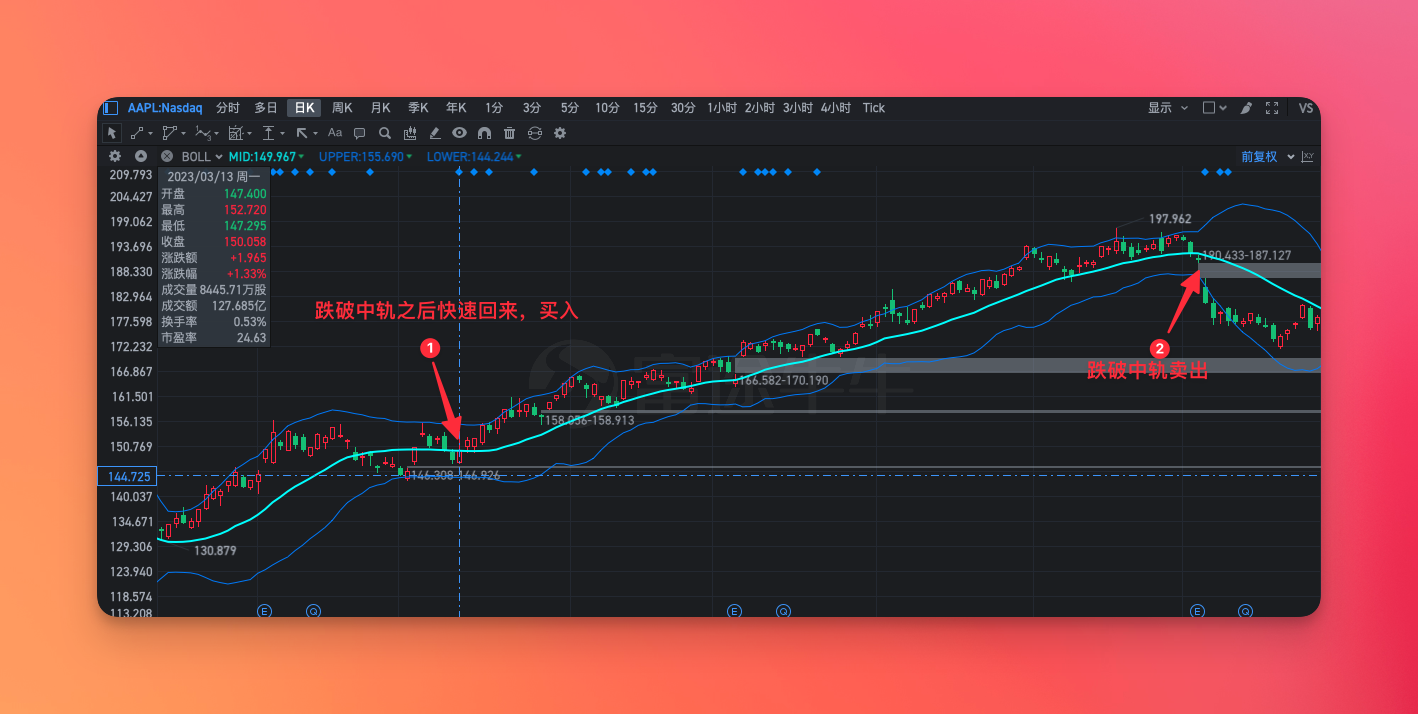
Bollinger Bands are also suitable for long-term strategies. Some stocks are very strong and rebound immediately after hitting the middle line. Such stocks can be held for a long time until the stock price falls below the middle line.
sideways breakthrough
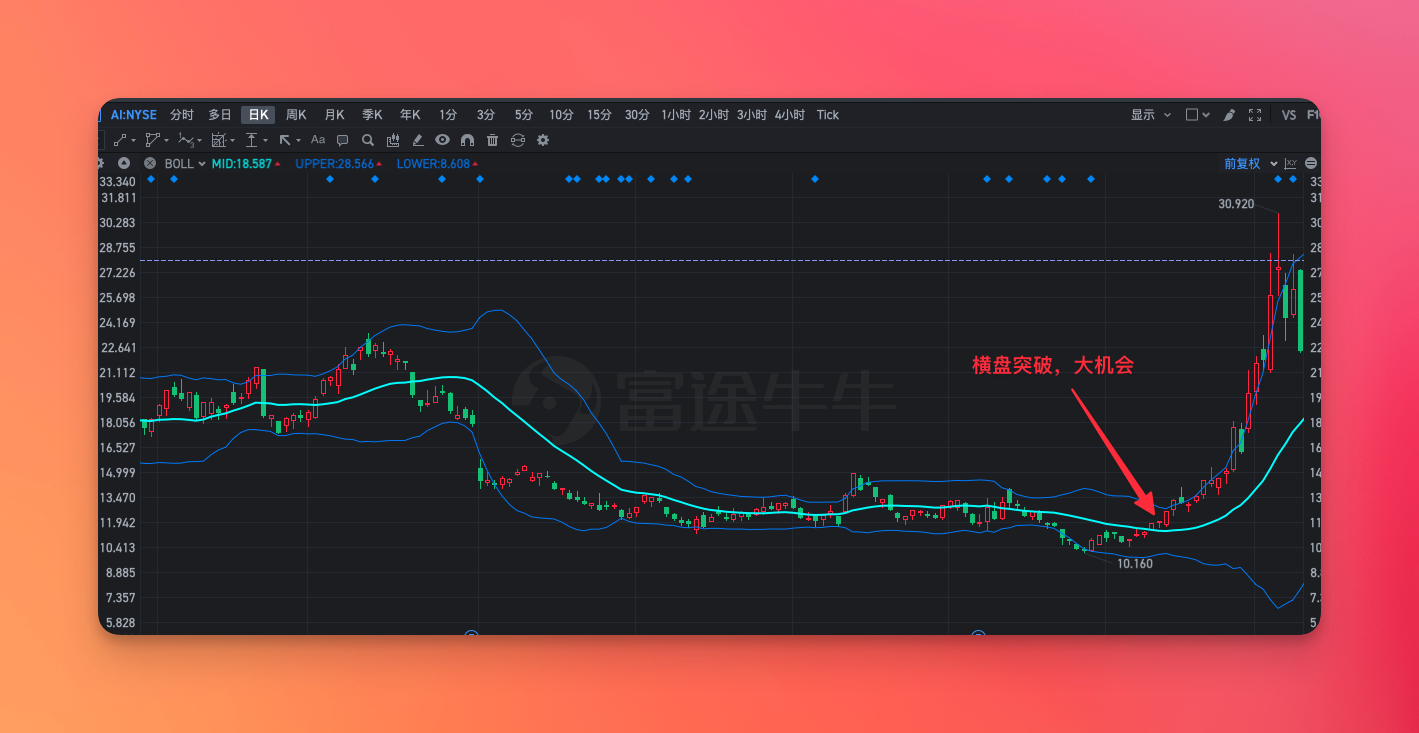
The horizontal Bollinger Bands of the stock price are close to parallel. When the stock price has a tendency to break through, the Bollinger Bands will open, which indicates that a big opportunity is coming and you can buy.
Summarize
Bollinger Bands is a good technical indicator, it can help you find support and resistance, but before using it, you still need to confirm the trend of the stock, the trend is the most important, Bollinger Bands is just an auxiliary indicator.
In addition, when using Bollinger Bands, it must be used in conjunction with other indicators, such as MACD, KDJ, RSI, etc.
This article is transferred from: https://blog.forecho.com/stock-indicators-boll.html
This site is only for collection, and the copyright belongs to the original author.