Original link: https://blog.forecho.com/stock-indicators-gap.html
introduction
Gap is an important concept in stock technical analysis. It is often used as an important support and resistance level for stocks. This article mainly introduces the principle and use of gap.
What is a gap?

Features:
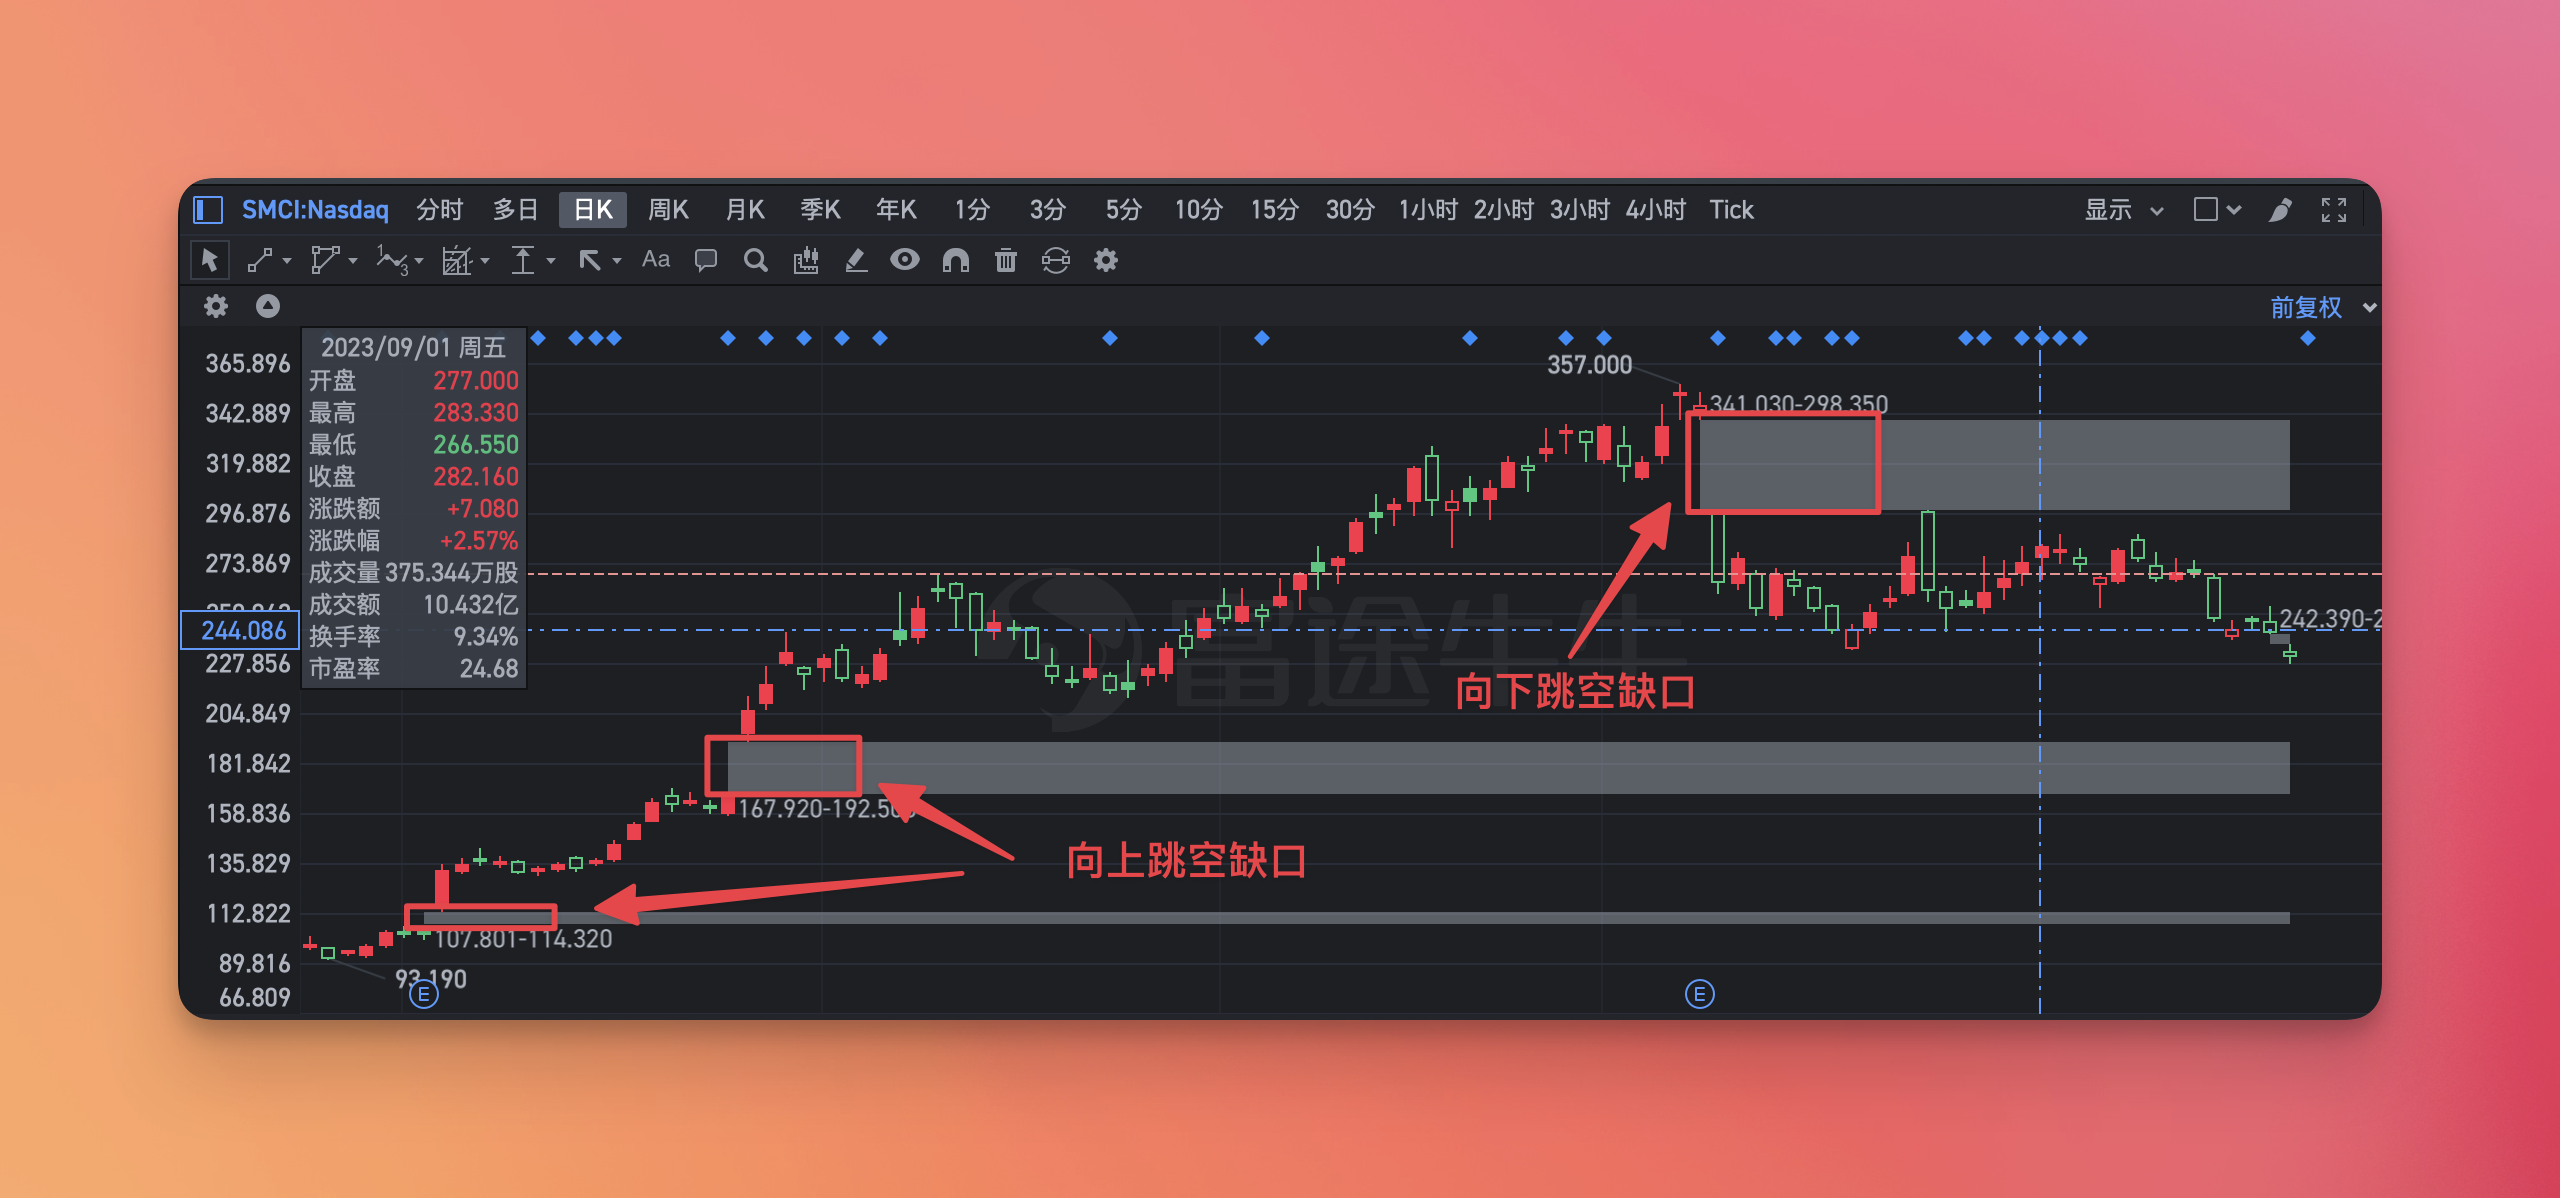
- A gap is a price difference caused by the price difference between the stock price after the close of one trading day and the opening of the next trading day, and there is no transaction record within this range.
- The entire gap area is a support and resistance level. As long as it is not completely covered, it means there is a certain level of support or resistance.
- The size of the gap indicates the size of the force. The larger the gap, the greater the force.
- If the gap is covered within 2-3 days, it can be regarded as a “false breakthrough”.
This phenomenon generally occurs when the market is affected by major news or events, causing stock prices to fluctuate violently in the short term. In the field of technical analysis, the gap is considered a powerful trend indicator, which often indicates that large-scale price fluctuations may follow.
Technical analysts often use gaps to locate support and resistance levels for a stock and also use them to identify possible trend changes. Generally, gap gaps can provide the following three key signals:
- Triggers for Strong Trends: It can serve as a strong buy or sell indicator.
- Comparison of the influence of gaps: Compared with long red or long green K lines, gaps tend to better reflect the strength or weakness of the market.
- Prediction of future price trends: Based on the direction of the gap, we can infer the future price changes of the stock and whether there is a possibility of breaking through the sideways range.
Type of gap
Ordinary notch
Features:
- The strength is relatively small
- Usually in the sideways range of stocks
- There is no tendency to break out of the sideways range
This kind of gap has little reference significance and can be filled quickly, so it does not require attention.
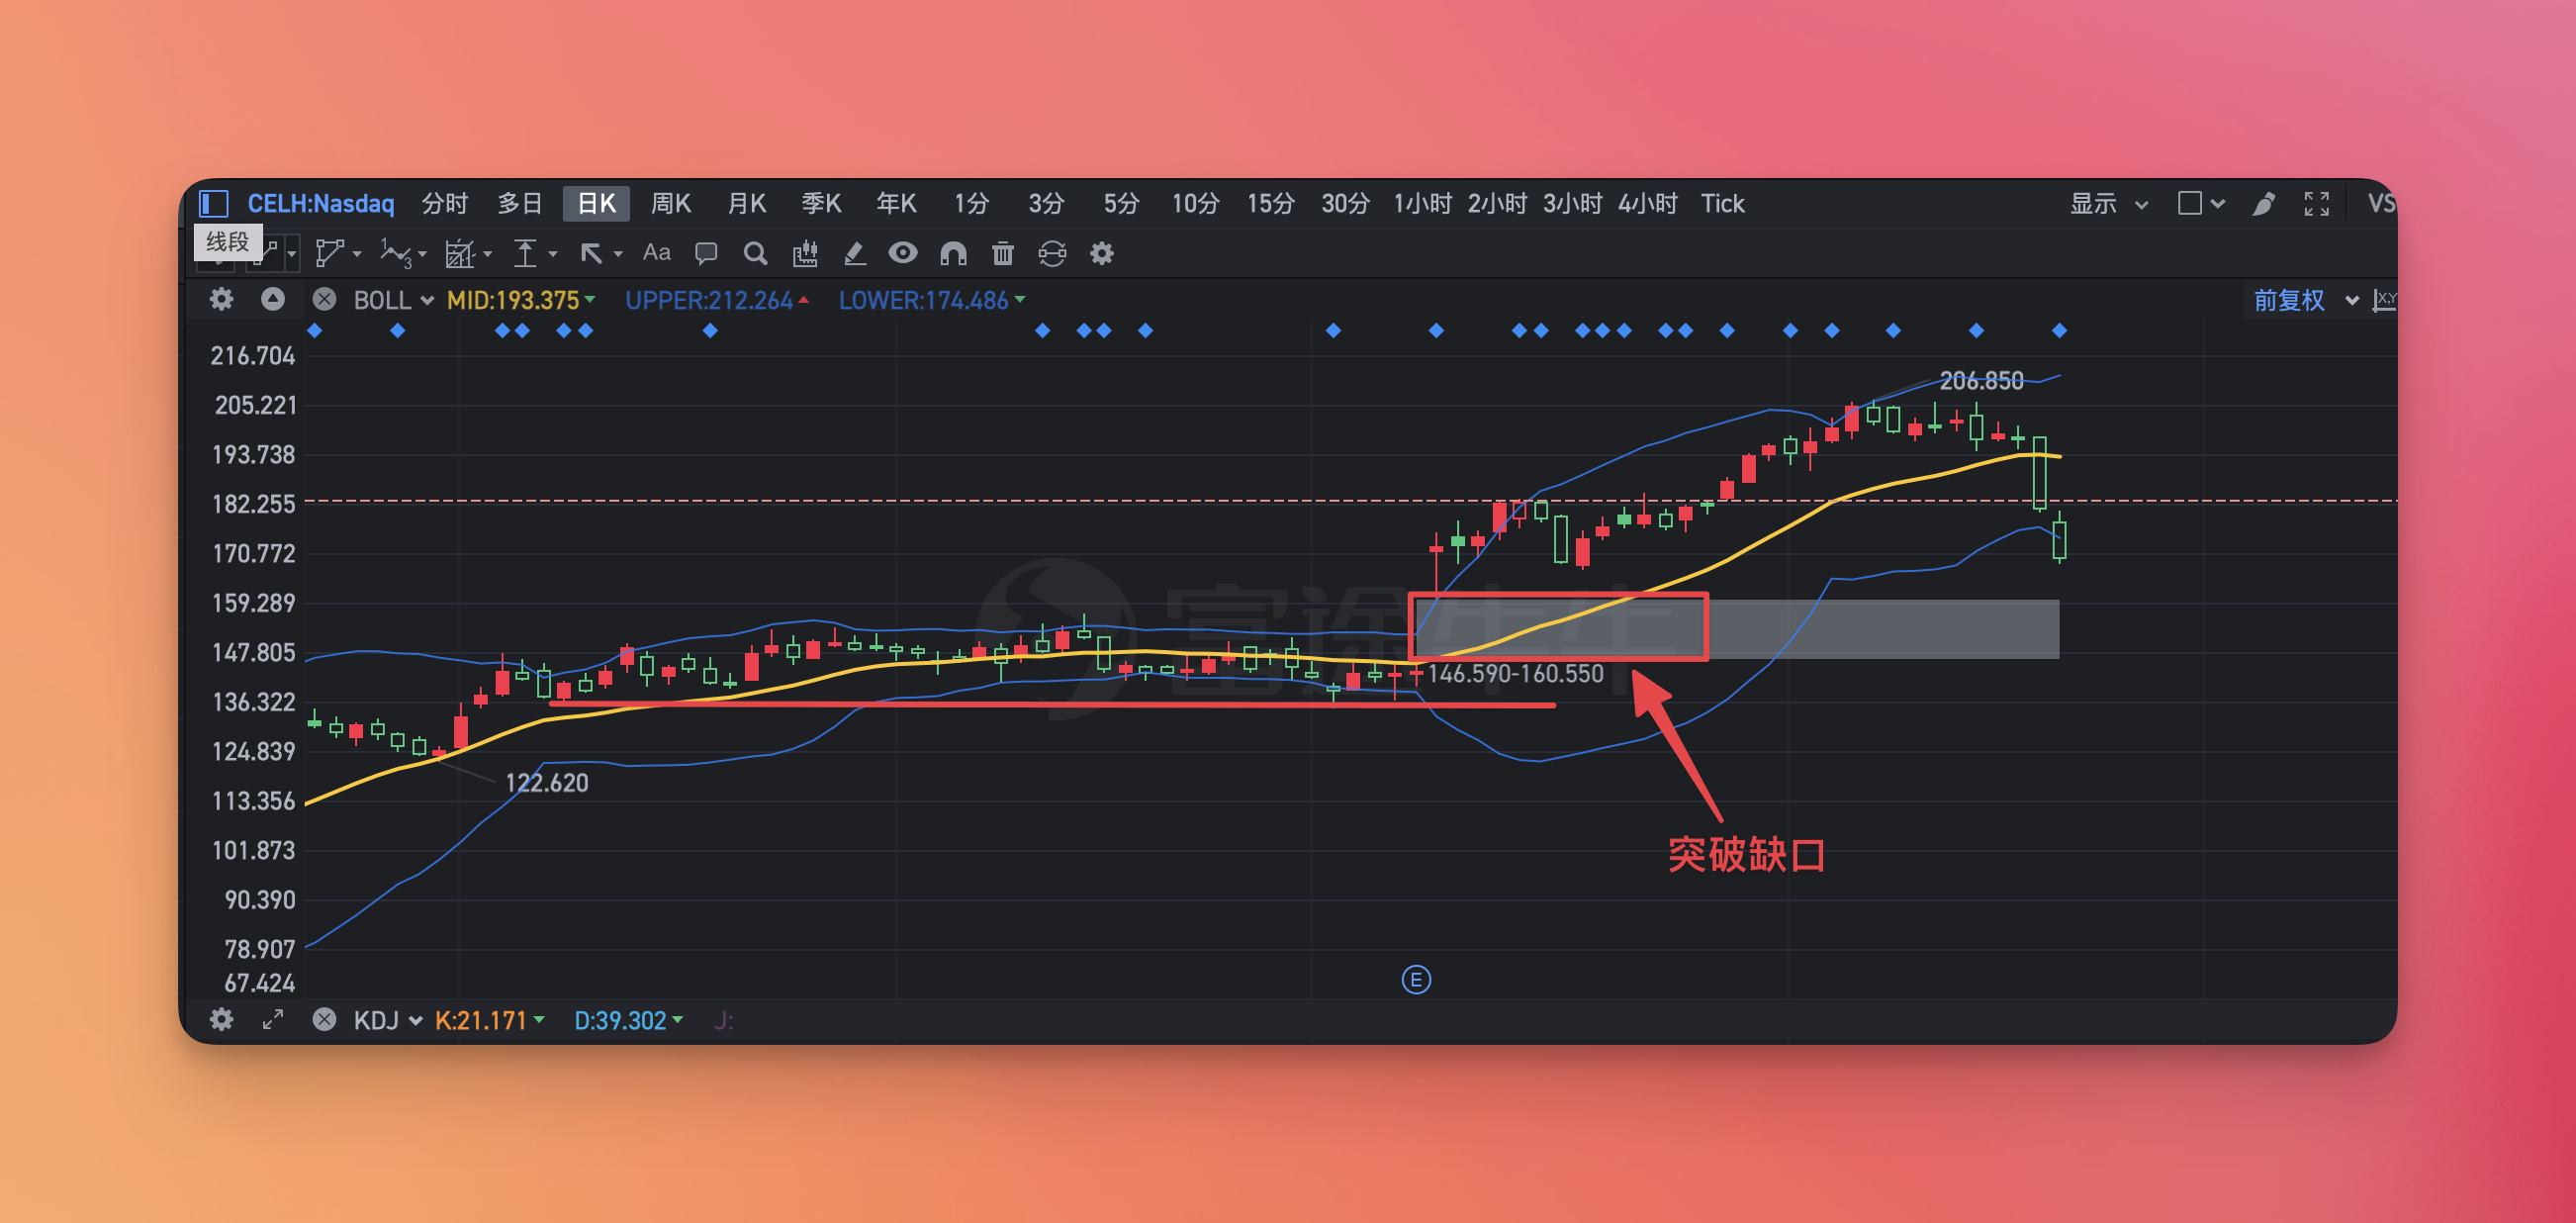
break through the gap

Features:
- Appearing in the sideways range, when the market is starting, it indicates that the stock will go up or down.
- Usually accompanied by large volumes
Signal:
- Gap and break upward, strong buy. As long as the gap has not been filled, it means there is certain support.
- Gap downwards and break through, strong selling. As long as the gap has not been filled, it means there is a certain resistance.
When you see a breakthrough gap, you must seize the opportunity. If you jump short and break upward, don’t be afraid of heights and rush in.
escape gap
Because it can roughly predict the distance that the stock price may move in the future, it is also called the measurement gap. It has the following characteristics:
- Similar to a breakout gap, but the location is different
- Usually seen in up/down trends in stocks
- Indicates that market strength or weakness will continue
Signal:
- An escape gap for a strong stock means that the stock’s upward trend will continue.
- An escape gap for a weak stock means that the stock’s downward trend will continue.
When you encounter an escape gap, don’t rush into the market. You should observe the stock for a few days to see if it will cover the gap. If it doesn’t cover the gap, you can wait for the stock to retrace and buy the closing price on the day it went up. If it covers the gap, Just don’t buy it.
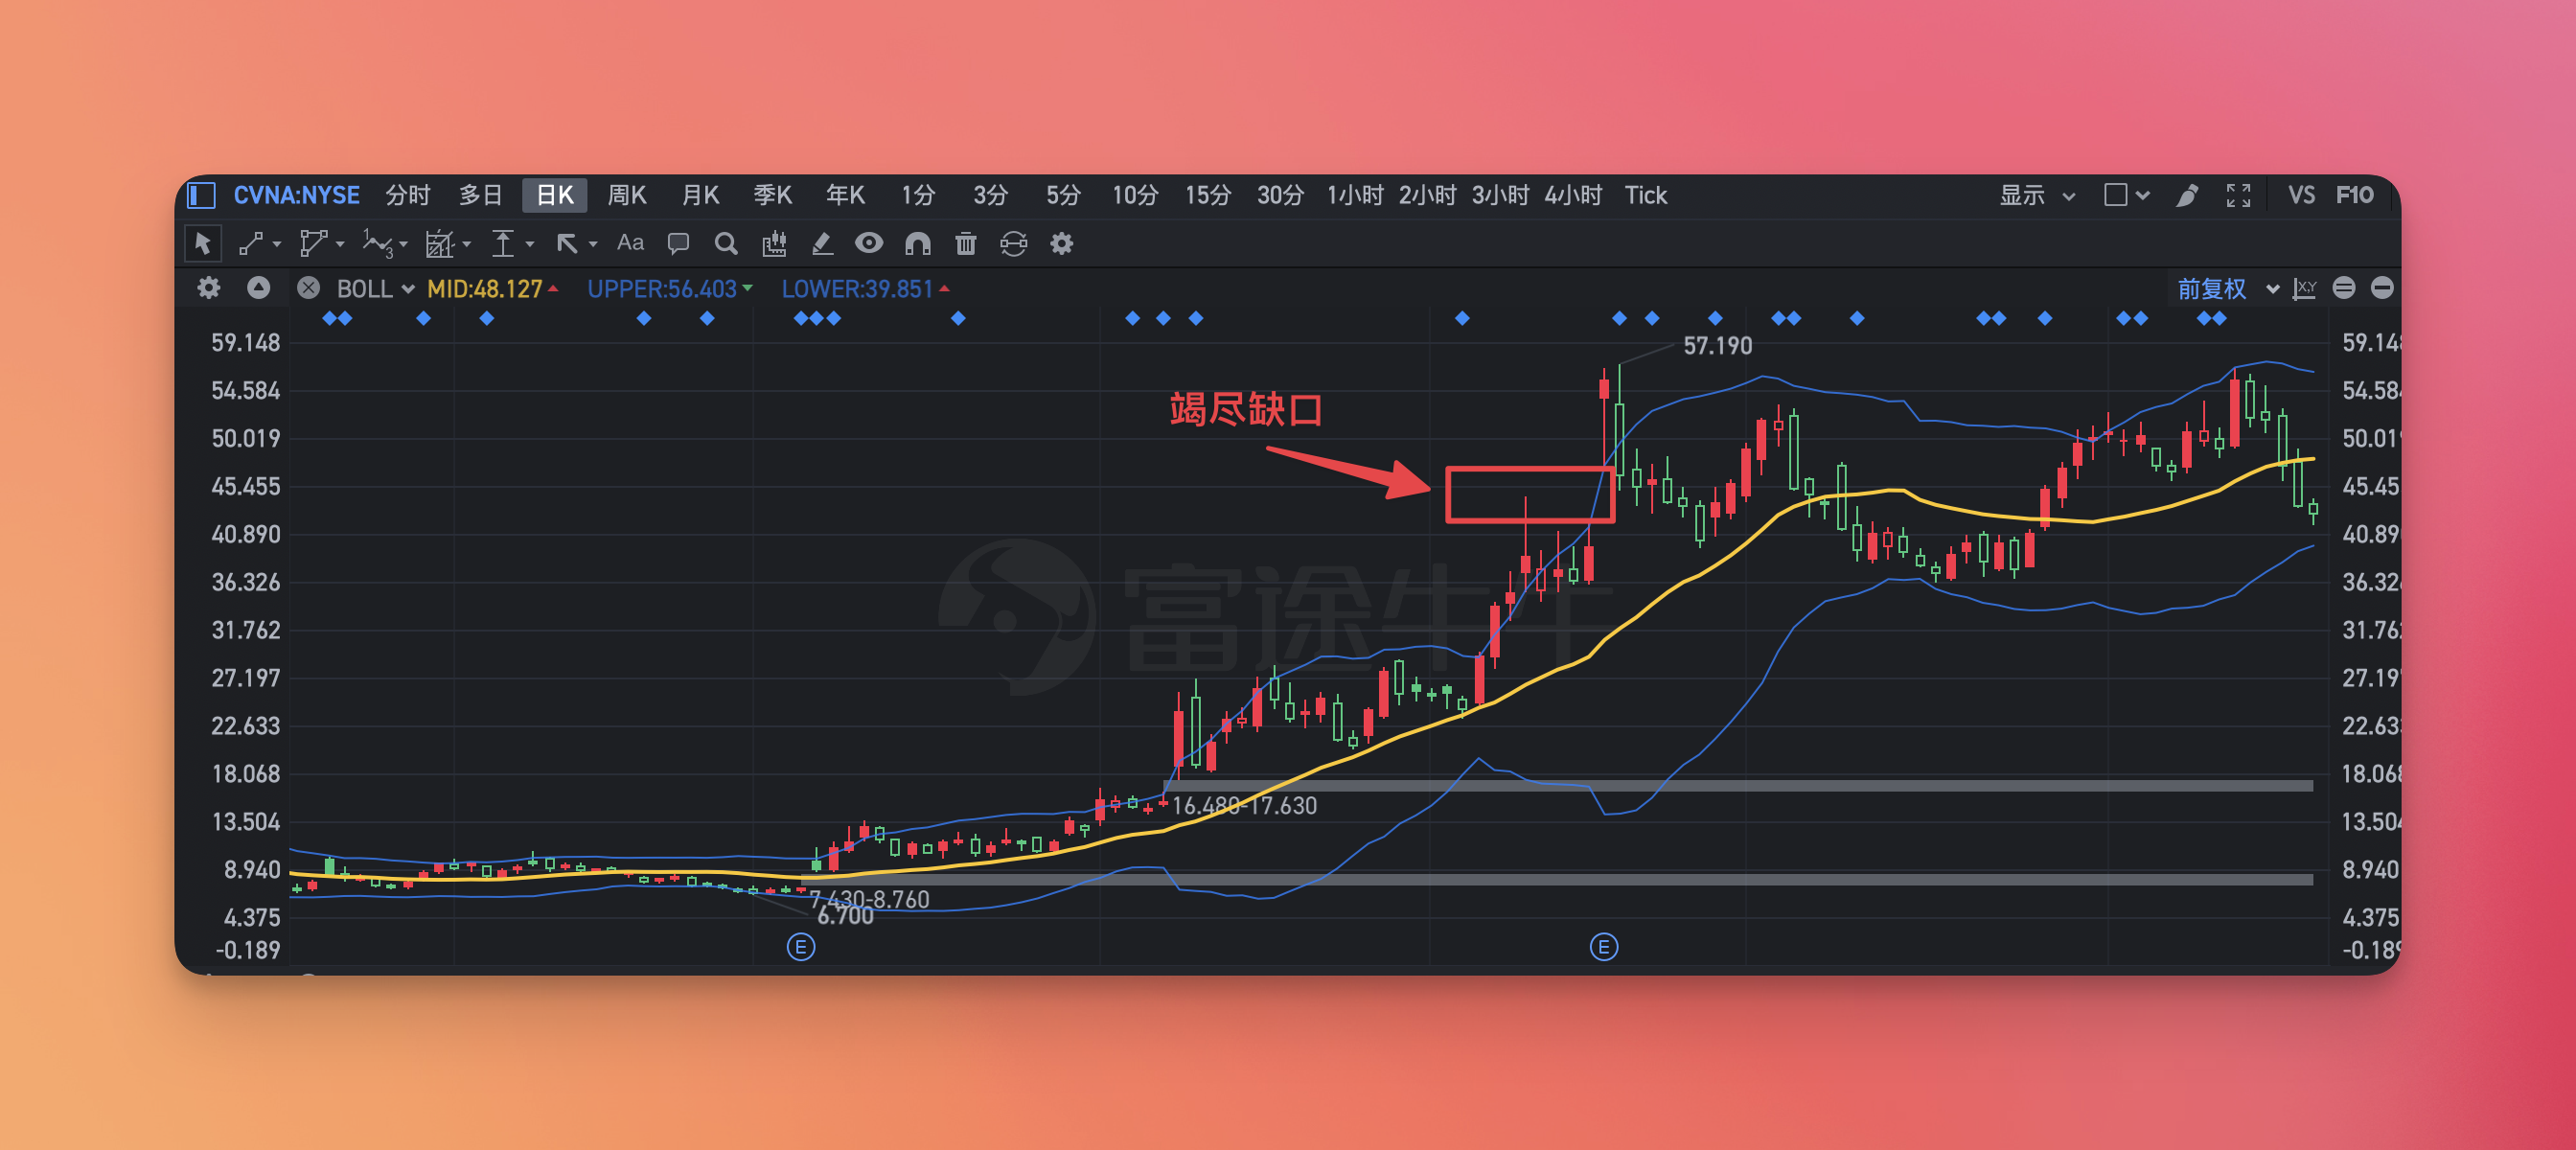
exhaust the gap

Features:
- Usually appears at the end of the stock market
- Stocks at high levels, trading volume amplified
- It means that the stock is being chased up or sold crazily, and its upward/downward trend will end.
- Usually the market ends quickly, and the stock price usually covers the gap within 3 days.
Signal:
- It means that the long and short forces are using their last strength and the market is about to end.
- It’s also a good time to make waves
How to use gaps
There are 4 types of gaps, we just focus on breaking through the gaps.
Positions that are easy to rise:
- The bull position rises, the trading volume increases, and the gap breaks upward
- Bulls break through the pressure level, trading volume increases, and the gap breaks upward.
Positions prone to falling:
- Bulls continue to rise. At a high level, trading volume is enlarged, and the gap is exhausted upward.
- When bulls rise, they encounter resistance levels, trading volume increases, and they jump downwards.
Precautions
First, it is important to understand the 4 different types of gaps because they signal different subsequent market movements. For example, escape gaps often indicate that an uptrend will continue, while exhaustion gaps tend to signal an imminent trend reversal.
For an upward jump gap, if you want to accurately predict its subsequent trend, the most ideal situation is that the gap breaks through the pressure line, and is accompanied by a gradual increase in trading volume. The larger the gap, the higher the probability of its subsequent rise. In this case, consider buying. However, for those who wish to avoid chasing highs and maintain a conservative investment strategy, it is recommended to wait until the stock price retreats slightly before making a purchase.
Another key metric to watch is volume. Typically, breakout gaps tend to occur during a period when volume begins to increase as market participants begin to focus on driving prices higher. On the contrary, if the trading volume of the exhaustion gap gradually decreases while the price rises, this usually means that investors are unwilling to chase higher, and there is a possibility of a market reversal.
Summarize
Both upward and downward gaps are clear trend signals from the main market forces. If a pressure line is broken or a support line is broken within a sideways range and is not filled within the next two to three days, this usually signals a clear up or down trend. This is the ideal time to place a buy or sell trade.
In addition, after the price jumps upward, if it fails to continue to reach new highs at the high level, and the trading volume decreases, and then falls back with a downward jump, the highest price formed in this situation is usually described as an “island”. status reversal”. Since island reversal patterns are rare and usually occur early in a major decline, this provides an excellent shorting (selling) opportunity.
When using the gap indicator, you still need to look at the trend first. The trend is the most important. Confirm the trend first, and then look at the gap. The gap is just an auxiliary indicator. Don’t follow the gap blindly. Use it in conjunction with other indicators.
This article is reproduced from: https://blog.forecho.com/stock-indicators-gap.html
This site is for inclusion only, and the copyright belongs to the original author.