introduction
MA is one of the most commonly used technical indicators in stock technical analysis, and is often used to judge the trend of stocks. This article mainly introduces the calculation method and usage method of MA indicator.
What is the MA indicator
MA is the abbreviation of Moving Average (Moving Average), referred to as “average”, which represents the average price of the stock in the past period of time.
calculation method
The calculation method of the moving average is relatively simple. It is the average of the closing prices of a stock over a certain period of time.
The following are the basic steps to calculate the moving average:
-
Select a time period : This time period can be any number of consecutive days you choose. Commonly used are 5 days, 10 days, 20 days, 60 days, 120 days, 240 days and so on.
-
Aggregate the closing prices for the time period : For example, if you are calculating the 10-day moving average, you will need to sum the closing prices for the past 10 days.
-
Divide by the number of days : You then divide the sum obtained in step 2 by the number of days you choose. For example, if you are calculating a 10-day moving average, you will divide the sum by 10.
This result is the average value for the time period you choose.
For example, the formula for calculating the 5-day moving average is:
|
|
Among them, P1, P2, P3, P4, and P5 respectively represent the closing prices of the last 5 days.
It should be noted that the moving average changes every day, because new closing prices are added to the calculation every day, and the earliest closing prices are excluded.
purpose of usage
The main purpose of moving averages is to help investors understand the trend of stock prices. It can provide the following important information:
Trend judgment
When the stock price is consistently above a certain moving average, especially a long-term moving average such as the 50-day or 200-day moving average, it can be considered that the stock may be in an upward trend. Conversely, if the stock price stays below a certain moving average, it may be in a downtrend.
buy and sell signal

A crossover of a short-term moving average and a long-term moving average is often seen as a buy or sell signal:
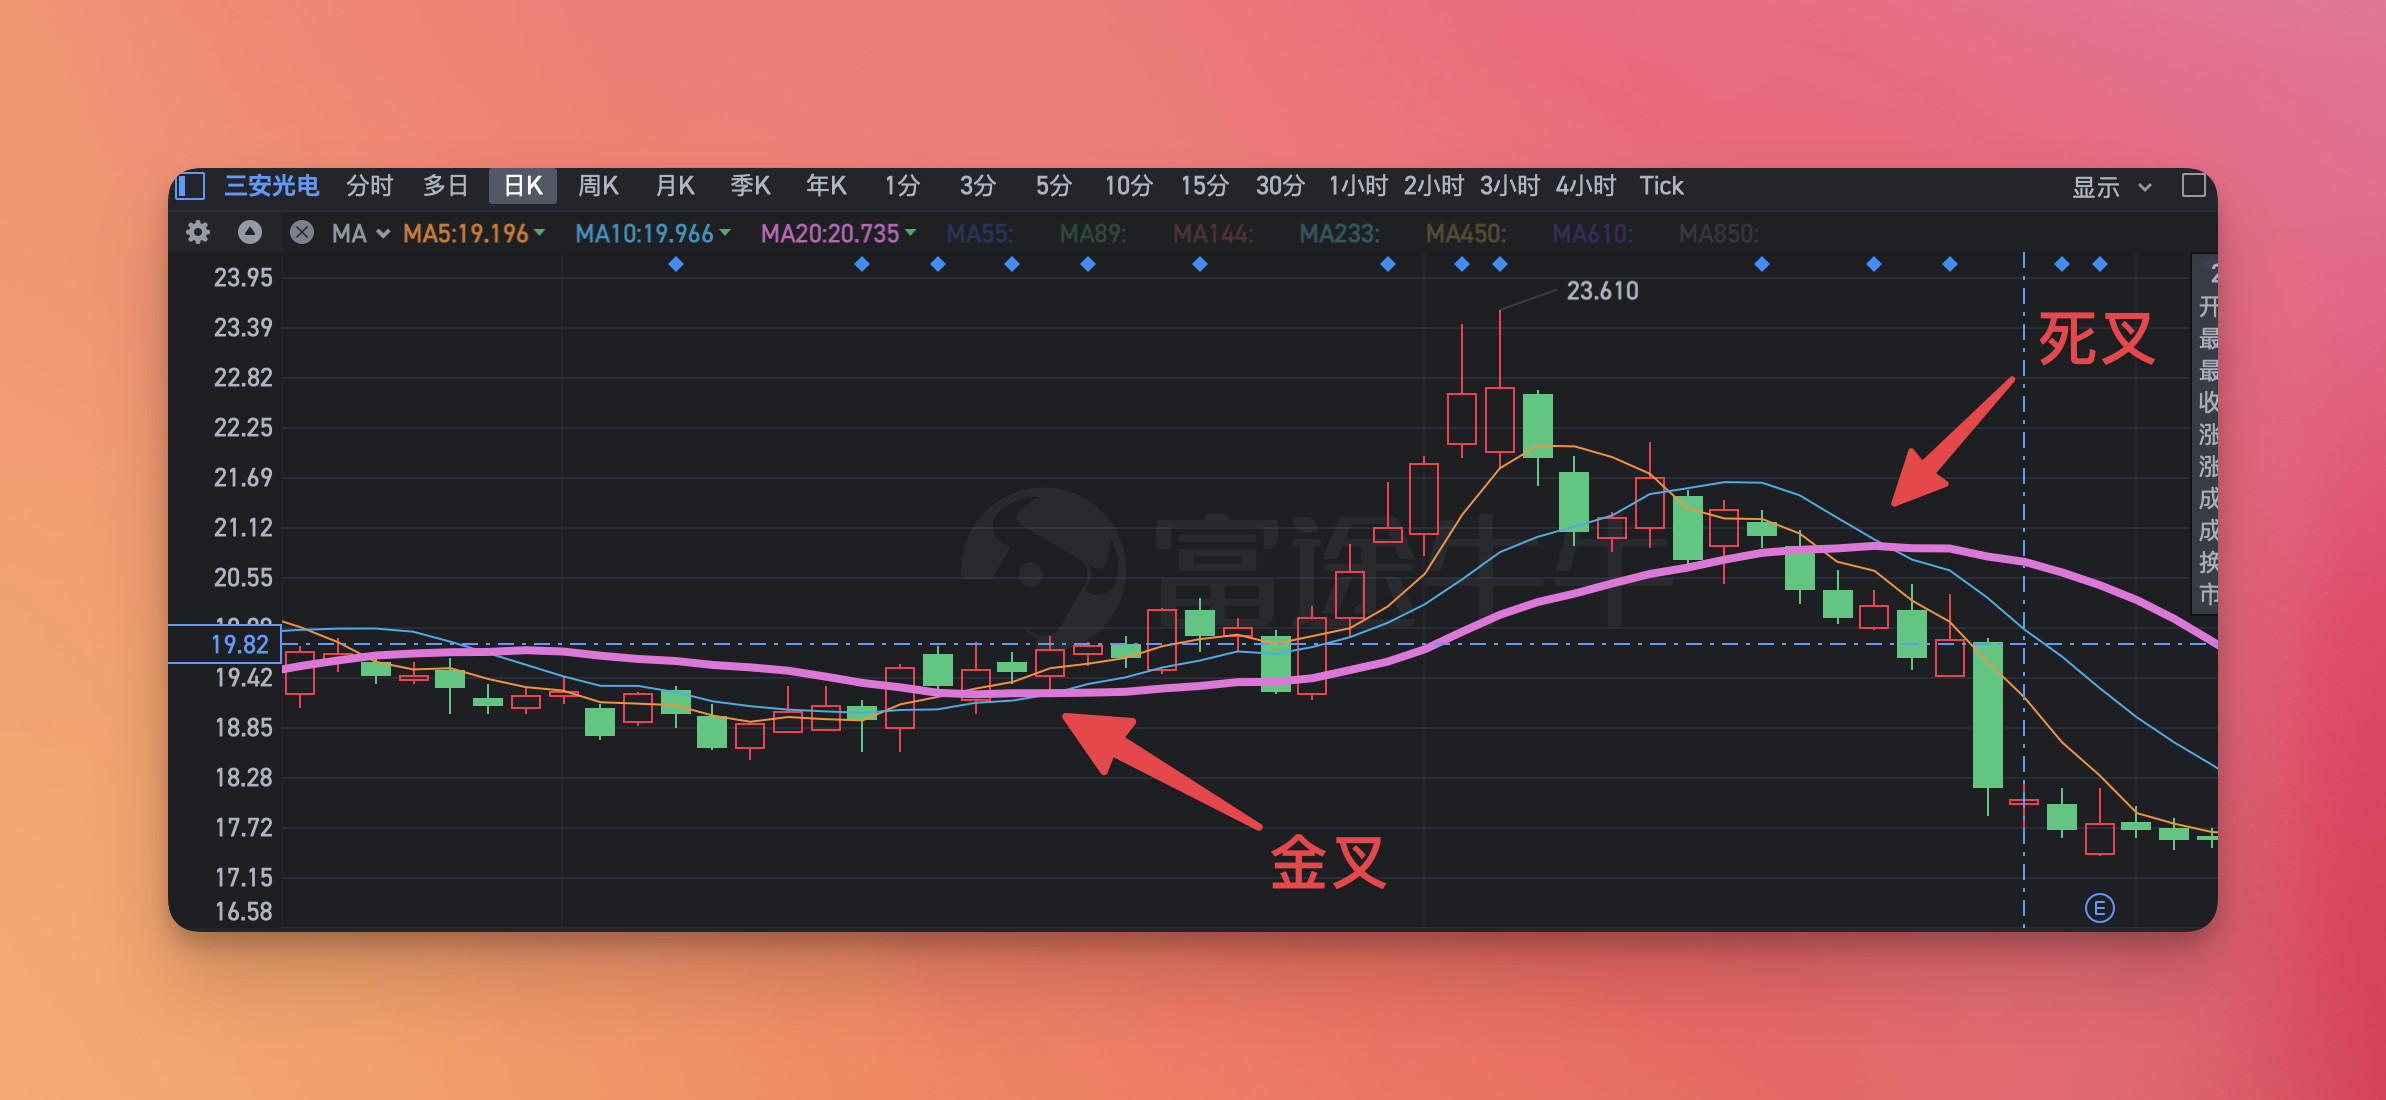
- Buy Signal : When a short-term moving average (such as a 5- or 10-day moving average) crosses below a long-term moving average (such as a 50- or 200-day moving average), this is considered a “golden cross.”
- Sell signal : Conversely, if the short-term moving average crosses the long-term moving average from above, this is called a “dead cross”.
support and resistance
Support : Moving averages are also sometimes viewed as possible support or resistance levels. If the stock price falls to a certain moving average and stops falling or rebounds there, then this moving average may be a support line.
Resistance : Conversely, if a stock price rises to a certain moving average and stops there or starts to pull back, then that moving average may be a resistance line.
The price deviation from the moving average
The degree to which the price deviates from the moving average can also provide some information.
- If the stock price is much higher than the moving average, it may indicate over-buying, and you need to be alert to the risk of price fall;
- If the stock price is far below the moving average, it may indicate oversold, and there may be a chance for a rebound.
Instructions
Introduction
Commonly used moving averages are as follows:
- 5-day moving average (MA5), that is, the weekly line
- 10-day moving average (MA10), that is, the half-moon line
- The 20-day moving average (MA20), that is, the monthly line, is a very important moving average
- 60-day moving average (MA60), that is, the quarterly line
- 120-day moving average (MA120), that is, the half-year line
- The 240-day moving average (MA240), that is, the annual line, and some people use the 250-day moving average instead of the annual line
According to your risk appetite and investment cycle, you can choose different moving averages to judge the trend of stocks, the strategy is as follows:
| Strategy | super short line | short term | midline | long line |
|---|---|---|---|---|
| transaction hour | within days | a few days | weeks | months |
| use moving average | 1 point, 5 points, 16 points, 60 points | 3rd, 5th | 20th, 60th | 120 days, 240 days |
in addition:
- The monthly line is the most important moving average, and it is the long-short dividing line for short-term operations
- The season line is the long-short dividing line for medium and long-term operations
- The long trend is above the monthly line, the monthly line is rising, go long; the trend is short below the monthly line, the monthly line is falling, and you are short
single moving average trading method
In the short-term of a week or so, we mainly look at the 5-day, 10-day, and 20-day moving averages. The single moving average trading method means that we choose a moving average, such as the 5-day moving average, and then judge whether to buy or sell based on the trend of this moving average.

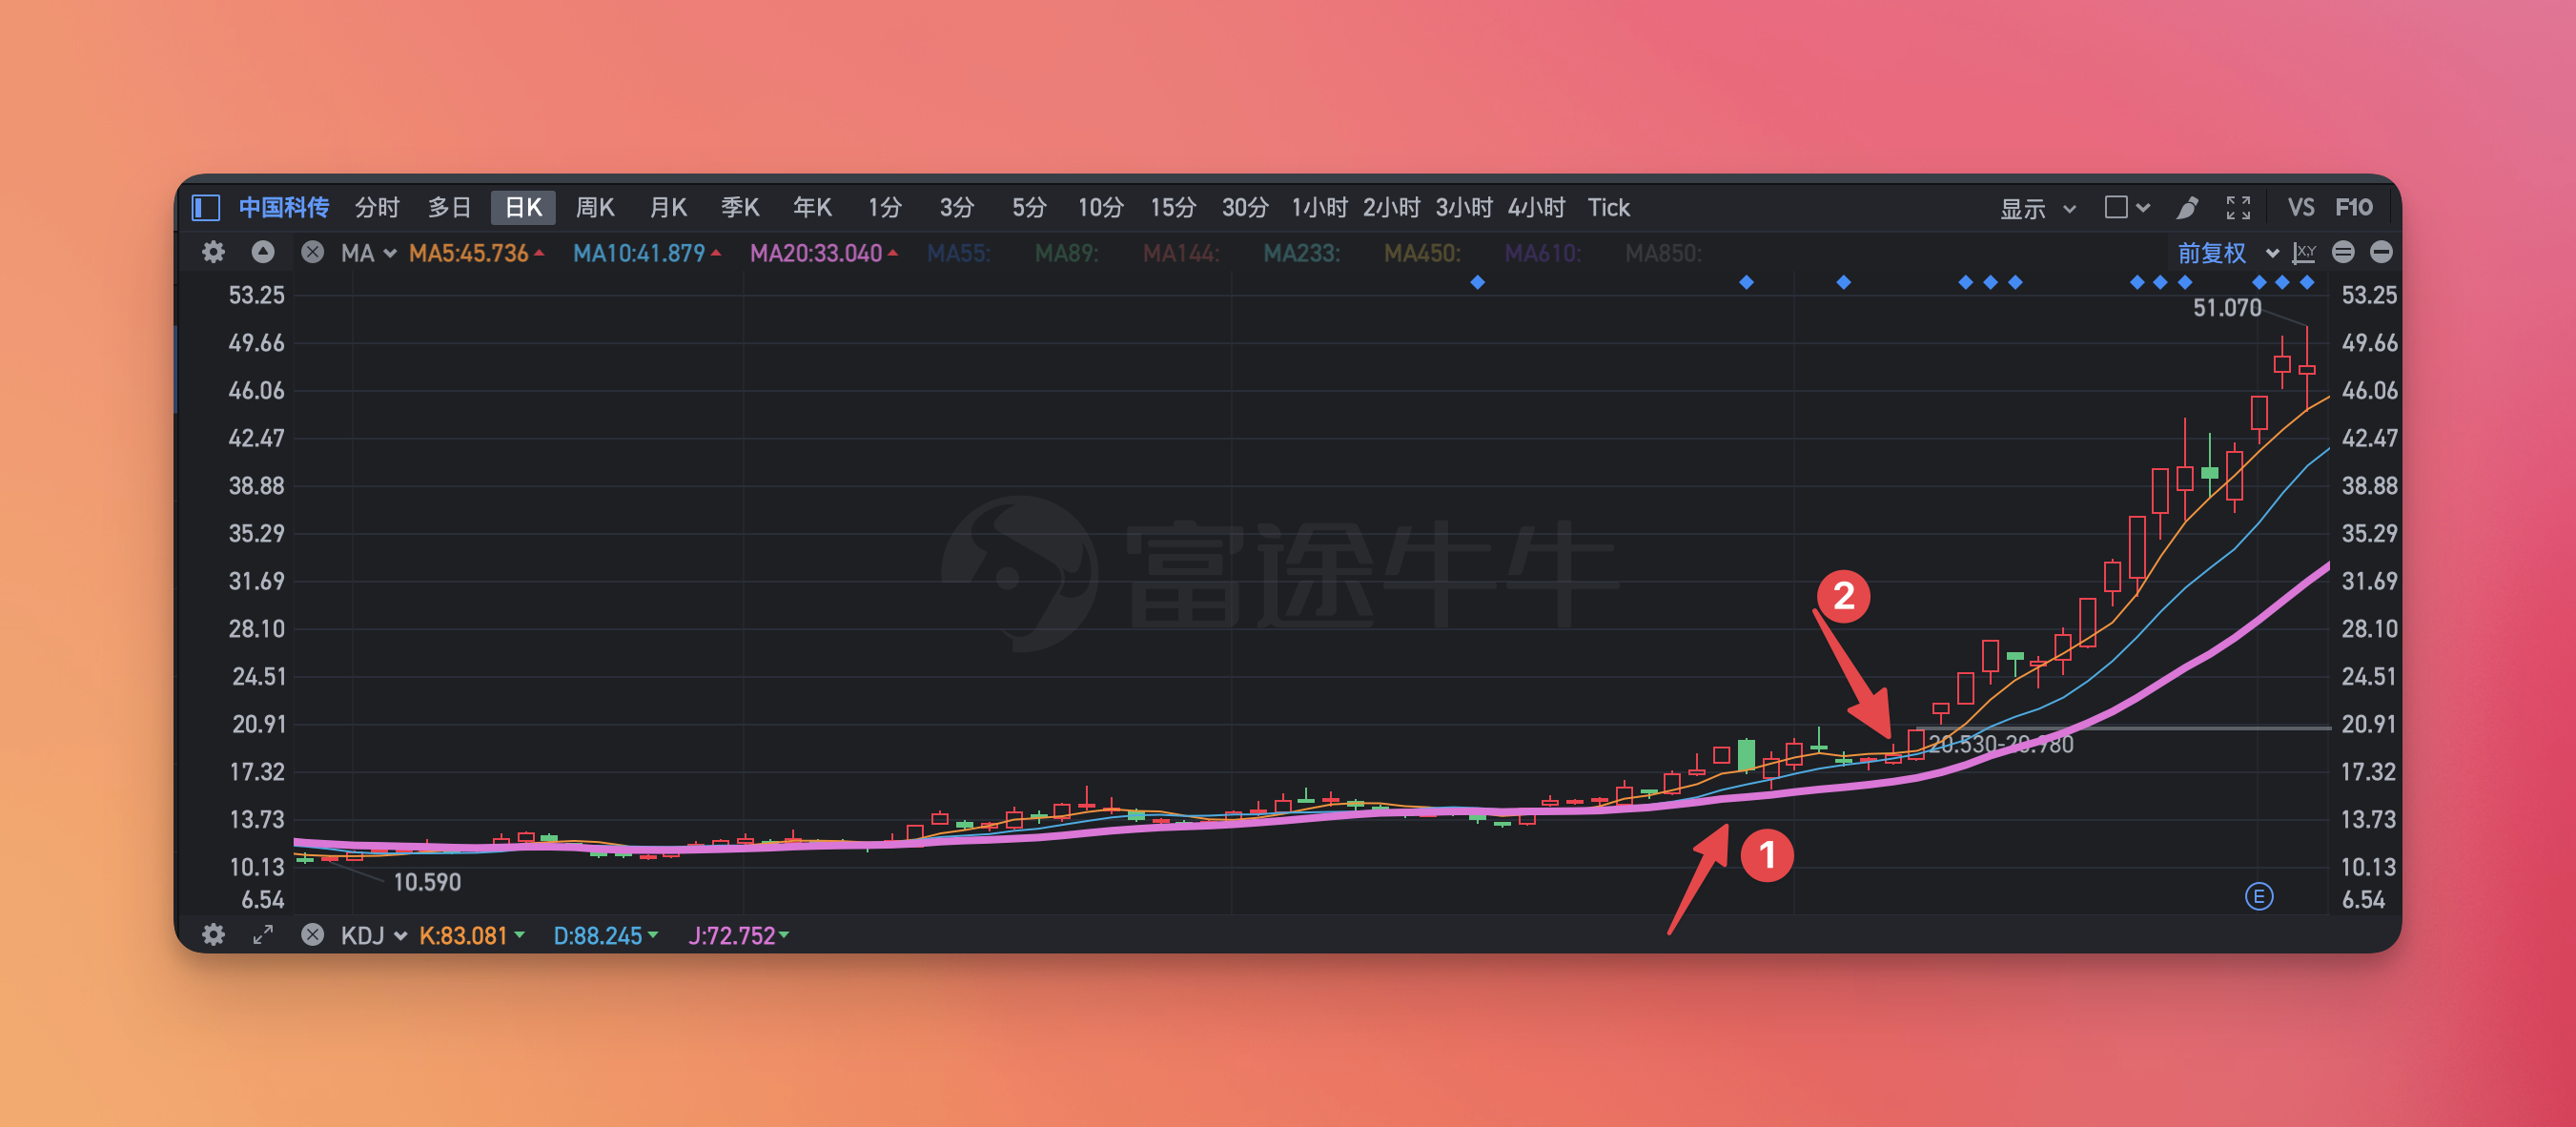
Take a look at the example of China Science and Technology Communication:
- Before the position in Figure 1 above, the three moving averages are very messy, so it is not recommended to enter the market. Retracement but MA5 has been above MA10 and MA20, which is a very good entry point at this time.
- When the three moving averages of MA5, MA10, and MA20 are all upward, and MA5 is above MA10, MA20, and MA10 is above MA20, you can enter the market at this time. It is recommended to enter the market about 10 minutes before the market closes. It is not recommended for novices to operate in the market.
- Stop loss point: Set the stop loss point at the lowest price of the stock price on the day of entering the market . If the stock price falls below this point, sell it.
- Check every day about 10 minutes before the market closes, and continue to hold until there is a sell signal if the stop loss point is not broken.
- Sell signal: About 10 minutes before the market closes, sell when the stock price falls below the moving average. If you entered the market with MA5, you should look at MA5, if you entered the market with MA10, you should look at MA10, and so on. MA5 is too tired, so I recommend MA10.
in principle:
- This method is only applicable when the long-short trend is obvious (when the three moving averages of MA5, MA10, and MA20 are all upward, and MA5 is above MA10, MA20, and MA10 is above MA20, we call it a long trend), and it is not suitable for periods of shocks .
- When the MA20 moving average is up, it is suitable for long positions, and when the MA20 moving average is downward, it is suitable for short positions.
- Whether it is long or short, the fast closing price shall prevail, that is, manual operation is performed about 10 minutes before the closing to prevent large intraday fluctuations.
- Both daily and weekly lines are available.
- The entry and exit look at the same moving average, for example, the entry looks at MA5, and the exit also looks at MA5.
- Moving average selection:
- MA5: short-term operation, about a week
- MA10: short-term operation, one week to one month
- MA20: midline operation, about one month
True and false golden fork

We know that when the short moving average (MA5, MA10) crosses the long moving average (MA20, MA60) from bottom to top, it is called a golden cross, which is a buying signal; otherwise, it is called a dead cross, which is a selling signal.
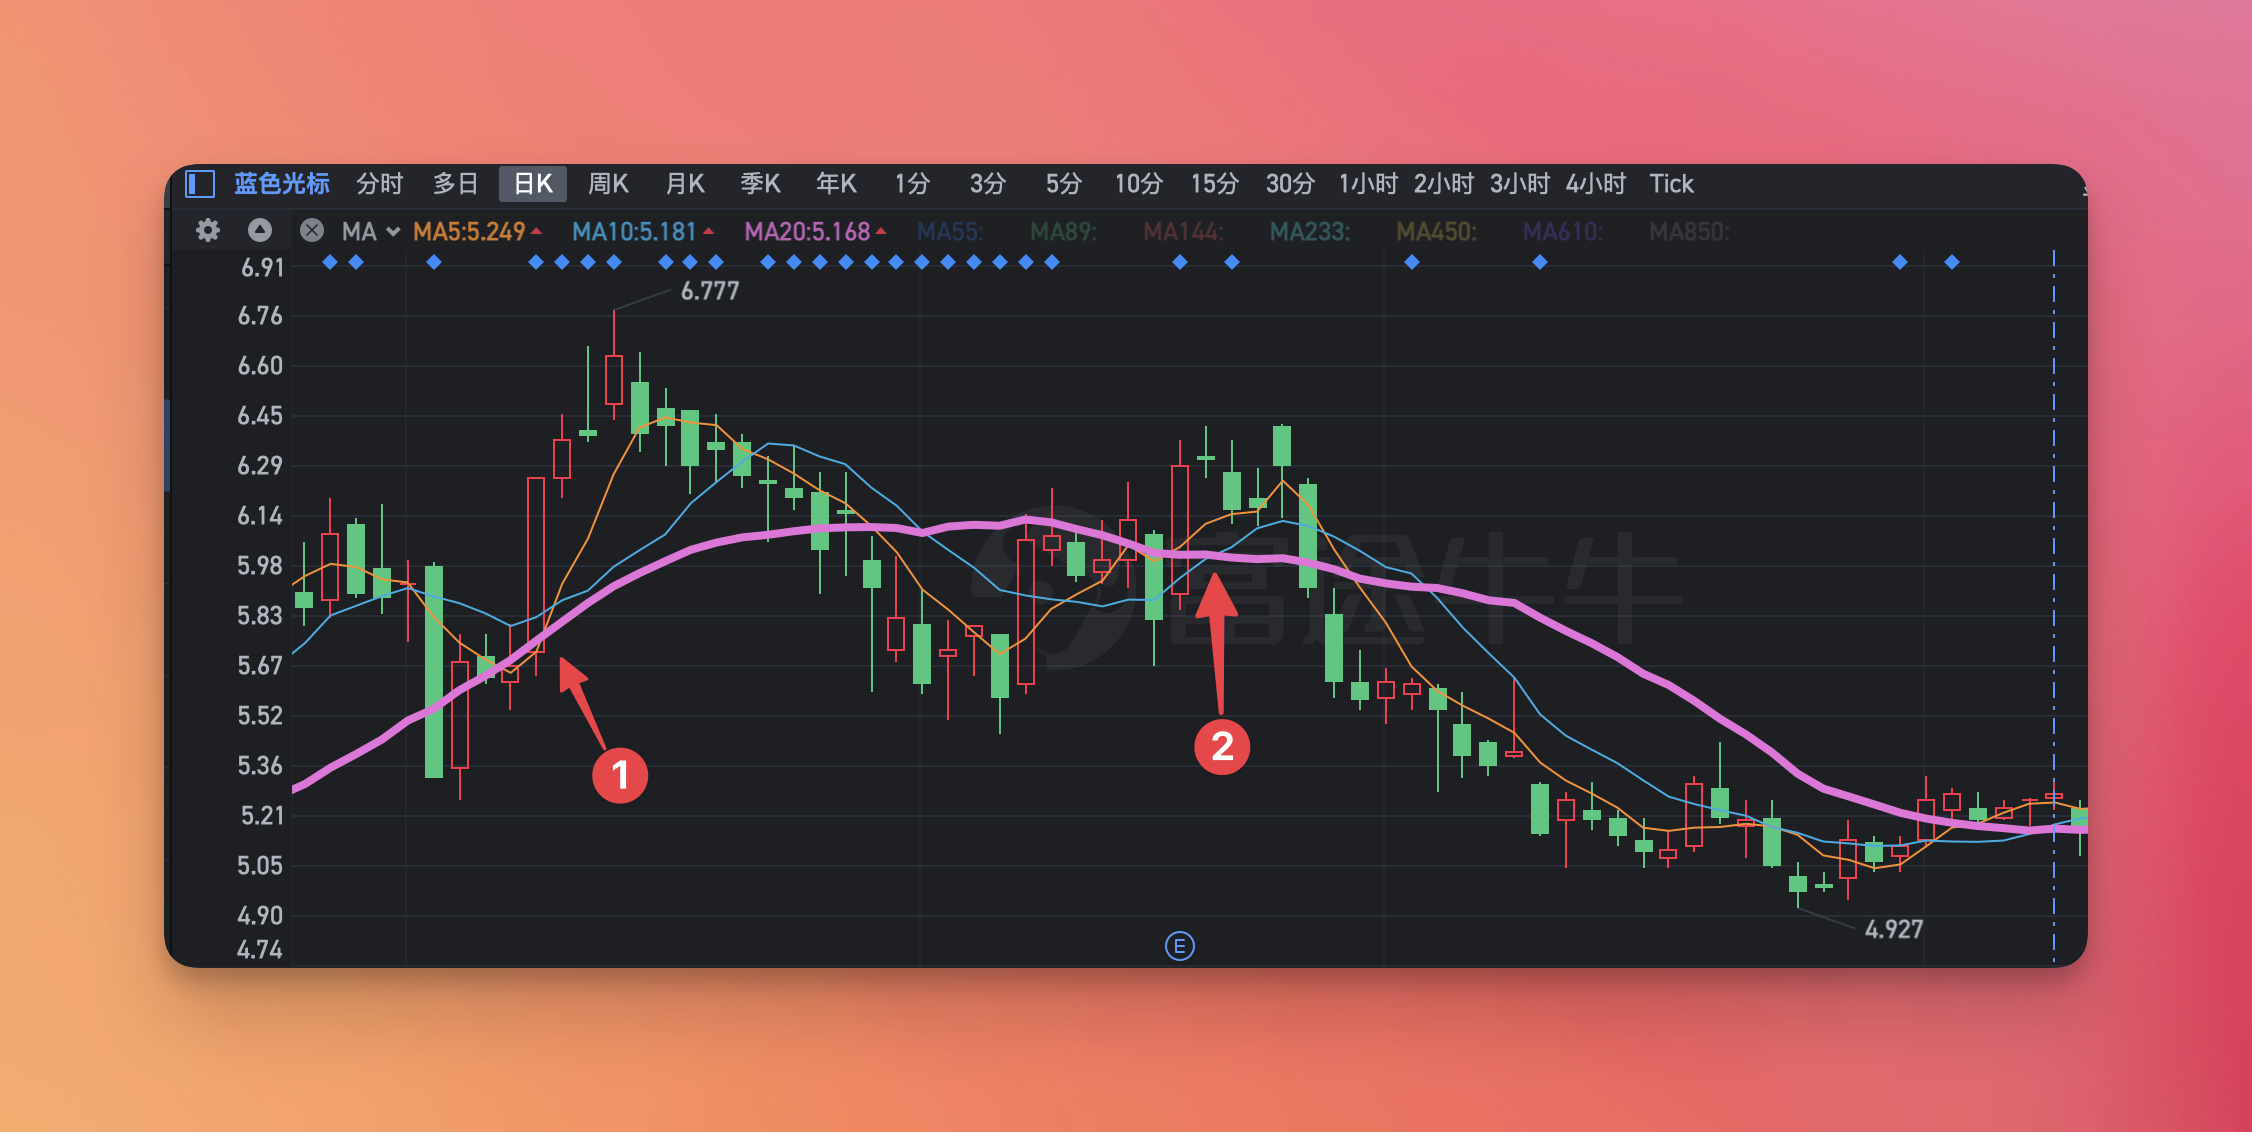
As shown in Figure 1 above, MA5 crosses MA20 from bottom to top, and the stock price also rises accordingly. This is a typical golden cross buying signal.
But sometimes this is not the case. For example, in the position in Figure 2 above, MA5 crosses MA20 from bottom to top, but the stock price did not rise, but fell. Because the long-term moving average MA20 is still downward at this time, we call this situation a false golden cross, and you cannot buy blindly.
Precautions
It is important to note that the moving average is a lagging indicator, meaning it is based on past data. Therefore, it cannot predict future prices, it can only provide an understanding of current market trends.
At the same time, no technical indicators can guarantee 100% accuracy, so when using moving averages, investors need to combine other technical indicators and market information. Here are some situations that can cause moving averages to fail:
shock market
In a volatile or sideways market, the stock price may frequently cross the moving average, causing the buying and selling signals generated by the moving average to fail. In this market environment, the moving average often produces many false signals, which makes investors buy and sell repeatedly, increasing transaction costs.
market news or emergencies
Major market news or emergencies, such as the company’s financial report release, sudden economic policy changes, large-scale market panic, etc., may cause stock prices to fluctuate sharply in a short period of time. In this case, the moving average may not be able to respond to these in time. Variety.
short-term extreme price volatility
If the stock price experiences extreme short-term fluctuations, such as large price fluctuations due to market manipulation or other unconventional behavior, the moving average may also fail, because it is calculated based on the average price of a past period of time and may not reflect this. extreme short-term changes.
Summarize
The moving average is a simple but effective technical indicator that can help investors better understand market trends and thus make better investment decisions. When using moving averages, investors need to pay attention to the following points:
- Moving averages are a trend indicator that can help investors better understand market trends.
- Moving averages are lagging indicators and cannot predict future prices.
- The choice of moving average needs to be determined according to the investor’s investment goals and investment cycle.
- The use of moving averages needs to be combined with other technical indicators and market information.
- The moving average may fail in situations such as shocking markets, market news or emergencies, and short-term extreme price fluctuations.
If you have any questions or suggestions after reading this article, please leave a message below, and I will reply in time.
This article is transferred from: https://blog.forecho.com/stock-indicators-ma.html
Only for personal collection, the copyright belongs to the original author
This article is reproduced from: https://shoucang.zyzhang.com/%E8%82%A1%E7%A5%A8%E6%8A%80%E6%9C%AF%E6%8C%87%E6%A0%87- %E7%A7%BB%E5%8A%A8%E5%B9%B3%E5%9D%87%E7%BA%BF%EF%BC%88ma%EF%BC%89%E6%8C%87%E6 %A0%87/
This site is only for collection, and the copyright belongs to the original author.