The third quarter of 2022 is over. The bad news is that this year is more and more like 2018. The good news is that the market for the next two years after 2018 is not bad. Instead of worrying about floating losses, it is better to look for targets that are currently more cost-effective. Although the high cost-effectiveness does not guarantee that the decline will be stopped immediately, there is historical experience to learn from, which can always warn us not to blindly operate.
The stock-bond spread model (also known as the FED model, FED is the Federal Reserve) is a more commonly used model for evaluating the cost-effectiveness of equity assets . market ‘s 10-year Treasury yield). It is usually negatively correlated with the trend of the index. When the stock index falls, it will rise, indicating that the cost performance of equity assets is increasing, and vice versa. The FED model is known as a “buying indicator”, and many investment institutions use it as a reference indicator for equity positions.
One More Thing
Many people have their own “imagination” on the relationship between cost performance and future earnings, and most people think that the two should be positively correlated. Instead of imagining it, you might as well quantify it: superimpose the index’s stock-bond price-performance curve and the next 1-year yield, and the relationship between the two will be clear. Since historical data cannot “deduce” the future, this data is up to one year ago.
Let’s take a look at the price-performance ratio of the four mainstream broad-based indices by the end of September (blue curve in the figure) and the yield in the next year (red curve). .
1. CSI 300
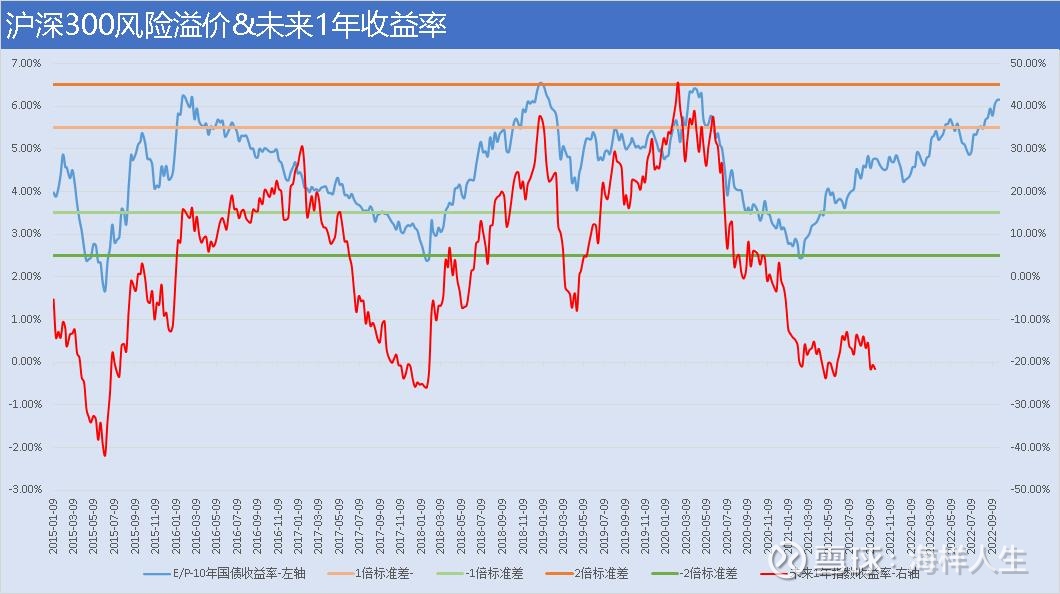
The CSI 300 is a blue-chip stock index. Its current price-performance ratio has exceeded 1 standard deviation above the mean, is approaching 2 standard deviations, and has clearly surpassed the level at the end of April this year, which is faster than the mainstream index. Yes, it means that the CSI 300 Index was pushed down again without much rebound from April to July.
The yield data of the CSI 300 Index in the next year and the price-performance data are generally positively correlated, especially the two peaks in 2018 and 2010, which are simply “God synchronization”. As of the end of September last year, the CSI 300 index’s one-year return rate has shown a bottoming feature, and friends who know technical analysis can predict the future departure time.
2. CSI 500
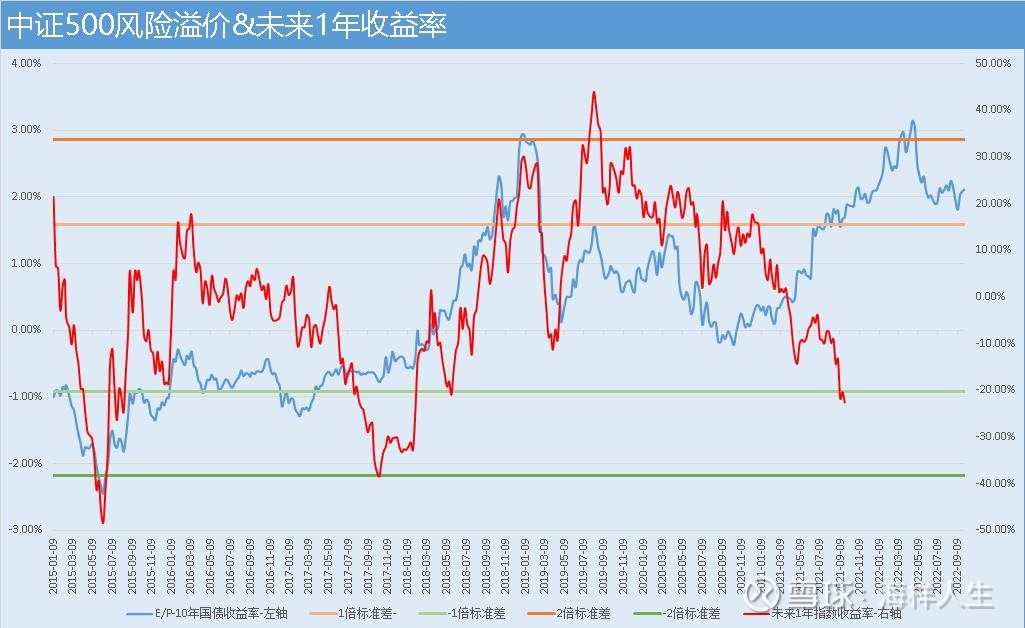
The CSI 500 is a mid-cap stock index. Its stock-bond price/performance ratio exceeded 2 times the standard deviation at the end of April. Looking back now, it is an excellent opportunity. Subsequently, the CSI 500 started a round of rebound, quickly digested the price-performance ratio brought by the sharp drop, and oscillated and “built a bottom” at a place close to 1 standard deviation. Today, its price-performance ratio is still above 1 standard deviation /3, which is still far from 2 standard deviations. The main reason is that the CSI 500 saw a relatively small decline in the third quarter, and coal made a larger contribution.
As of the end of September 2021, the yield rate of the CSI 500 in the next one year is still dropping, and there is no meaning to stop the decline. From the perspective of the falling pattern, the situation in 2021 is similar to that in 2017. Yes, this is actually referring to 2022 and 2017. The situation in 2018 was similar.
3. CSI 1000
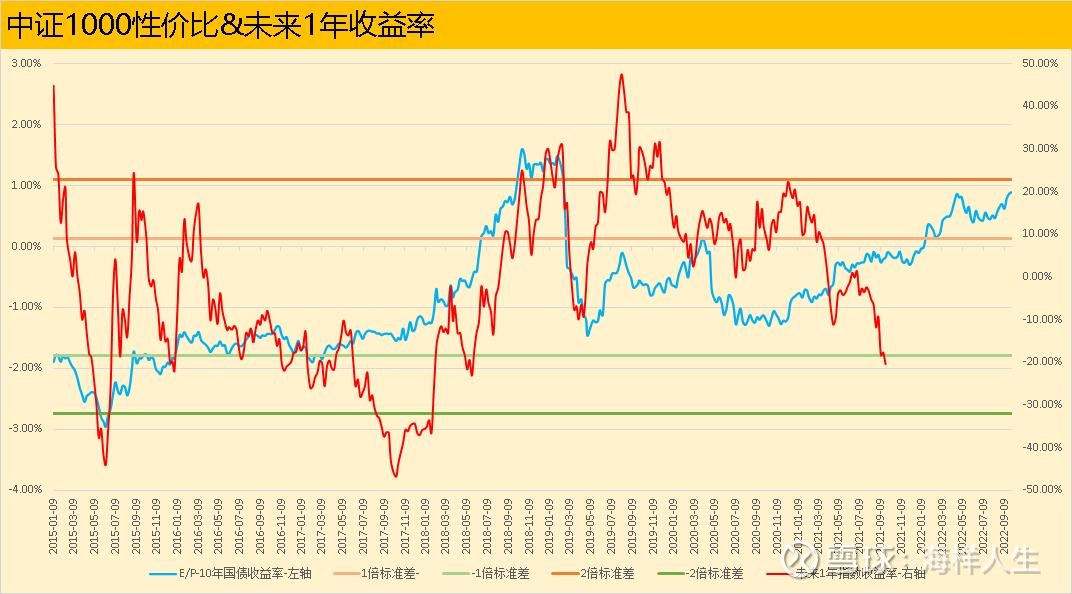
The CSI 1000 Index is a small and mid-cap index. Its current price-performance ratio has reached the position at the end of April, but it has not surpassed it significantly. This is all due to the decline in the third quarter. Although the price-performance ratio of the horizontal comparison between indices is not very “objective”, some “clues” can still be seen from the distance of 1 or 2 times the standard deviation from each other – the price-performance ratio of the CSI 1000 is above 1 times the standard deviation 2/ The position of 3 is closer to 2 times the standard deviation than the CSI 500 Index. From this perspective, currently, the CSI 1000 Index is more cost-effective than the CSI 500 Index.
As of the end of September 2021, the yield of the CSI 1000 Index in the next one year is still falling rapidly. Like the CSI 500 Index, there is no sign of a bottom yet.
4. National Certificate 2000
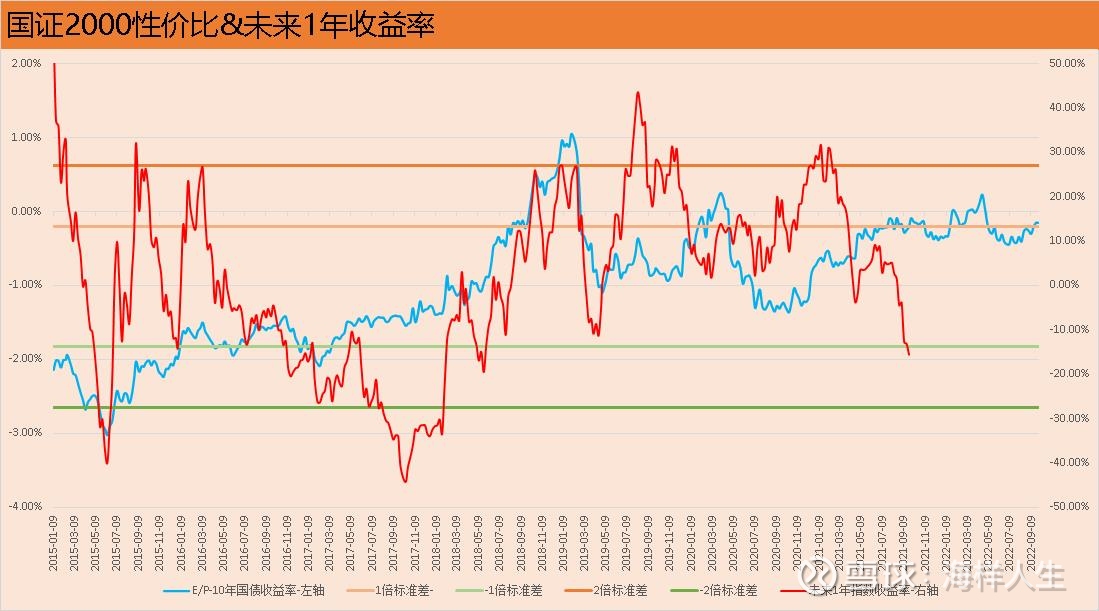
The National Securities 2000 is a small-cap stock index. From the perspective of cost performance, it has just passed 1 times the standard deviation from the bottom recently, there is still a gap from the level at the end of April, and there is almost “1 standard deviation from the positive 2 times the standard deviation.” Difference”. After the sharp drop at the end of April, the price/performance ratio is only in the middle of the standard deviation of plus 1 and plus 2 times, indicating that in recent years, the National Securities 2000 has not reached the level of extreme cost-effectiveness, and small-cap stocks have experienced a good few years. Time, which coincides with the “spring” market of blue-chip stocks from 2016 to 2018 has become a cycle.
As of September 24, 2021, the rate of return of the China Securities 2000 Index in the next one year is still falling rapidly, similar to the CSI 500 and CSI 1000, and there is no sign of a bottom yet.
Summarize
1. From the current index price performance data, only the CSI 300 is the closest to the plus 2 times standard deviation, and it is obviously more cost-effective than after the sharp drop in late April. Compared with its own history, the CSI 300 is currently very cost-effective, and there is still “space” for several other indexes. The reason for this space may be that the previous period has risen too much, or it may be that the performance decline has led to a rise in PE. .
2. The CSI 500, CSI 1000 and CSI 2000 indices have not stopped falling, making the index as of late September last year still have a rapid decline in the rate of return in the next year, while the index in late September last year did not have a price-performance ratio. big fluctuations. This shows that the correlation between the price performance of index stocks and bonds and the yield in the next year is still relatively high in extreme market conditions.
3. Some people say that the stock-bond spread model has now failed. In fact, the requirements for the model are too high. You must know that no model can accurately predict all market conditions. If there is, it must be in a dream. The FED model does not have much indicative role in normal times, but it can still be used as a reference in extreme market conditions, because the idea behind this model is that investors will adjust their investment decisions based on the relative price-performance ratio between major types of assets, and the adjustment will not be done every time. Every moment happens, you have to wait until the prosperity and decline, or the extreme prosperity, so the underlying logic of it is actually the periodic law.
Data source: wind, as of 20220930
This topic has 6 discussions in Snowball, click to view.
Snowball is an investor’s social network, and smart investors are here.
Click to download Snowball mobile client http://xueqiu.com/xz ]]>
This article is reproduced from: http://xueqiu.com/8529783827/232064015
This site is for inclusion only, and the copyright belongs to the original author.