#Be a quiet industry observer# #新Energy Vehicle# #BYD# $BYD(SZ002594)$ $BYD SHARES(01211)$ @Today’s topic @snowball creator center
At the beginning of July, I found that there is a set of data related to family-owned vehicles in 9-13 of the newly released “China Census Yearbook-2020”, which is very interesting. I will share it with you today. Through the three tables of the original data, the three derived tables and analysis are derived.
1. Statistical table and analysis
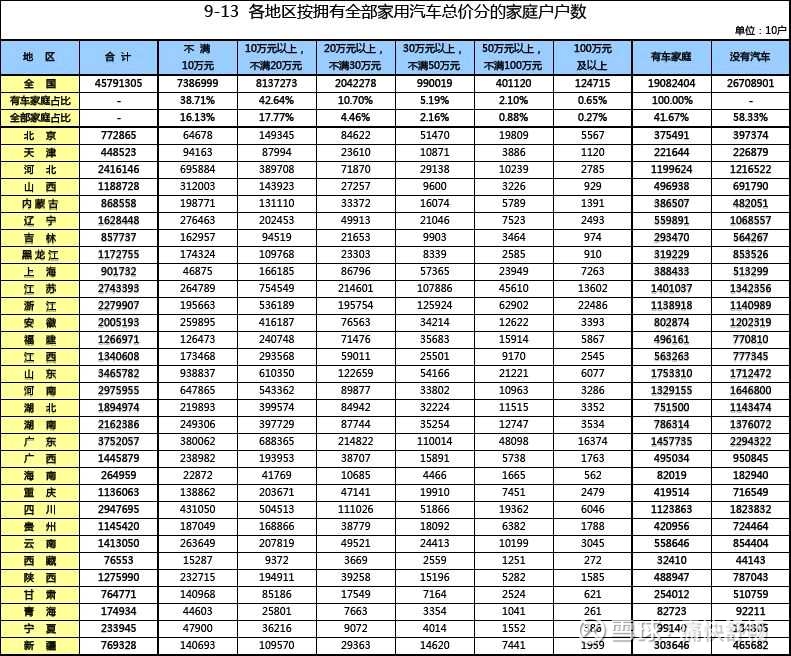
Let’s first look at the overall data of Form 9-13:

1. The number of households in the country is 457.9 million, of which 190,824,040 have cars, and about 41.67% of them own vehicles. This data is basically in line with the 200 million passenger car ownership announced in early 2022 ; no There are 267,089,010 car families, which is equivalent to 58.33% of the families are still car-free families , and this data is basically consistent with the data that Lao Wang said on the forum that 60% of the families are car-free families.
2. For car-owning families, the number of car-owning families in different price segments is also counted.
Vehicle price is less than 100,000 yuan: the total number of households is 73,869,990, accounting for 38.71% of households with cars and 16.13% of all households;
The price of vehicles is between 100,000 and 200,000 yuan: the total number of households is 81,372,730, accounting for 42.64% of households with cars and 17.77% of all households;
Vehicle price is less than 200,000-300,000 yuan: the total number of households is 20,422,780, accounting for 10.70% of the households with cars and 4.46% of all households;
The price of vehicles is between 300,000 and 500,000 yuan: the total number of households is 9,900,190, accounting for 5.19% of households with cars and 2.16% of all households;
The price of vehicles is between 500,000 and 1,000,000 yuan: the total number of households is 4,011,200, accounting for 2.10% of households with cars and 0.88% of all households;
The price of vehicles is more than 1 million yuan: the total number of households is 1,247,150, accounting for 0.65% of households with cars and 0.27% of all households.
To put it simply: taking the family as a unit, the price of owning a vehicle below 200,000 is the majority of Chinese families, accounting for about 81.35% of the family with a car, accounting for 33.9% of all families – and this is the Chinese passenger car. The current situation of the car market: 80% of Chinese people consume less than 200,000 passenger cars, and nearly 60% of families do not own their own cars.
Of course, if the price of your vehicle is more than 500,000 yuan, you are already the top 1% of the country’s top people – there are only 5.258 million such households in China.
If you own a vehicle with a price of more than 300,000 yuan, it accounts for about 7.94% of the households with a car and 3.31% of all households. It means that your family belongs to the top 5% in the whole country, and even if you are a family with a car, it belongs to the top 10% of “elite people” – there are only 15.159 million such families in China.
Even if the price of the vehicle you own is just over 200,000 yuan, it accounts for about 18.65% of households with a car and 7.77% of all households. It means that your family belongs to the top 10% in the whole country, and even the car-owning family belongs to the top 20% – there are only 35.581 million such families in China.
Well, after reading the first chapter table, let’s look at the second table derived from the general table.
2. Proportion of car-owning households by province and city

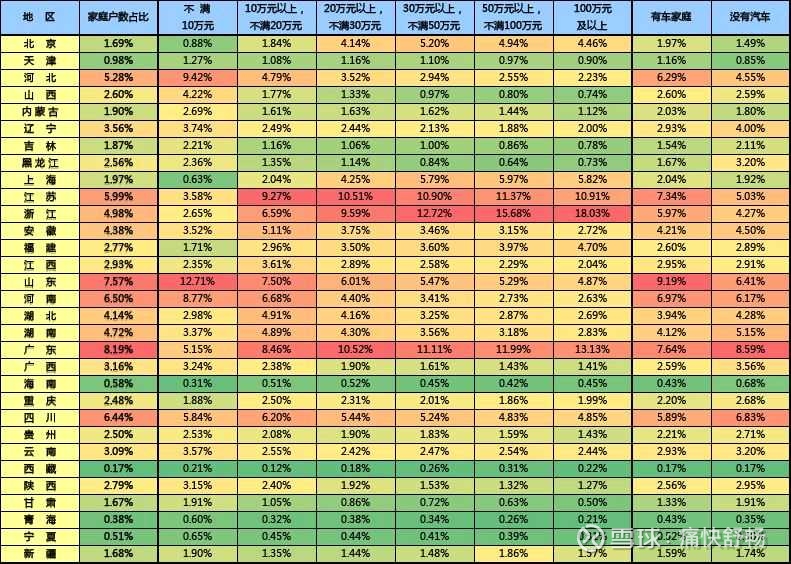
The second table is derived from the first table, and calculates the proportion of households in each province and city and the national proportion of car-owning households in each price segment.
Let’s look at the analysis next.
1. The proportion of households VS the proportion of households with cars: This data can clearly see the economic development status of different provinces
First, among the 31 provinces and cities in the statistics, Guangdong has the largest proportion of households, followed by Shandong, third in Henan, fourth in Sichuan, fifth in Jiangsu, and sixth in Hebei. The place is our large population/household province.
Second, Shandong has the largest proportion of households with cars, followed by Guangdong, the third is Jiangsu, the fourth is Henan, the fifth is Hebei, and the sixth is Zhejiang. It can be seen that Zhejiang stands out and once again shows that Zhejiang’s economy strength.
Third, according to the statistics of various provinces and cities, Guangdong, Zhejiang, and Jiangsu have the largest number of households with vehicles of more than 300,000 yuan, accounting for more than 10% (national share); Shanghai In three provinces and cities, Shandong, Sichuan and Beijing, the proportion of households with more than 300,000 vehicles is 5-6%.
In the traditional western Qinghai, Ningxia and Hainan, the proportion of households with more than 300,000 vehicles in the three provinces and cities is only less than 0.5%.
This also explains the economic and consumption power gap between the eastern coastal provinces and cities and the central and western provinces and cities.
Fourth, the highest proportion of car-free households is Heilongjiang, the second is Hainan, the third is Gansu, the fourth is Jilin, the fifth is Guangxi, and the sixth is Liaoning. The proportion of car-free households in the three eastern provinces is the highest in the country, which also shows the economic situation of the three eastern provinces.
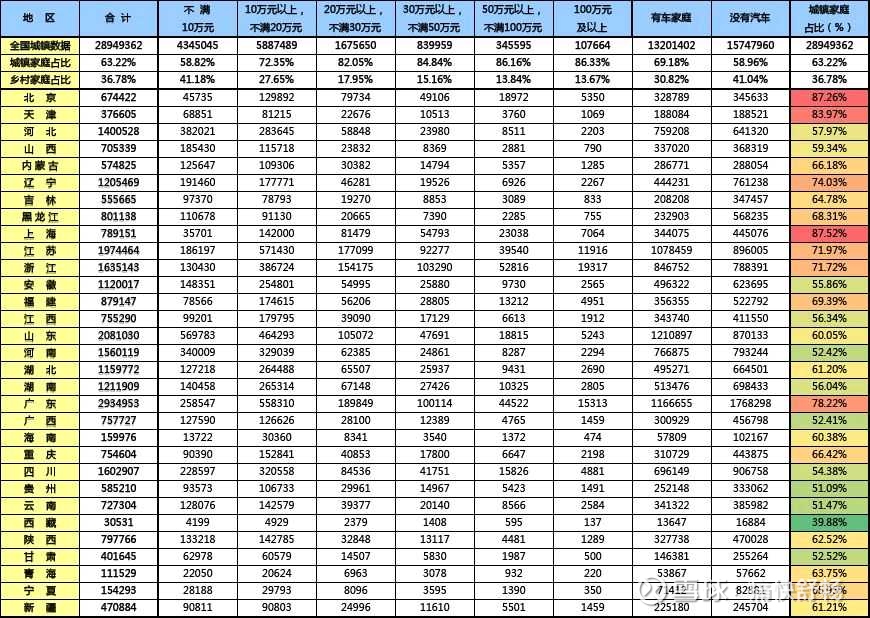
3. According to the statistical data of towns and villages, we can get a glimpse of the more real data of our country’s urbanization

According to the data, the urbanization rate of my country’s resident population in 2020 is 63.89%, and statistics on the number of households show that urban households account for 63.22%. It has basically entered the middle and late stage of urbanization.
First, the three cities with the highest proportion of urban households are: Shanghai 87.52%, Beijing 87.26% and Tianjin 83.97%. These three municipalities are basically in the final stage of urbanization (simply put, they are not suitable for ordinary people to enter. );
Second, cities where urban households account for more than 70% are: Guangdong 78.22%, Liaoning 74.03%, Jiangsu 71.97%, and Zhejiang 71.72%. These four major provinces will become the core drivers of China’s economy (not just the urbanization rate). , as well as the economy, industry, etc. have very great potential for development).
Third, cities where urban households account for less than 60% are: Tibet 39.88%, Guizhou 51.09%, Yunnan 51.47%, Henan 52.42%, Gansu 52.52%, Sichuan 54.38%, Anhui 55.86%, Jiangxi 56.04%, Hebei 57.97% And Shanxi 59.34%. Of these ten provinces, apart from the remote areas, Henan, Anhui, and Sichuan also have great potential for development, especially Sichuan and Anhui.
4. Provinces and cities with the highest and worst proportions over 300,000

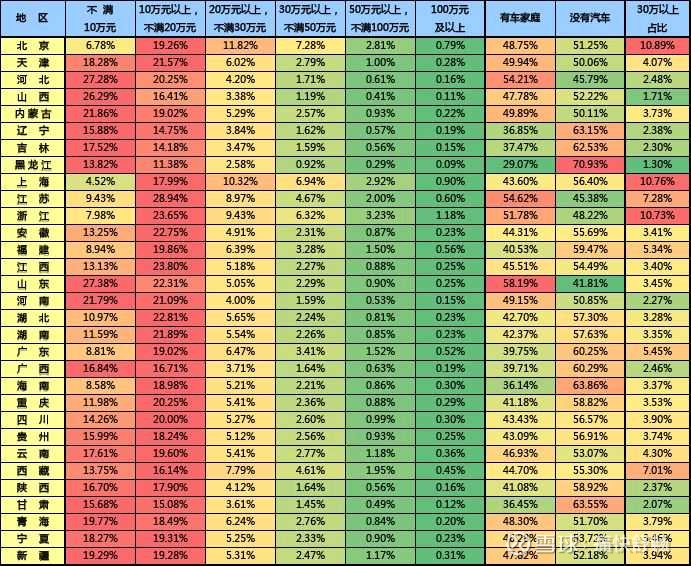
Taking the families with cars as the benchmark, according to the internal structure ratio of each province and city, very interesting data can also be seen.
First, the provinces and cities with the highest proportion of more than 300,000 (internal structure of provinces and cities) are: Beijing 10.89%, Shanghai 10.76%, Zhejiang 10.73%, these are also three provinces and cities with a share of more than 10%, which means that at least 10% of the Families with cars own vehicles worth more than 300,000 yuan.
Secondly, the proportion of provinces and cities in 5-10% are: Jiangsu 7.28%, Tibet 7.01%, Fujian 5.34%, Guangdong 5.45%. Among them, although Guangdong has the second largest absolute number of households with more than 300,000 vehicles, due to the huge number of households, the structure does not account for a small proportion; while Fujian is just the opposite, with a small proportion of the population, and the absolute number of households with more than 300,000 households The proportion is not much, but from the structural point of view, everyone is generally in a good economic situation.
Second, the provinces and cities with the least proportion of more than 300,000 are: Heilongjiang 1.30%, Shanxi 1.71%, these are the only two provinces that account for less than 2%. In particular, the proportion of 300,000 in Shanxi is basically different from the influence of coal bosses + luxury cars that the general public recognizes. In fact, ordinary people are not that rich.
Third, the provinces and cities with the highest proportion of less than 100,000 yuan are: Shandong 27.38%, Hebei 27.28%, Shanxi 26.29%, Inner Mongolia 21.86%, and Henan 21.79%. These five provinces and cities are not only large agricultural provinces, but also ordinary people. It is no wonder that Shandong and Henan are big provinces for “Old Man Le” sales – economical and affordable are their best choices.
write at the end
1. From the economic census data, it can be seen that the number of households with more than 300,000 households is only 15.159 million, accounting for 7.94% of all households with cars.
2. According to the data of the Passenger Federation, from 2019 to 2021, the proportion of new car sales of more than 300,000 will be divided into 10.7%, 13.1%, and 13.2% (the cumulative sales volume in three years is about 7 million), which is significantly higher than The proportion of households, of course, many high-value vehicles are purchased by companies. But for such a vast and complex market as China, the total ceiling of high-priced models still exists.
3. In the past two years, many independent brands have been promoting high-end products, which are essentially inseparable from the background of two times: first, China’s per capita GDP has exceeded the $10,000 mark, which is essentially the accumulation of wealth of ordinary people in China. Accelerate; second, the current main passenger car consumers are 30-45 year olds, who are at the peak of their lives in terms of income and purchasing power.
4. In the future, if Chinese brands want to hit the higher price segment, on the one hand, it is still inseparable from the increase in the wealth and income of ordinary people. Anything that is considered high-end without the macro background and preconditions will be a gain in water. It’s just looking at flowers in the mirror; on the other hand, it depends on whether it can go out from China and truly enter the global market.
This topic has 10 discussions in Snowball, click to view.
Snowball is an investor’s social network, and smart investors are here.
Click to download Snowball mobile client http://xueqiu.com/xz ]]>
This article is reproduced from: http://xueqiu.com/5436386345/225049938
This site is for inclusion only, and the copyright belongs to the original author.