Original link: https://icyleaf.com/2023/08/using-vector-transform-mosdns-logging-to-grafana-via-loki/

I started using mosdns from version 4.0, and it seems to have stabilized after experiencing the unstable function updates of 4.1 and 4.2 and the refactoring of the 5.x major version released in January this year.
Thanks to @river_leaves , use the prometheus metrics interface that comes with mosdns to check the DNS resolution in real time.
The rules in the configuration are flexible and sometimes difficult to debug. In order to verify whether the configuration rules are valid and visualize the domain name access frequency, I start with the mosdns log itself. The tools needed are vector, prometheus, loki and grafana.
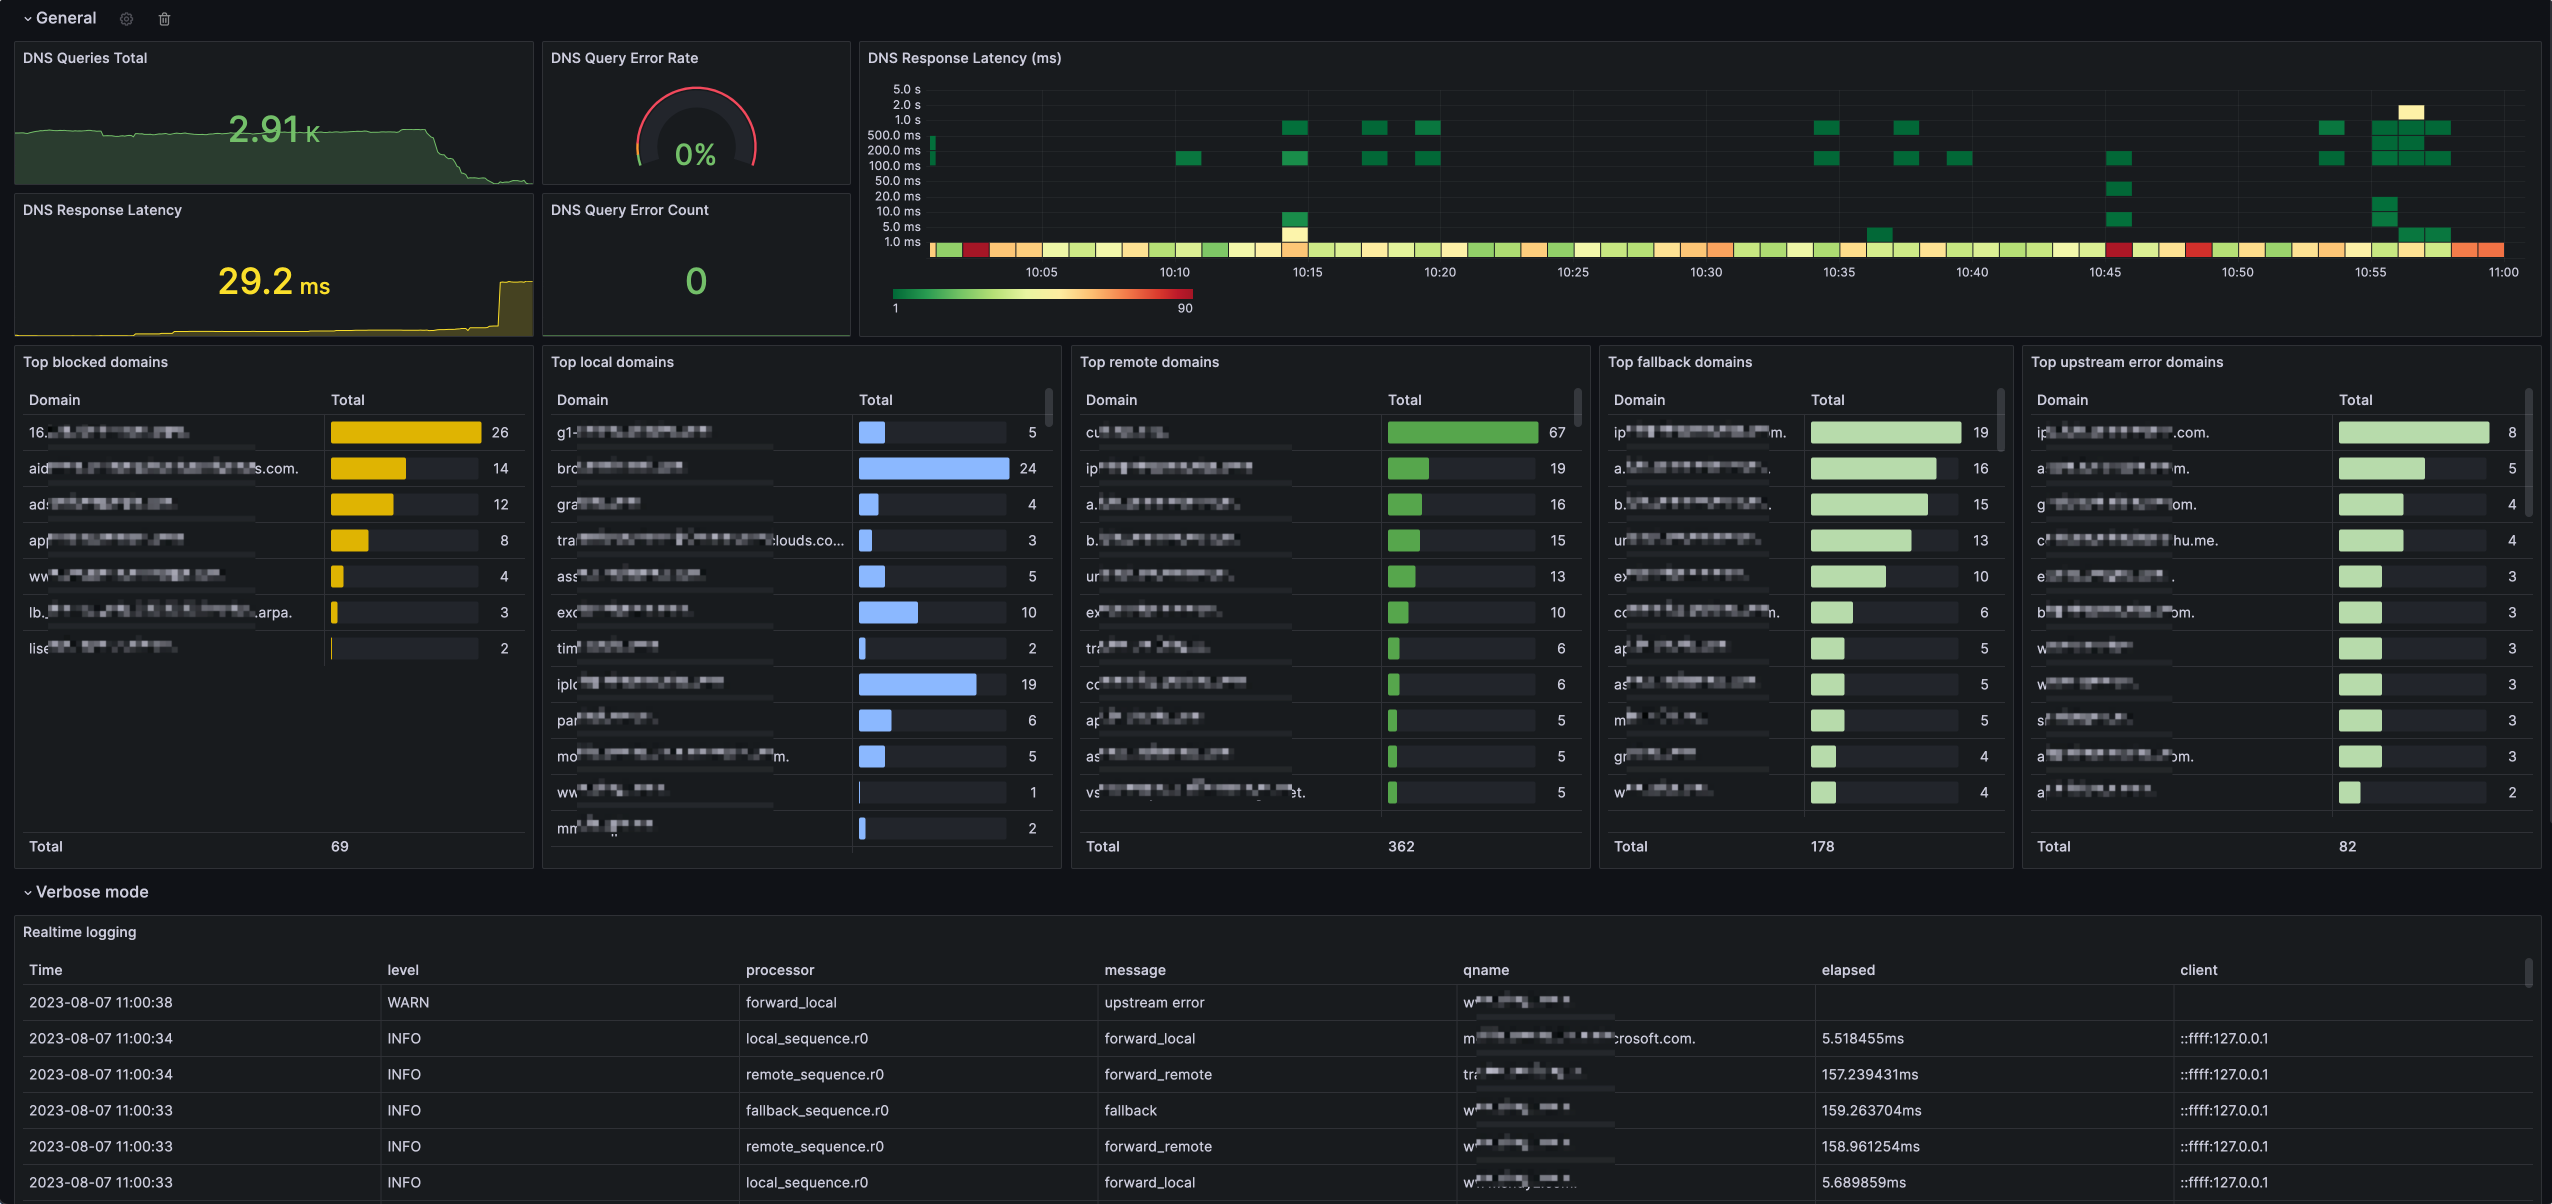
Real-time monitoring mosdns rules analysis Grafana Kanban
The current tutorial is only applicable to mosdns 5.0 ~ 5.1.3 versions (subsequent versions are not released, there may be configuration changes, adjust according to the actual situation)
mosdns
The mosdns 5 version adopts the new data source unpacking format , I am too lazy to adjust the configuration, and directly use the luci-app-mosdns plug-in configuration fine-tuning. Please make sure not to modify or change the name of each plugins in the configuration, otherwise the vector conversion rules will not work properly.
If you can’t see the configuration file below, send it to the direct elevator .
The configuration defines the file path of the mosdns log as /var/log/mosdns.log , and the output log level only needs to be INFO. If the disk space where the mosdns service is located is small, it is recommended to use logrotate to cut the log and control the number of archived logs to avoid insufficient space.
1 / var / log / mosdns.log { 2 daily 3 rotate 2 4 compress 5 missingok 6 notifempty 7 }
vector
Vector is a log collection tool that can collect from multiple sources (Source), transform (Transform) and push to the next sink (Sinks).
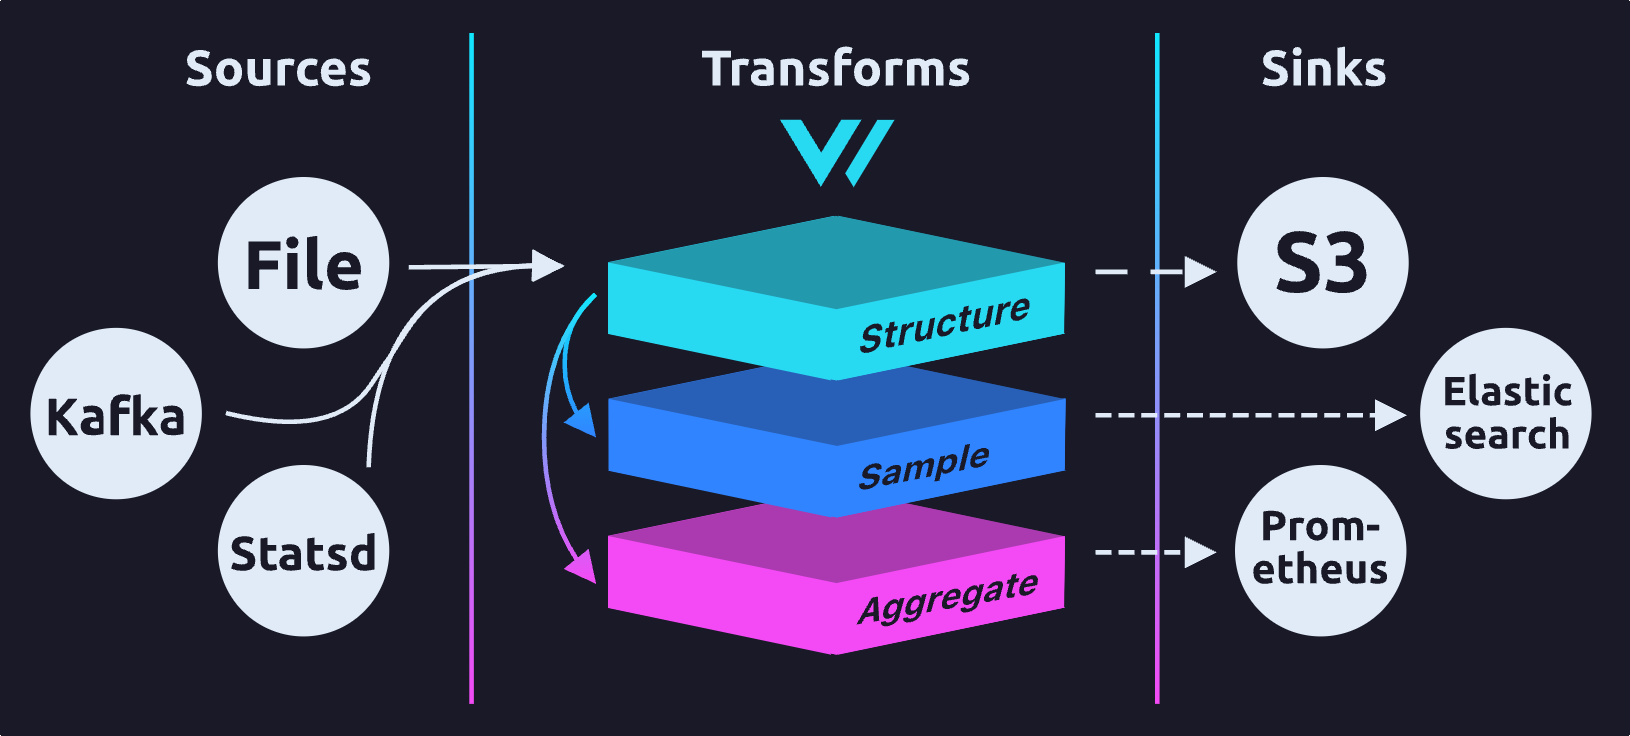
vector requires direct access to the mosdns log files. There are two ways to achieve this: one is to run both services on one machine, and the other is to share the volume through containerization so that vector can read mosdns logs.
The tool itself is developed in Go language. Download the corresponding package directly from Github and decompress it, and then you can use it or use the one-click installation script:
1 curl --proto '=https' --tlsv1.2 -sSf https://sh.vector.dev | bash
Openwrt/Immortalwrt users can use my personally maintained warehouse icyleaf/openwrt-dist to add and install (supports snapshot and 23.05.0-rc3 branches of amd64 and armv8 platforms):
Add repository key
1 wget http://cdn.jsdelivr.net/gh/icyleaf/openwrt-dist@master/key-build.pub 2 opkg-key add key-build.pub
Modify the source address according to the different openwrt platforms
 1 # 源规则2 # src/gz icyleaf https://icyleaf-openwrt-repo.vercel.app//packages/ 3
4 # 添加snapshot 分支amd64 (x86/64) 平台的源5 echo "src/gz icyleaf https://icyleaf-openwrt-repo.vercel.app/snapshot/packages/x86/64" >> /etc/opkg/customfeeds.conf
install vector
1 opkg update 2 opkg install vector
Modify the configuration file of /etc/vector/config.yml as follows
 1 data_dir : /tmp/vector
 2
 3 sources :
 4  mosdns-log-file :
 5    type : file
 6    include :
 7      - /var/log/mosdns.log
 8    read_from : beginning
 9
10 transforms :
11  mosdns-input :
12    type : filter
13    inputs :
14      - mosdns-log-file
15    condition : |
16 .file == "/var/log/mosdns.log"
17
18  mosdns-data :
19    type : remap
20    inputs :
21      - mosdns-input
22    drop_on_error : true
23    source : |
24 .type = "mosdns" 25 .app = "mosdns" 26 del(.host) 27 del(.file) 28 del(.source_type) 29
30 message_parts = split!(.message, r'\t') 31
32 .timestamp = parse_timestamp!(message_parts[0], format: "%FT%T%.9fZ") 33 .level = message_parts[1] 34
35 if (length(message_parts) == 6) { 36 .plugin = message_parts[2] 37 .processor = message_parts[3] 38 .message = message_parts[4] 39
40 if (exists(message_parts[5])) { 41 .metadata = parse_json!(message_parts[5]) 42 . = merge!(., .metadata) 43 del(.metadata) 44 } 45 } else { 46 .processor = message_parts[2] 47 .message = message_parts[3] 48
49 if (exists(message_parts[4])) { 50 .metadata = parse_json!(message_parts[4]) 51 . = merge!(., .metadata) 52 del(.metadata) 53 } 54 } 55
56 if (exists(.query)) { 57 query_parts = split!(.query, r'\s') 58 .domain = query_parts[0] 59 .record = query_parts[2] 60 .address = query_parts[5] 61 }
62
63 sinks :
64  # 同步到loki,根据实际情况修改endpoint 的值
65  loki :
66    type : loki
67    inputs :
68      - mosdns-data
69    endpoint : 'http://10.10.10.2:3100'
70    encoding :
71      codec : json
72    labels :
73      app : ''
74      type : ''
75    healthcheck :
76      enabled : true
77
78  # 临时输出转换数据到vector 控制台(生产环境请禁用)
79  debug_mosdns :
80    type : console
81    inputs :
82      - mosdns-data
83    encoding :
84      codec : json
Run the vector service (run after deploying loki)
For non-openwrt users
1 vector --config /etc/vector/config.yml --watch-config --verbose
openwrt users use
 1 $ /etc/init.d/vector start 2
3 Loaded with warnings [ "/etc/vector/config.yml" ] 4 ----------------------------------------------- 5 √ Component configuration 6 √ Health check "loki" 7 √ Health check "vector" 8 ----------------------------------------------- 9 Validated
The vector service using the openwrt plug-in will monitor the configuration file changes and reload, and there is no need to restart the service repeatedly when adjusting later.
prometheus
Prometheus is a monitoring data service that can be used as a Grafana data source. Refer to the official tutorial for installation. The configuration file needs to add the mosdns metrics address (for example, 10.10.10.1:8338) to the prometheus.yml file:
 1 global: 2 scrape_interval: 1m 3 evaluation_interval: 1m 4
 5 scrape_configs: 6 + - job_name: mosdns 7 + scrape_interval: 5s 8 + # scrape_timeout: 10s 9 + 10 + # metrics_path: /metrics 11 + static_configs: 12 + - targets: 13 + - 10.10.10.1:8338
loki
loki is a log aggregation service, which is also developed by Grafana and can be used as a Grafana data source. Loki and Grafana can be deployed by referring to the official documents . The only thing to pay attention to is to download the loki configuration file in advance. After deployment, update the loki address to the above vector configuration.
grafana
Grafana is a data visualization tool. For installation, see the loki section. Existing services are skipped directly.
The configuration of the Dashboard Kanban is very simple. After adding the data sources of prometheus and loki, import the mosdns v5 Kanban and configure it according to the diagram.
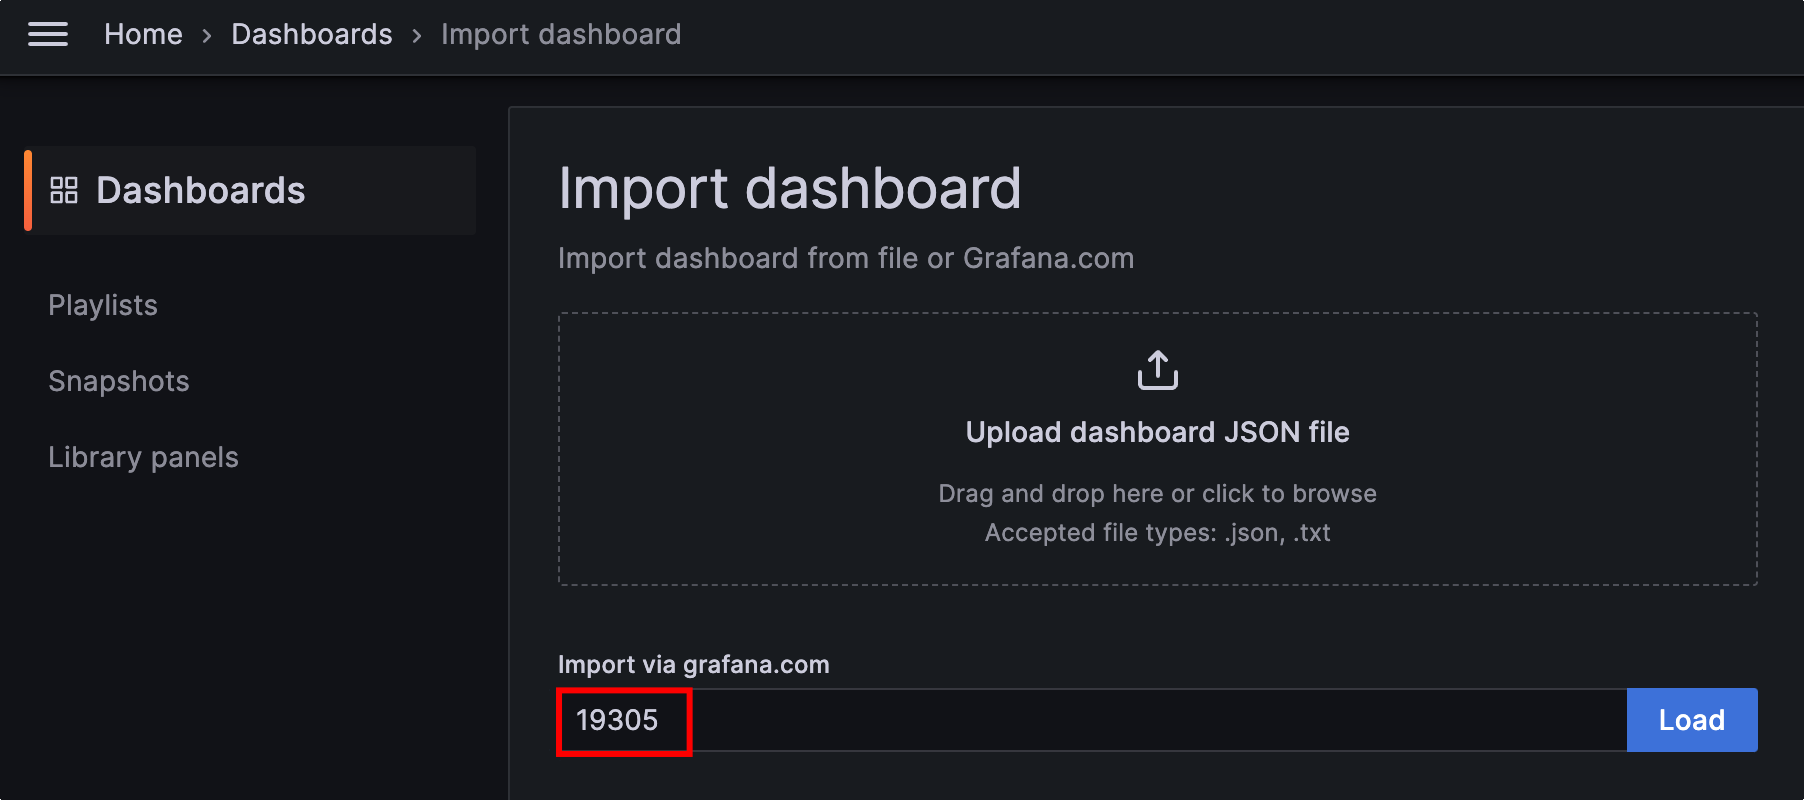
Grafana imports Dashboard Kanban
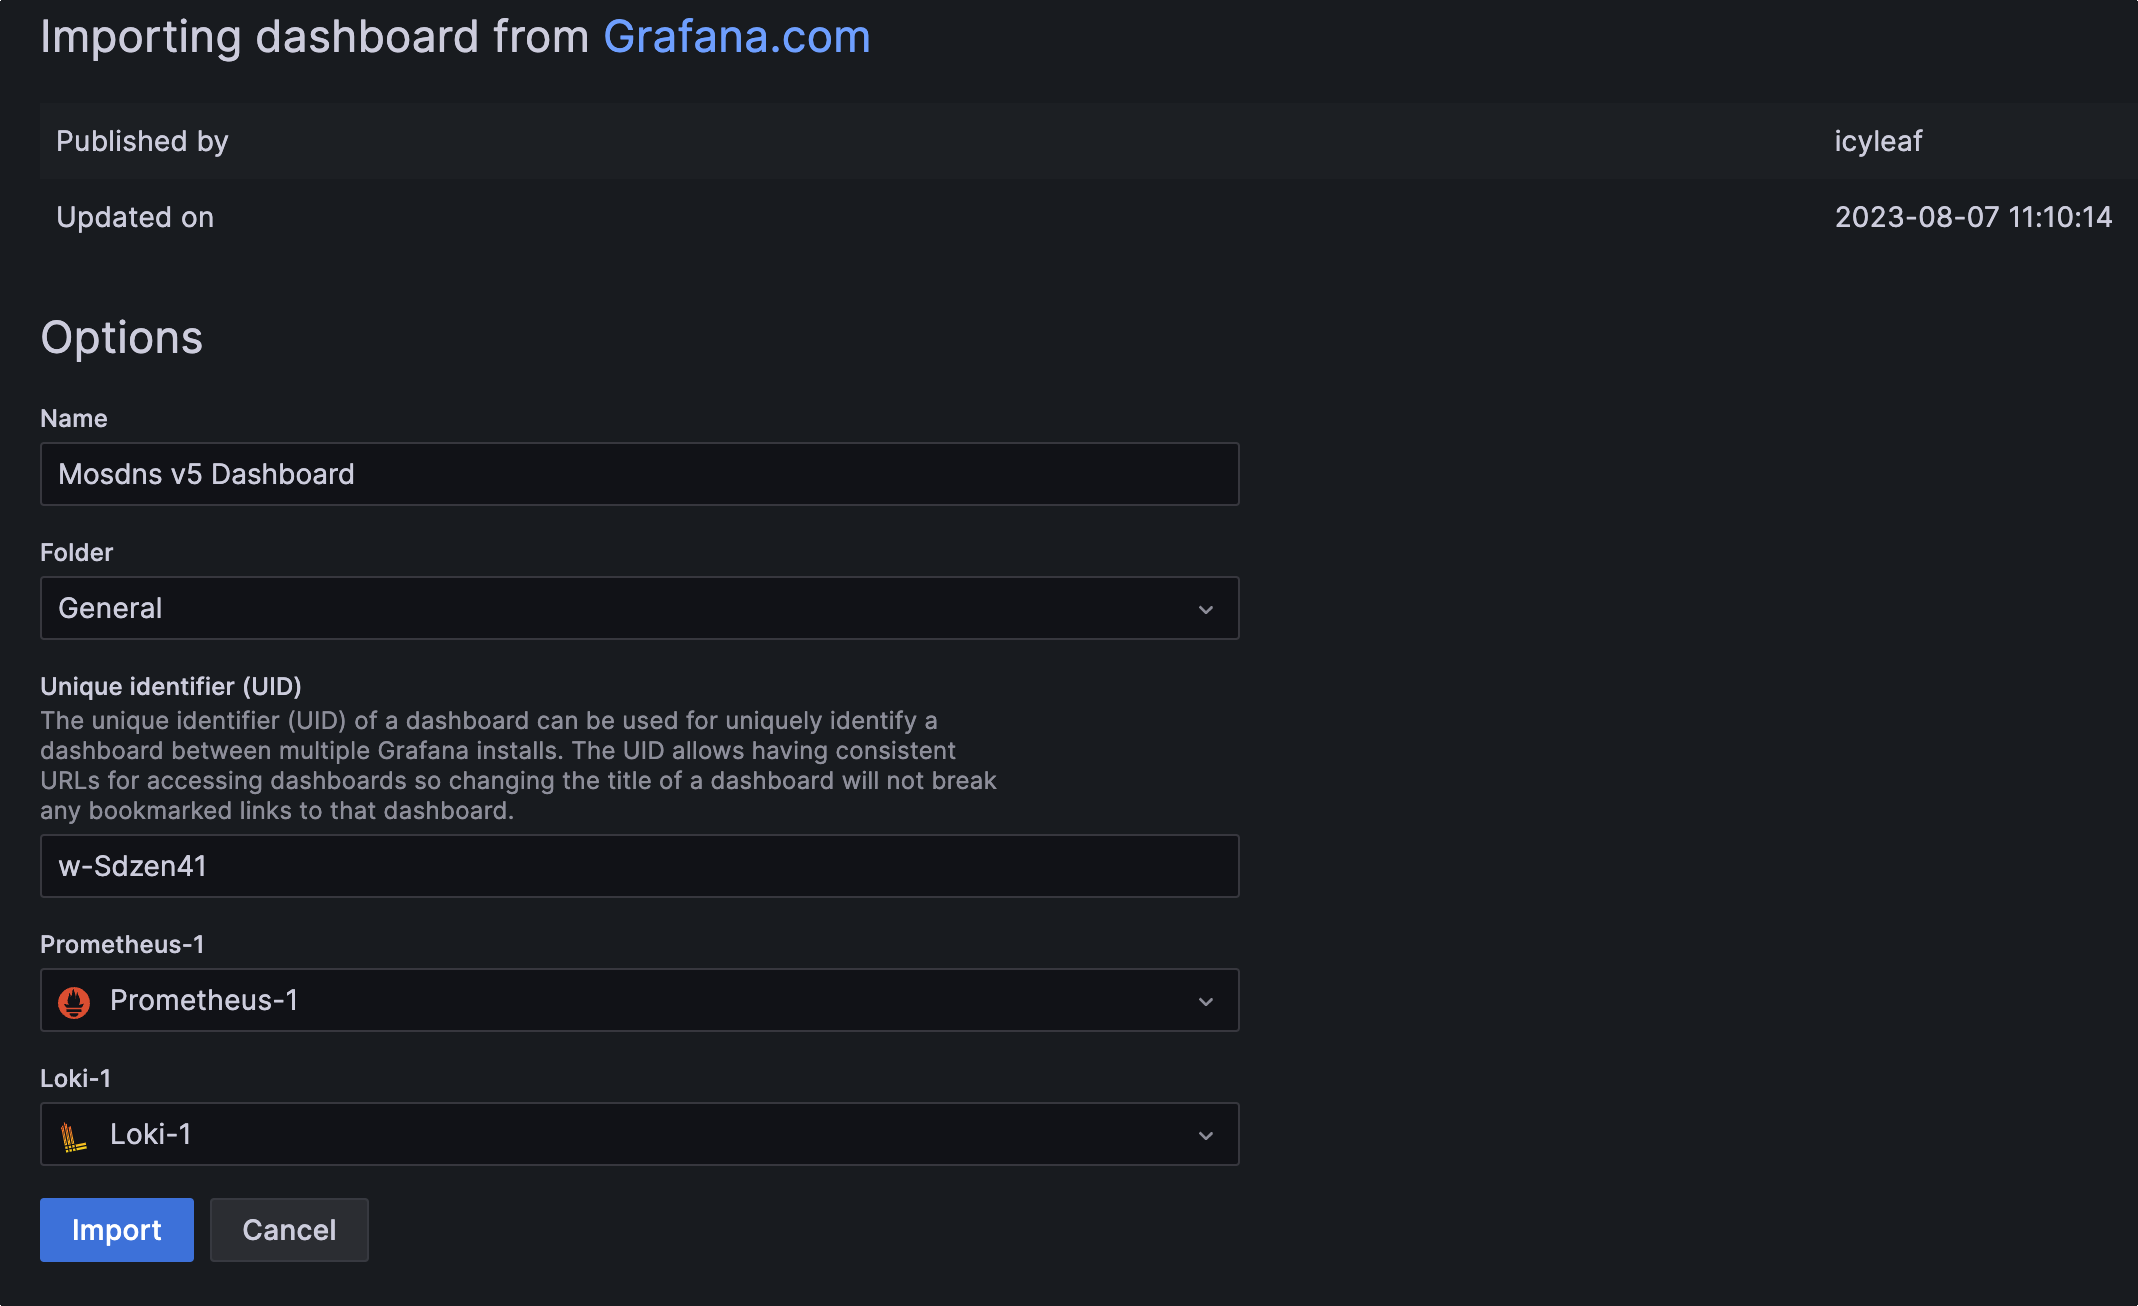
Grafana configuration data source
epilogue
Thanks to mosdns for months of stable configuration, the pits dug before have been filled, Sahua!
This article is transferred from: https://icyleaf.com/2023/08/using-vector-transform-mosdns-logging-to-grafana-via-loki/
This site is only for collection, and the copyright belongs to the original author.