Features of the historical bottom of A shares :
1. The dividend yield of CSI 300 is higher than the yield of treasury bonds
The current dividend yield of CSI 300 is 3.08%, which is infinitely close to 3.12% on January 3, 2019, which is already higher than the 10-year government bond yield of 2.756%. Although the index point has not hit a new low in April, the valuation It hit a new low because with the announcement of corporate quarterly reports, overall corporate profits and dividends are increasing, so even at the same point, valuations are not the same.

Second, the proportion of broken net:
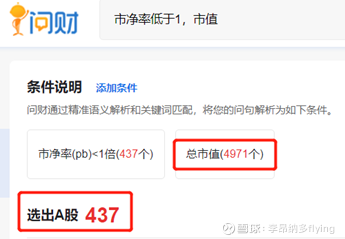
Breaking the net means that the total market value is lower than the net assets, and the proportion of breaking the net is the number of companies that break the net ÷ the number of listed companies

As of September 28, 2022, there have been 437 net-breaking shares, second only to March 2020 and greater than January 2019. The current total number of listed companies is 4,971, accounting for 8.8% of the net-breaking shares.

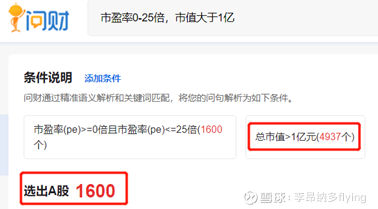
3. The price-earnings ratio is 0-25 times:

A company with a price-earnings ratio below 25 times, if all profits are used for dividends, the dividend rate will exceed 4%, which is higher than the US bond interest rate and has a certain investment value. The number of companies with a current price-earnings ratio of 0-25 times is 1600, accounting for 1,600. 32%, second only to March 2020 and June 2005.

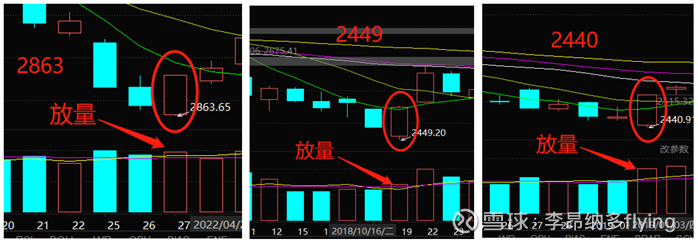
In addition to the slightly lower proportion of the above three points, the other two are in line with the characteristics of the bottom, and they are getting closer and closer to the real bottom. Historical bottoms are usually “W” double bottoms or triple bottoms. 2863 can be defined as The left foot of “W” will appear on the right foot of “W” in the next few weeks. If this foot can appear in the form of “low opening and high walking, and heavy volume of Changyang “, then it can basically confirm the bottom of the big level, and in the coming year A bull market can be expected.

Worker: Leonardo
$ Shanghai Index (SH000001)$ $ CSI 300 (SH000300)$ $ ChiNext Index (SZ399006)$
#Shanghai Composite Index# #3000 point defense battle# #Where is the bottom#
There are 19 discussions on this topic in Snowball, click to view.
Snowball is an investor’s social network, and smart investors are here.
Click to download Snowball mobile client http://xueqiu.com/xz ]]>
This article is reproduced from: http://xueqiu.com/3314653876/231807158
This site is for inclusion only, and the copyright belongs to the original author.