Key points of this article:
1. The Sharpe ratio is the excess return that can be generated for each unit of total risk taken
2. The larger the value, the better. It is meaningless to compare when the value is negative.
3. The Sharpe ratio is historical data. When selecting a base, the next step cannot be guided simply by the Sharpe ratio.
4. Of course, historical data is still very meaningful. If it was not done well in the past, it is difficult to expect how good it will be in the future, but it is necessary to look at it comprehensively.
Text :
Three classic indicators for comprehensive consideration of risk and return in the fund industry: the Treynor ratio, the Jensen index, and the Sharpe ratio. excess return per unit of risk.
Let’s take a look at the definition and current situation of the Sharpe ratio in detail. Let’s analyze whether the Sharpe ratio is reliable?
The Sharpe ratio
1. Explanation of terms
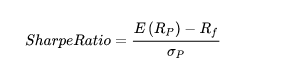
The Sharpe ratio of a portfolio over a certain period of time is expressed by the formula:
(annualized rate of return – risk-free rate) ÷ standard deviation of the portfolio
Take a look at the numerator and denominator:
(1) Molecule:
E(Rp): The annualized rate of return, which is more common, is the return of the portfolio.
Rf: The risk-free interest rate is based on the yield of 10-year treasury bonds, and some with 1-year time deposits.
(2) Denominator:
σp: The standard deviation of the investment portfolio is the volatility of the portfolio, and it is the variation range of the portfolio return from the average return, which can be simply understood as risk.
From the above, we can know that the denominator is the risk, the numerator is the return after removing the risk-free interest rate, and the combination of the two is the excess return under the unit risk.
In short, it is how much excess return can be generated for each unit of total risk taken.
2. Features
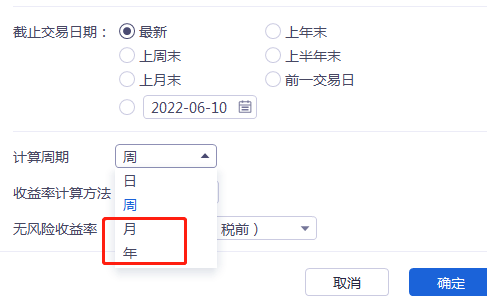
(1) Sharpe ratio General software can choose day, week, month, year, it is more common to use the monthly Sharpe ratio and the annual Sharpe ratio.
(2) In the same category, a higher Sharpe ratio indicates a better fund performance. Sorting by size doesn’t make sense when the Sharpe ratio is negative.
The theoretical basis for this comparison comes from: under the same risk, the investment return of the high Sharpe ratio portfolio is greater than that of the low Sharpe ratio fund portfolio.
For example: in the same category, in the same period, the return rate of Fund A is 25%, and the standard deviation is 5%; the return rate of Fund A is 45%, and the standard deviation is 5%; the risk-free interest rate is 5%; according to the above formula, it can be calculated Fund A has a Sharpe ratio of 4 and Fund B has a Sharpe ratio of 8, and Fund B has a better risk-adjusted return than Fund A.
(3) The Sharpe ratio is a historical indicator and cannot predict the future. It is not simply based on the historical performance of the fund’s Sharpe ratio for future operations.
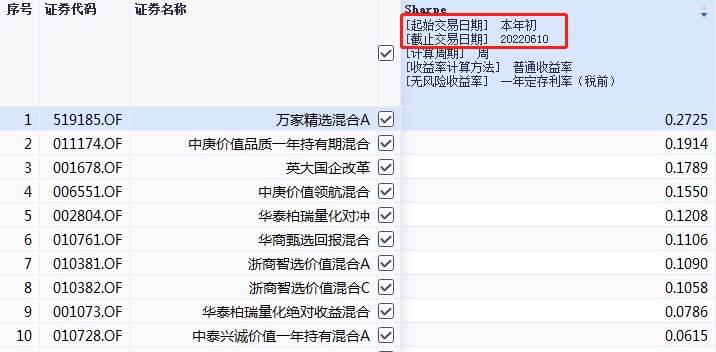
For example, this year, among the common stock and partial stock mixed funds, Wanjia Select has the highest Sharpe ratio. The top ten funds in the Sharpe ratio are shown in the figure below, and they are value-oriented as a whole.
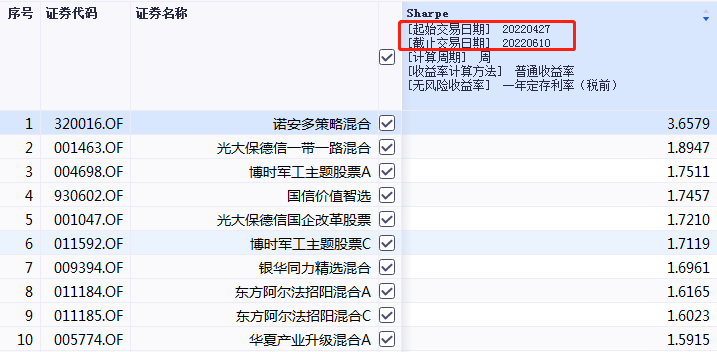
And since the rebound of 0427, the highest Sharpe ratio so far is the Noando strategy mix. The top ten funds in the Sharpe ratio are shown in the figure below. The overall view is that they are growth-oriented.
Through the above comparison, it is mainly to illustrate that the Sharpe ratio cannot simply be used to guide the next operation when selecting a base.
Of course, historical data still has a certain meaning. It has been poorly done in the past, and it is difficult to expect how good it will be in the future, but it must be looked at comprehensively.
To sum up, relatively speaking, the bigger the Sharpe ratio, the better. The Sharpe ratio is an indicator of past performance, and it is not recommended to directly use it to guide future operations.
@Today’s topic @雪ball talent show @雪ball creator center @ETF star push officer @雪ball fund @ #continue to rise! China concept stocks are soaring against the trend # #Afraid of chasing high and afraid of stepping empty, can the track fund still buy it# #Convertible bond single-day turnover hits a new high, how to borrow base layout#
This article is a personal opinion, not investment advice, your profit and loss has nothing to do with me. Past performance does not represent future performance. There are risks in the market, and investment should be cautious.
This topic has 0 discussions in Snowball, click to view.
Snowball is an investor’s social network, and smart investors are here.
Click to download Snowball mobile client http://xueqiu.com/xz ]]>
This article is reproduced from: http://xueqiu.com/2217395043/222330598
This site is for inclusion only, and the copyright belongs to the original author.