Original link: https://www.kawabangga.com/posts/4794
When debugging network quality, we generally focus on two factors: latency and throughput (bandwidth). The delay is better to verify, you can see it by pinging or mtr . This article shares a way to debug throughput.
Scenarios that value throughput are generally so-called long fat networks (Long Fat Networks, LFN, rfc7323 ). For example, downloading large files. The throughput has not reached the upper limit of the network, which may be mainly affected by three aspects:
- The sender has a bottleneck
- Receiver has a bottleneck
- The middle network layer has a bottleneck
The bottleneck at the sending end is generally that the buffer is not large enough, because the sending process is that the application calls syscall to put the data to be sent into the buffer, and then the system is responsible for sending it out. If the buffer is full, the application will block (if using the block API) until the buffer is available before continuing to write, producer and consumer mode.
Image via cisco
Bottlenecks on the sender side are generally easier to troubleshoot, and you can even see when they are blocked through the application log. Most of the cases are the 2nd and 3rd cases, which are more difficult to investigate. This happens when the application on the sending end has written the content into the system’s buffer, but the system does not send it out quickly.
In order to optimize the transmission efficiency (note that the transmission efficiency here is not the transmission efficiency of a single TCP connection, but the efficiency of the overall network), it will:
- To protect the receiving end, the data sent will not exceed the buffer size of the receiving end (Flow control). The process of sending data to the receiving end is similar to the process described above. The kernel is responsible for receiving the packets and placing them in the buffer, and then the upper-layer application processes the contents of the buffer. The application fills up before it can be processed. Then if the data continues to be sent, the buffer cannot be stored, and the receiver can only discard it.
- To protect the network, the data sent will not overwhelming the network (Congestion Control, congestion control). If there is a bottleneck in the middle network, the throughput of the long fat pipeline will be unsatisfactory;
For the protection of the receiving end, when the connection between the two sides is established, the buffer size (receiver window size, rwnd) of the receiving end will be negotiated, and in the subsequent transmission, the receiving end will also report its remaining and accepting in each ack packet. window size. In this way, the sender will ensure that it will not send data that exceeds the buffer size of the receiver when sending. (Meaning, the sender needs to be responsible, the receiver does not have the total number of acks, and will not exceed the receiver’s buffer.)
Image via cisco
For network protection, the principle is to maintain a Window, called Congestion window, congestion window, cwnd, this window is the limit of the current network, the sender will not send more than the capacity of this window (the total number without ack will not exceed cwnd).
How to find the value of this cwnd?
This is the key, the default algorithm is cubic, and there are other algorithms that can be used, such as Google’s BBR .
The main logic is, slow start (Slow start), send data to test, if the ack from the receiver can be received correctly, it means that the current network can accommodate this throughput, then cwnd x 2, and then continue the test. until one of the following happens:
- The sent packet did not receive an ACK
- cwnd is already equal to rwnd
Point 2 is easy to understand, indicating that network throughput is not a bottleneck, the bottleneck is that the buffer at the receiving end is not large enough. cwnd cannot exceed rwnd, otherwise it will overload the receiver.
For point 1, in essence, the sender uses packet loss to detect network conditions. If no packet loss occurs, it means everything is normal. If packet loss occurs, it means that the network cannot handle the sending speed. cwnd is halved.
However, the actual situation that causes point 1 is not necessarily the bottleneck of network throughput, but may be the following situations:
- The network has reached a bottleneck
- Packet loss due to network quality problems
- The intermediate network device delayed the delivery of the packet, resulting in the sender not receiving an ACK within the expected time
Causes 2 and 3 both cause cwnd to drop and network throughput cannot be fully utilized.
The above is the basic principle, the following describes how to locate this problem.
rwnd view mode
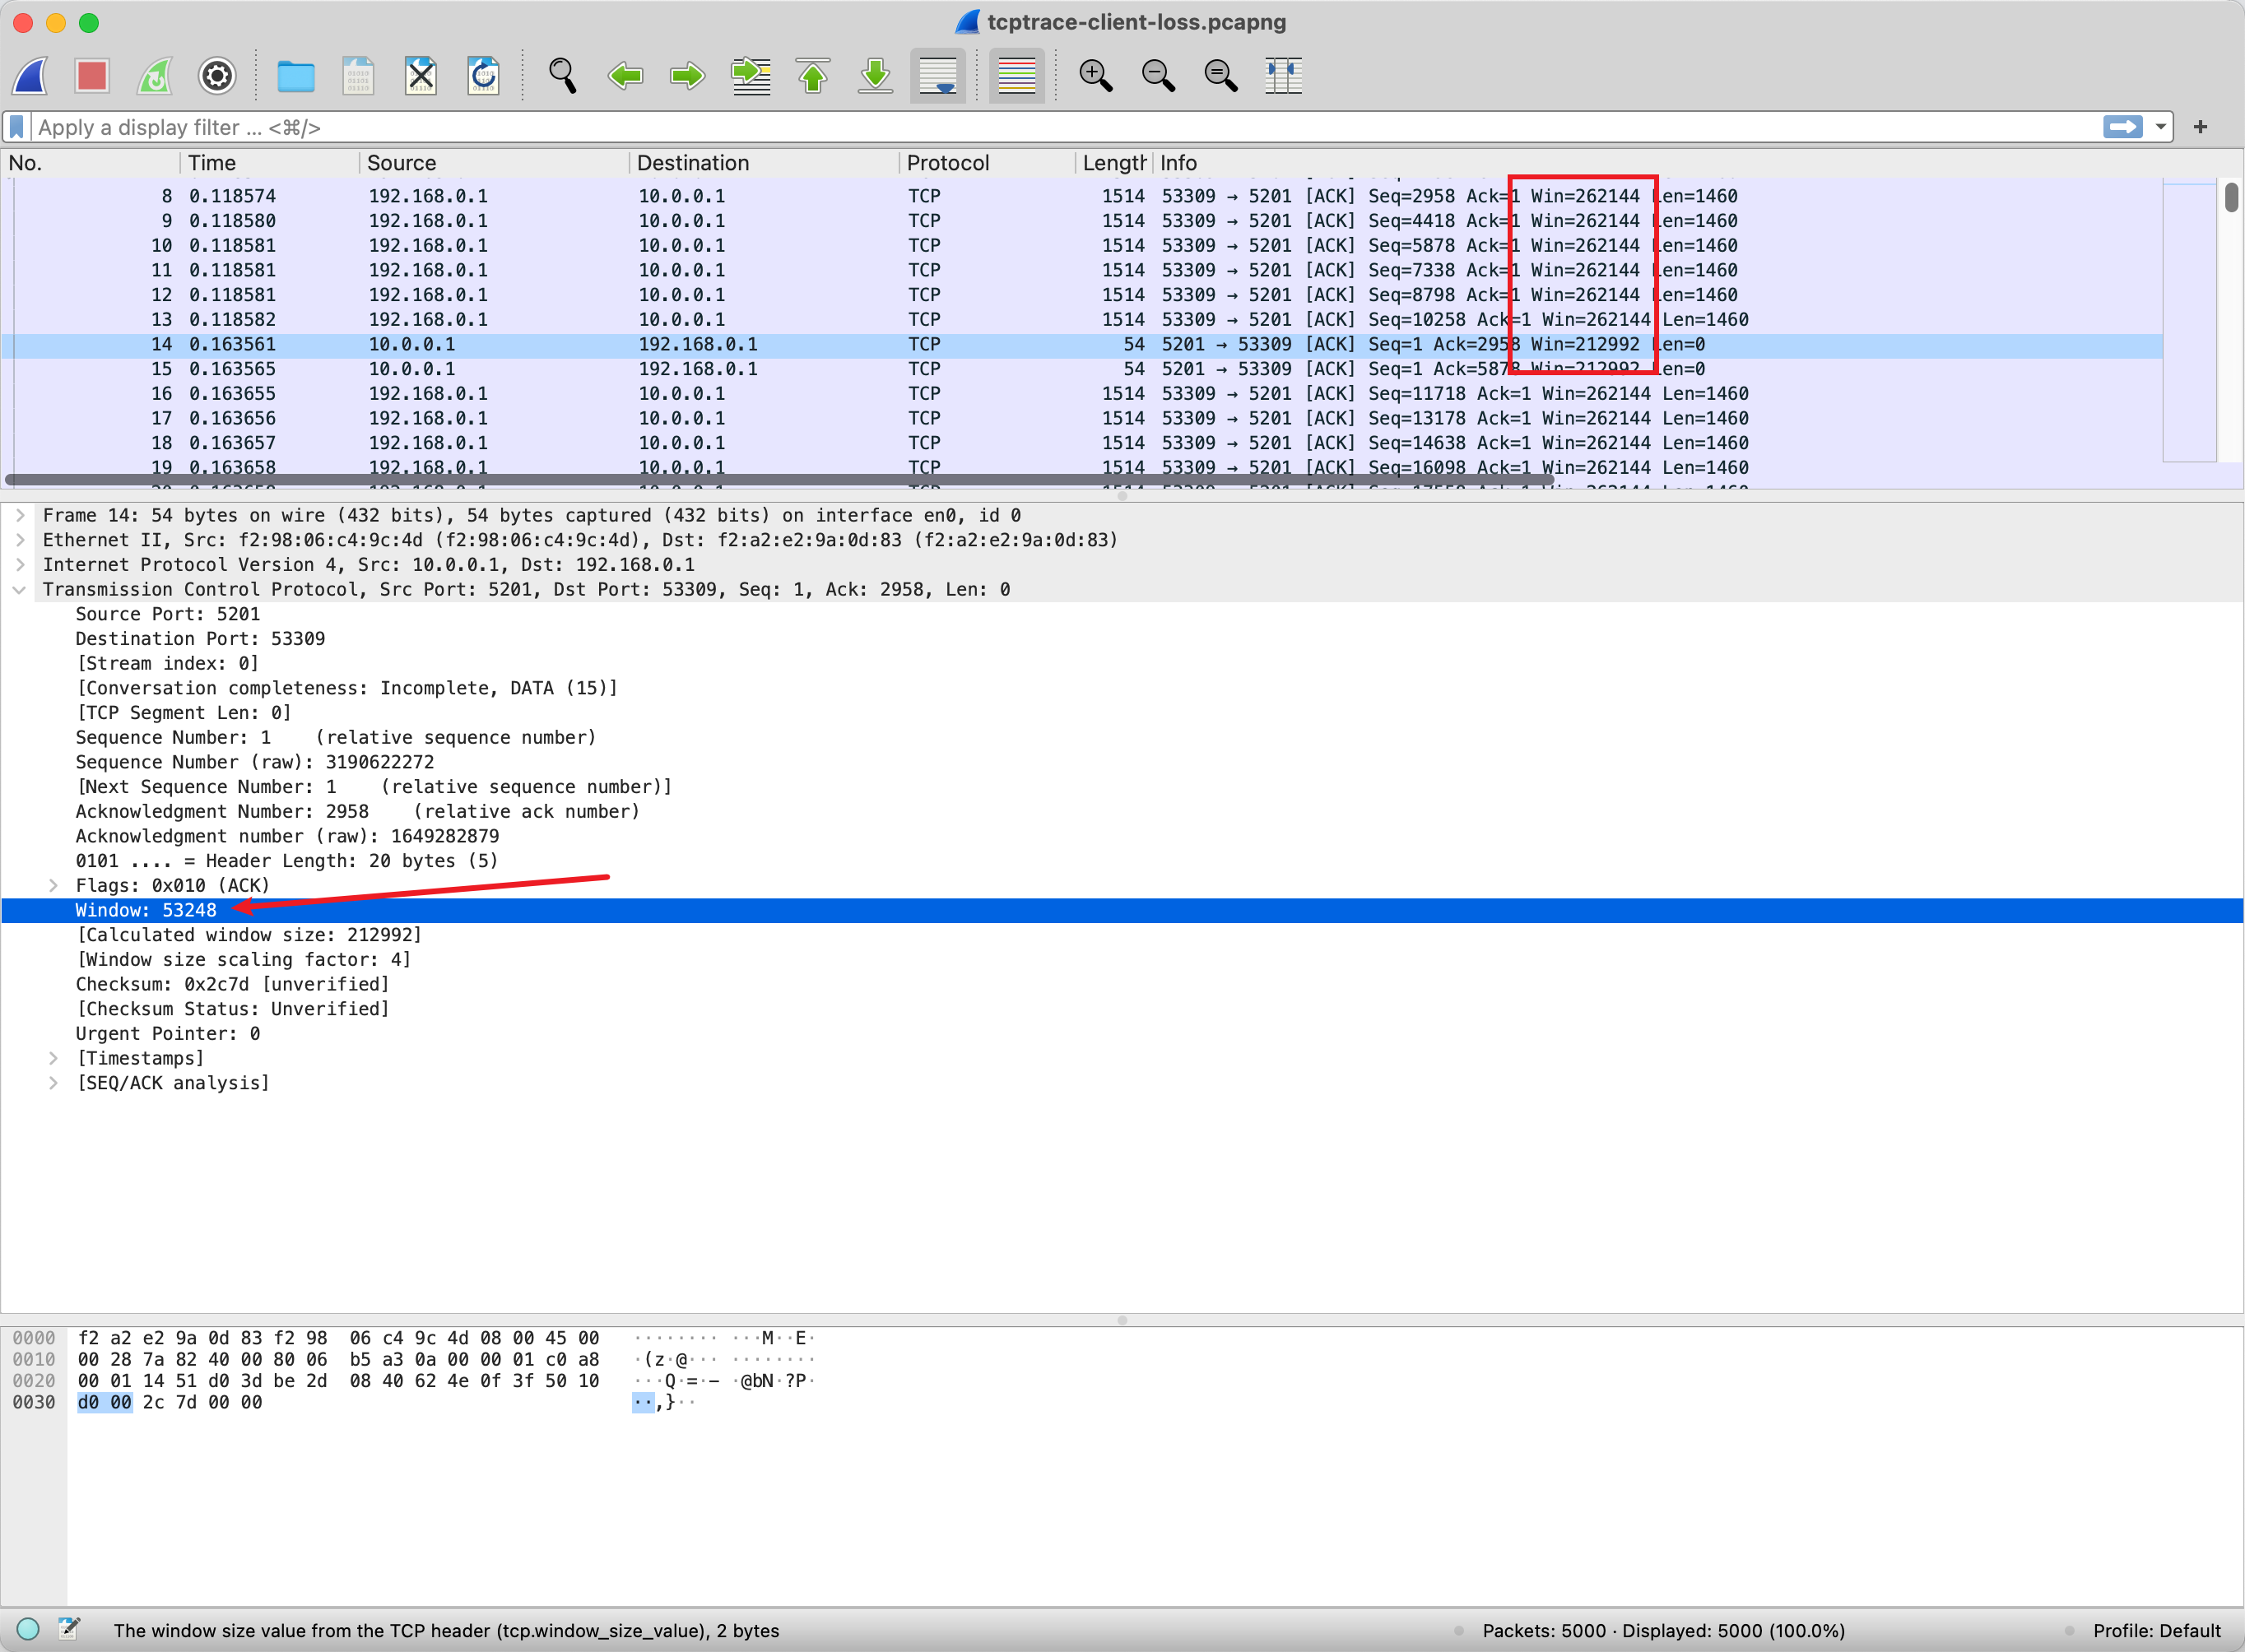
This window size is directly in the TCP header, and you can see this field when you grab it.
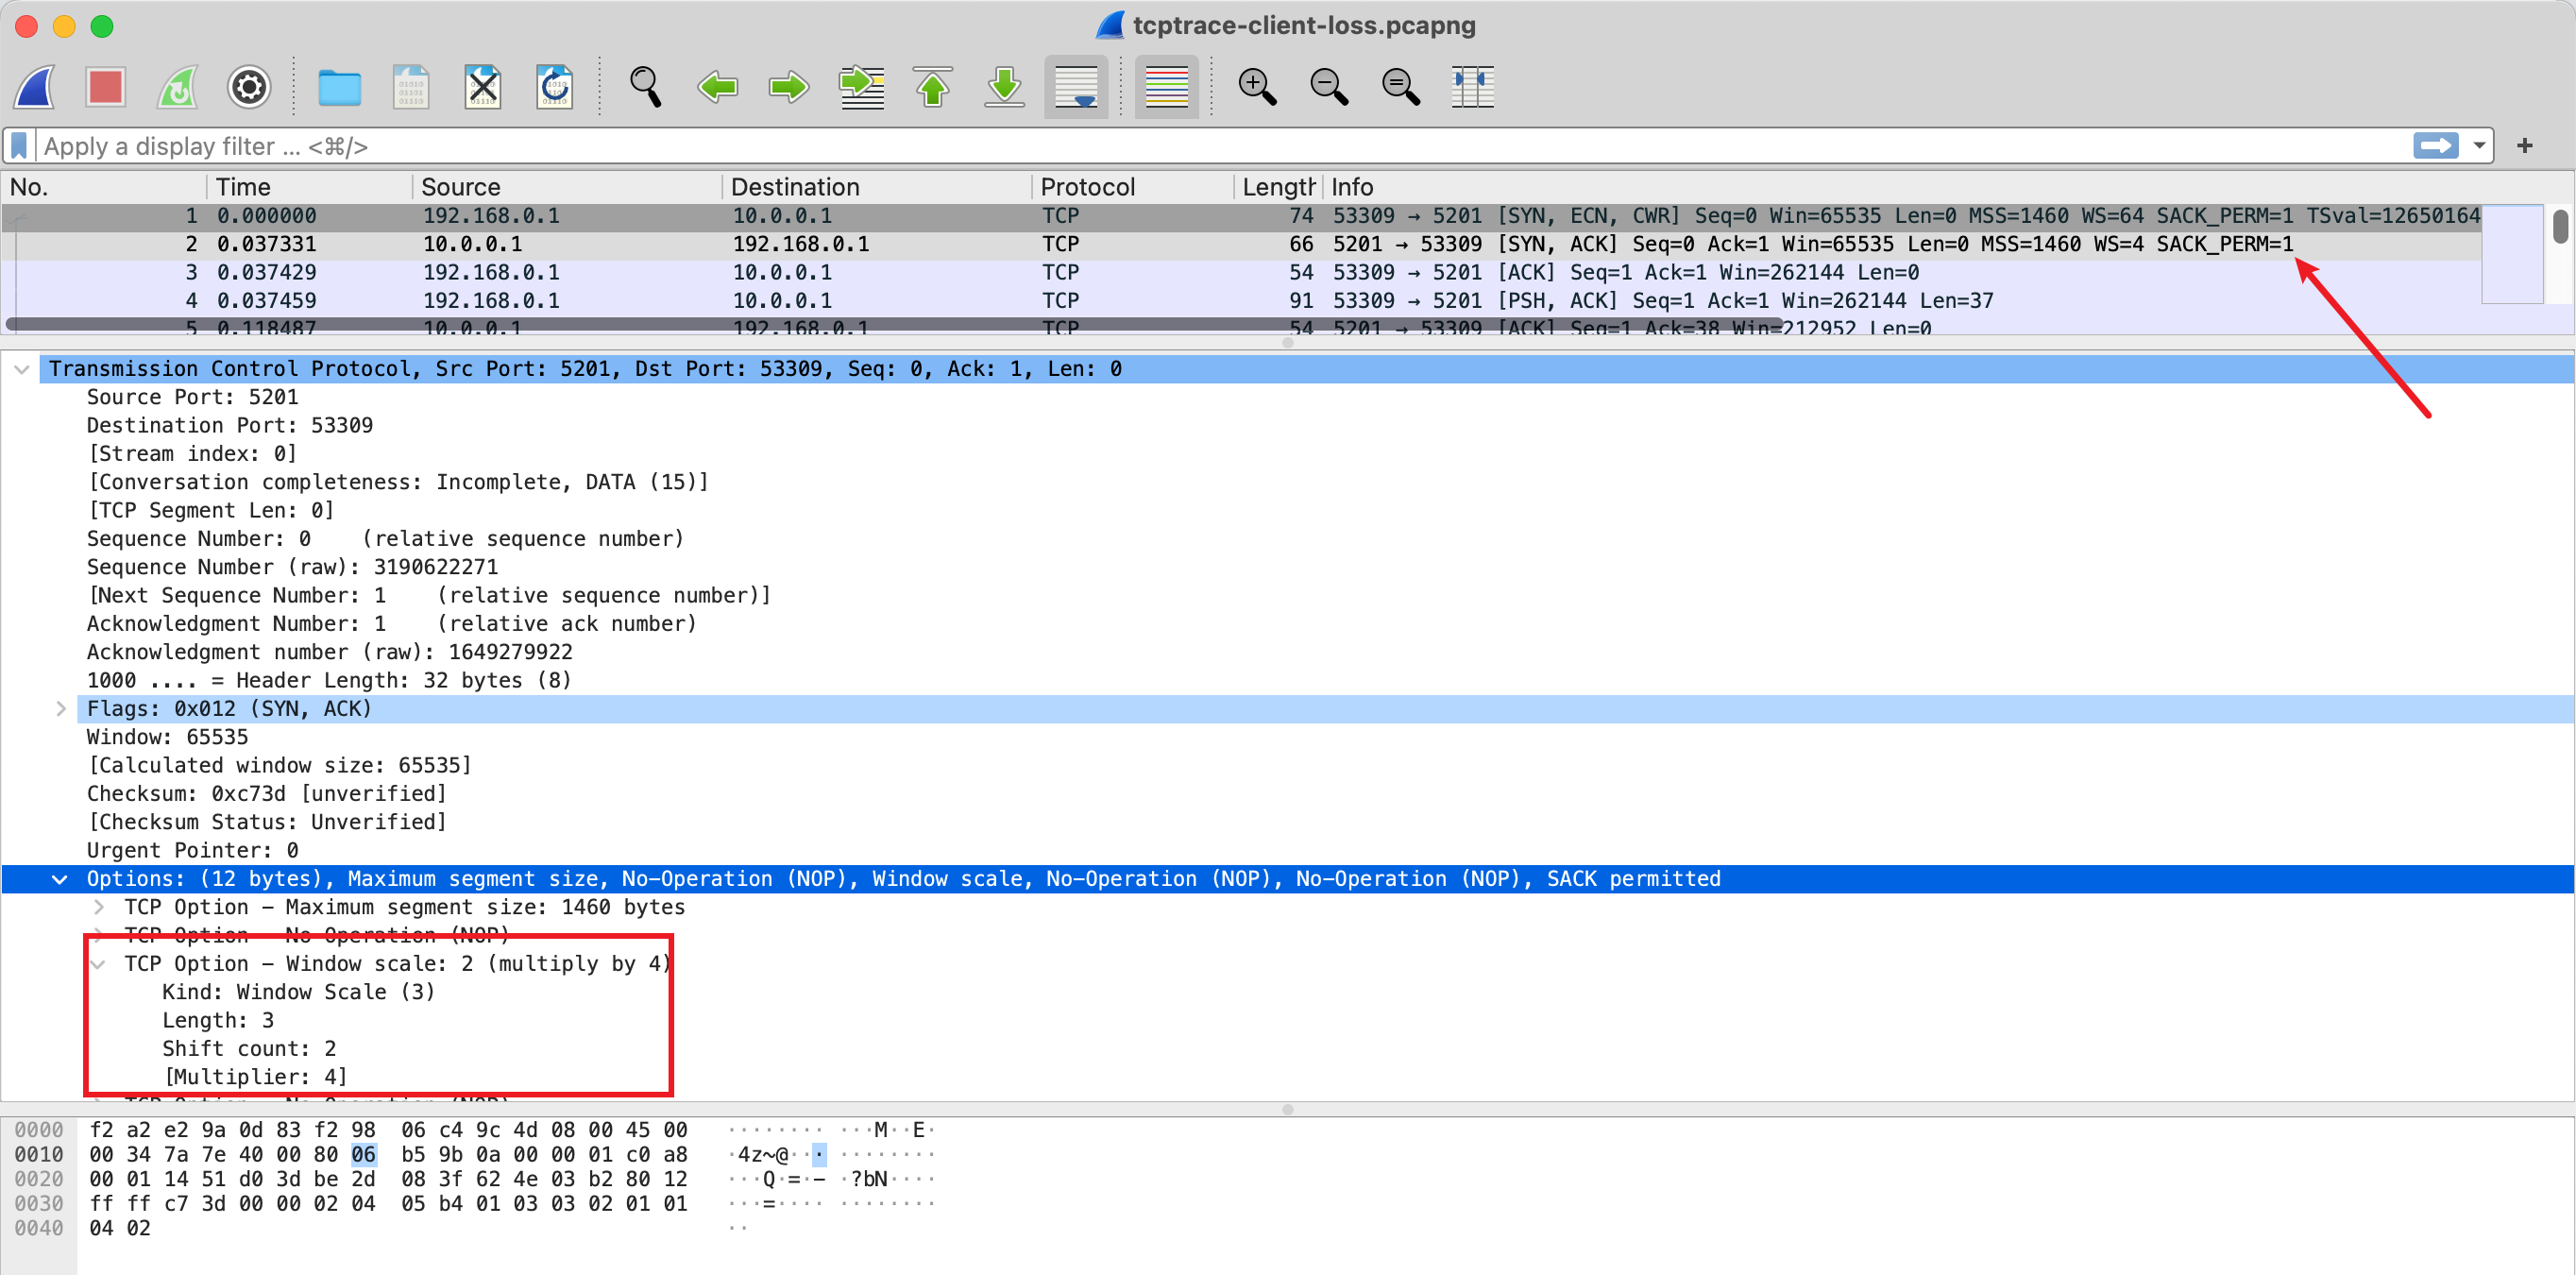
But the real window size needs to be multiplied by factor, which is negotiated at the TCP handshake node through TCP Options . So if you analyze the window size of a TCP connection, you must capture the packets in the handshake phase, otherwise you can’t know what the negotiated factor is.
cwnd view method
Congestion control is a dynamic variable obtained by the sender through the algorithm. It will try to adjust it, and it will not be reflected in the transmission data of the protocol. So to see this, it must be seen on the sending machine.
In Linux, you can use the ss -i option to print out the parameters of the TCP connection.
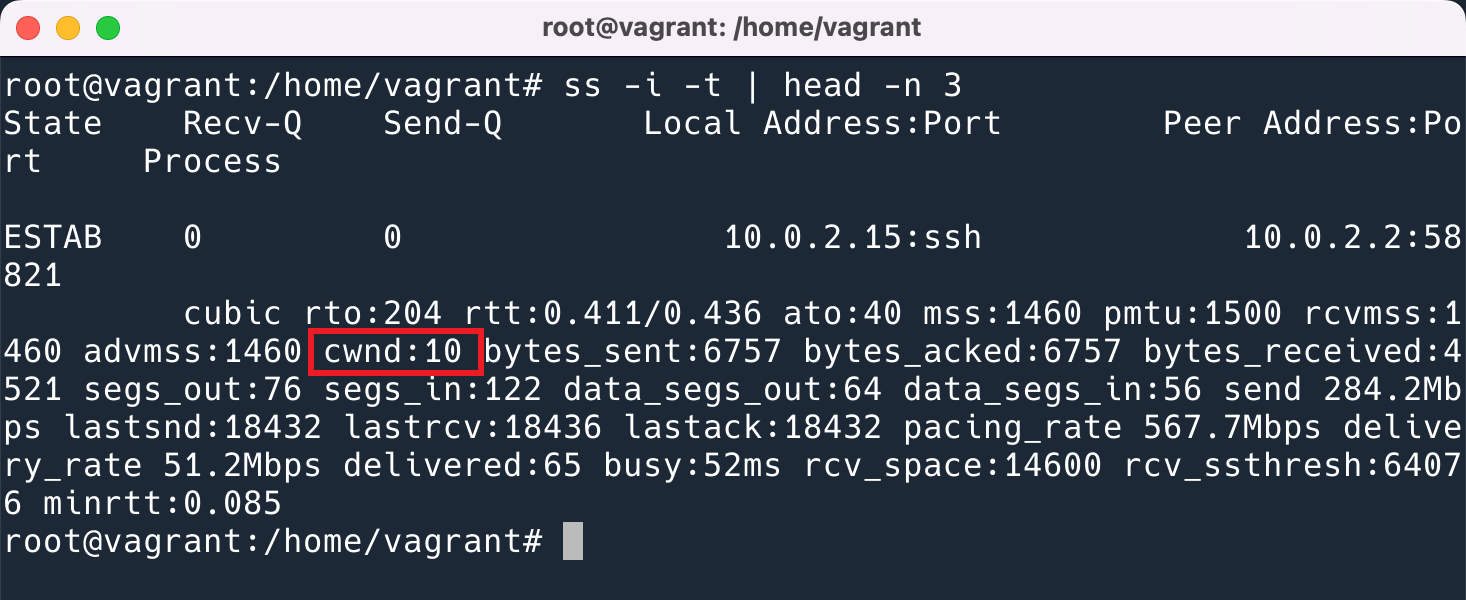
The unit shown here is TCP MSS. That is, the actual size is 1460bytes * 10.
Wireshark analysis
Wireshark provides very useful statistics that allow you to see at a glance where the current bottleneck is happening. But when I opened this picture for the first time, I couldn’t read it. Fortunately, my colleague met, he taught me, I will record it here, and teach you too.
First, open the way as follows:
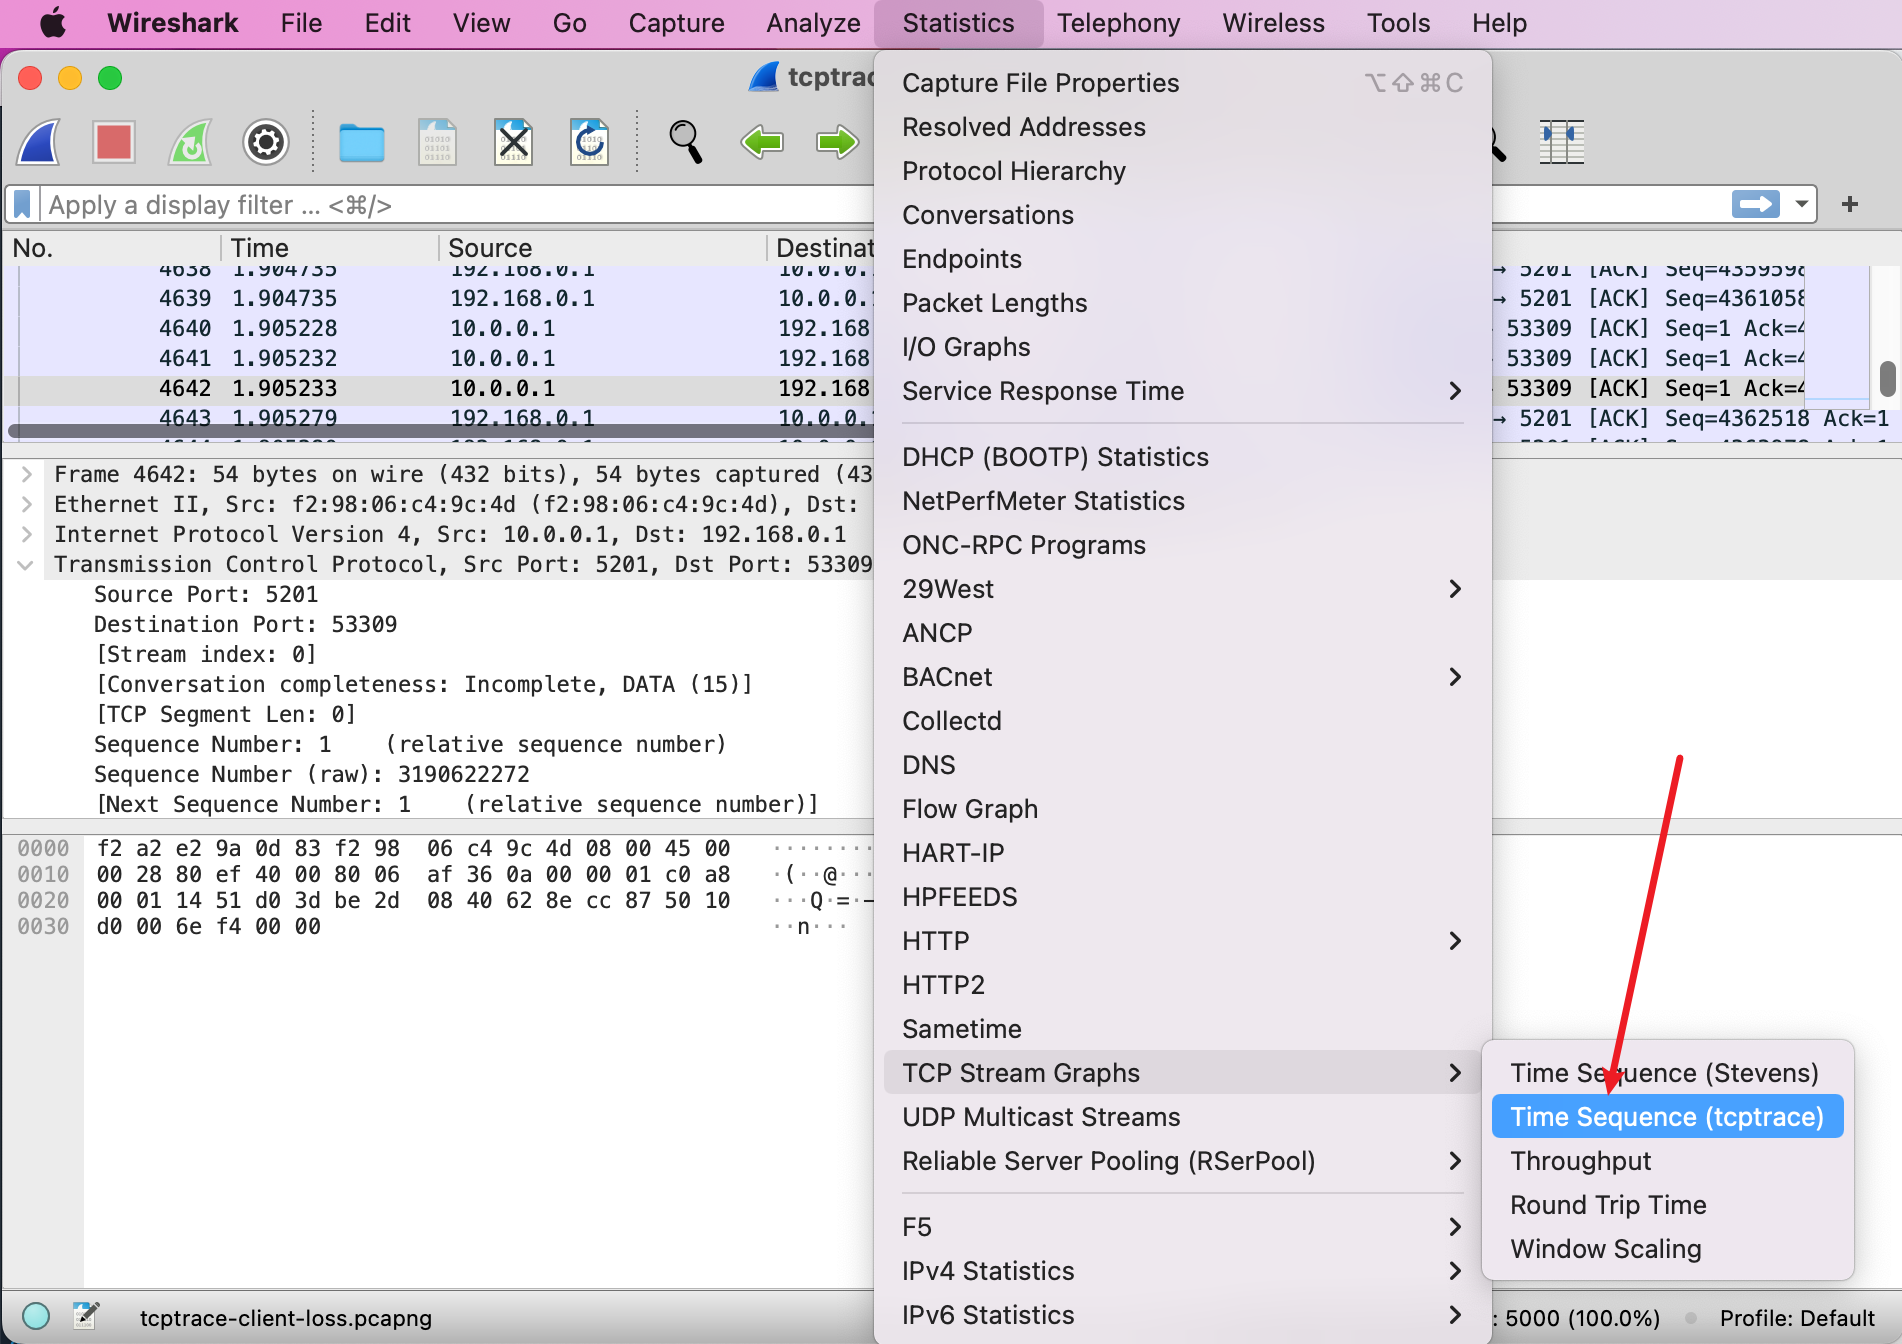
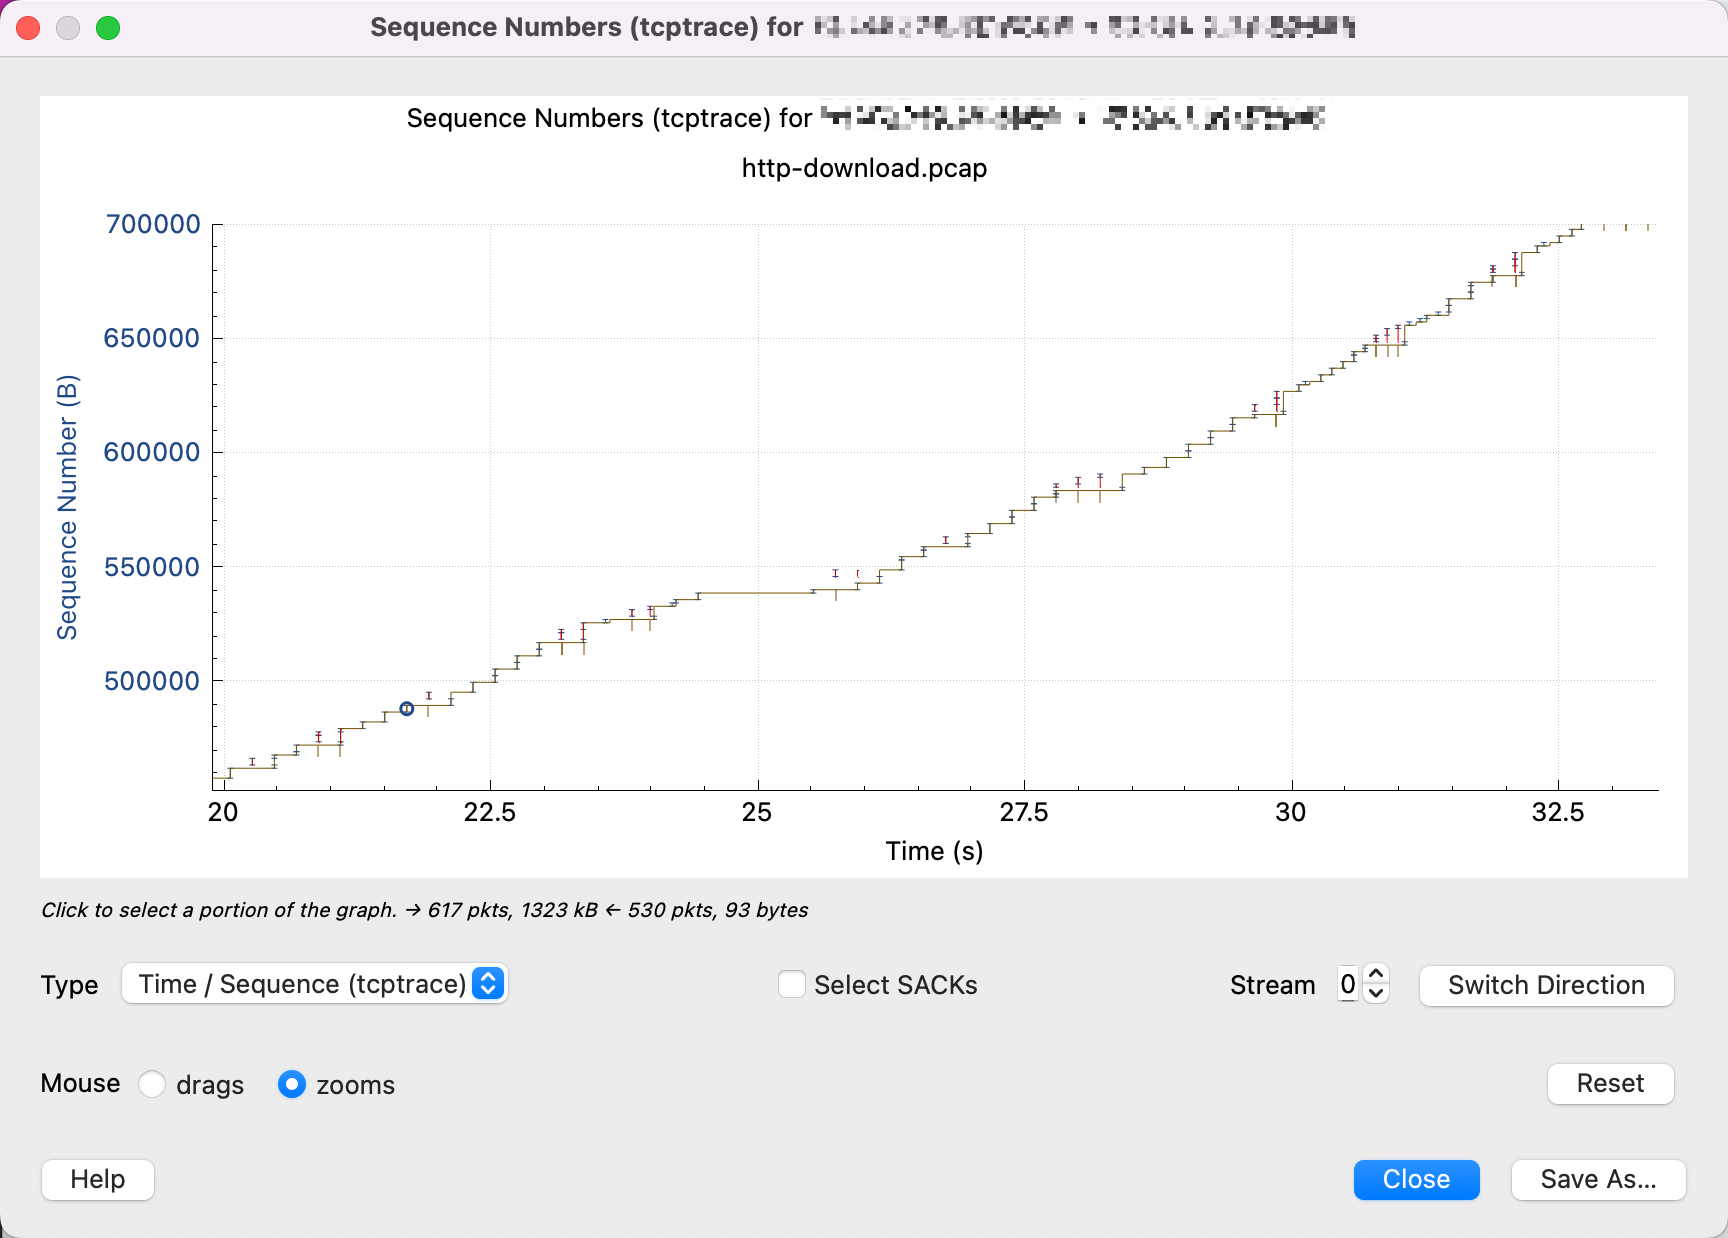
Then you will see the following image.
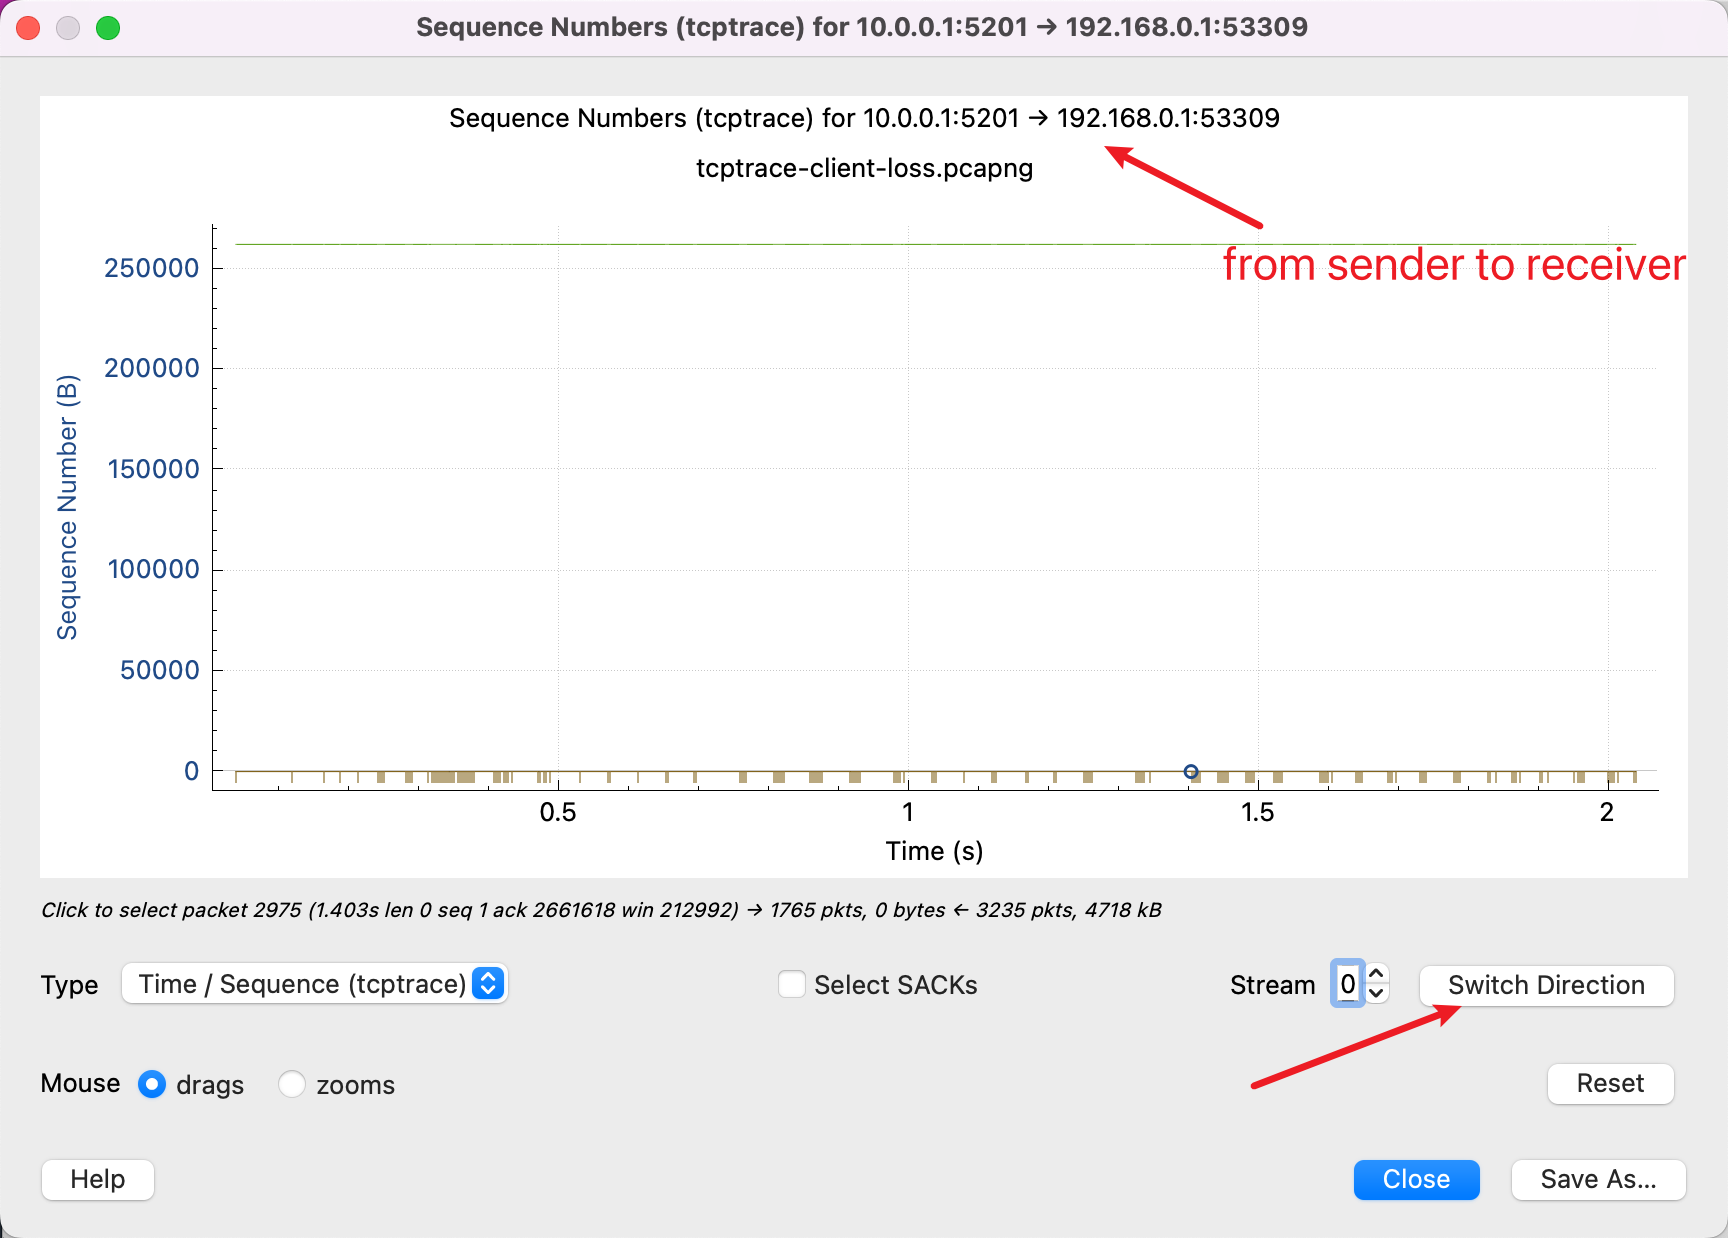
First of all, it needs to be clear that the diagram of tcptrace represents data transmission in one direction, because tcp is a duplex protocol, and data can be sent on both sides. The top of it says that the graph data you are looking at is sent from 10.0.0.1 to 192.168.0.1, and then press the button in the lower right corner to switch the viewing direction.
The X-axis represents time, which is easy to understand.
Then understand the Sequence Number represented by the Y-axis, which is the Sequence Number in the TCP packet, which is critical. All data in the figure are based on Sequence Number.
So, if you see as shown in the figure above, it means that you are reading it the other way round, because the Sequence Number of the data has not been increased, indicating that almost no data has been sent, and you need to click Switch Direction.
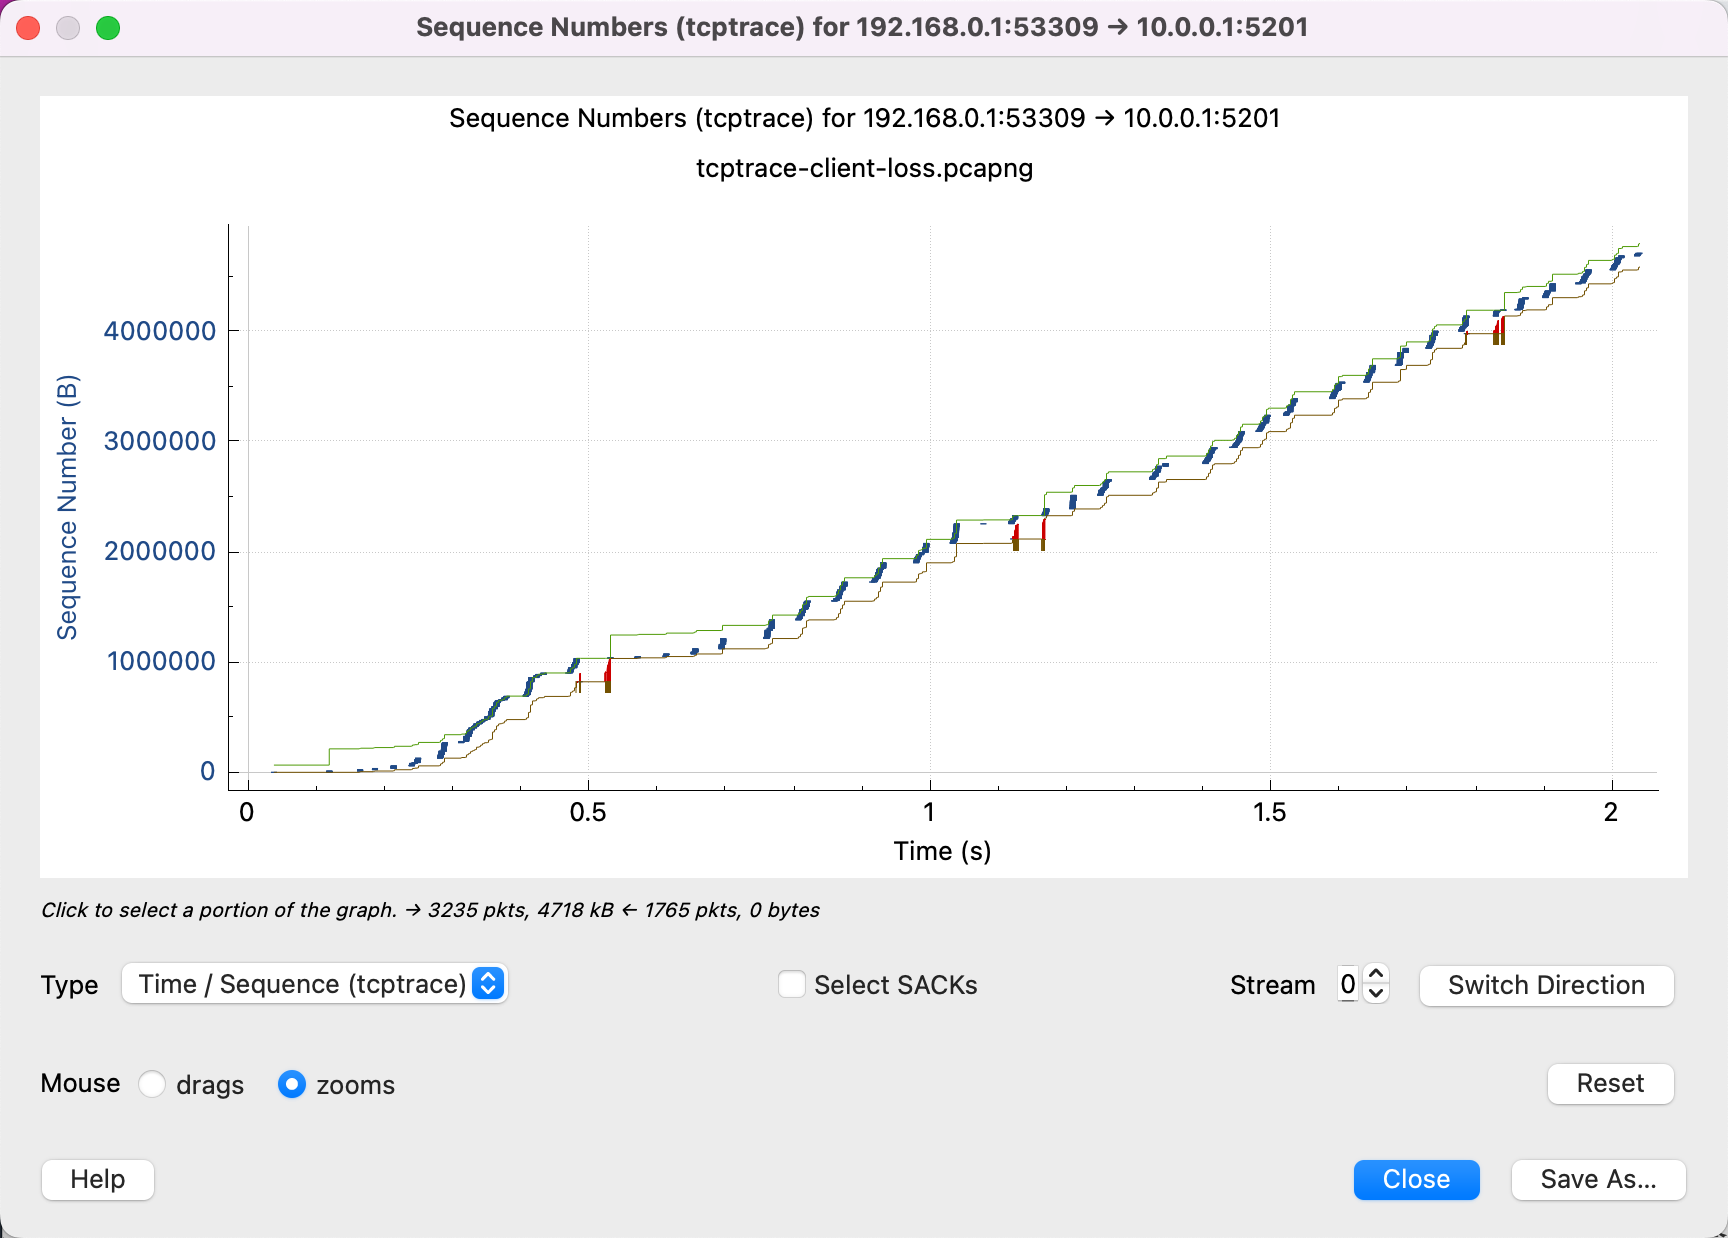
That’s right, you can see that the Sequence Number we transmit increases over time.
There are 3 lines in it, with the following meanings:
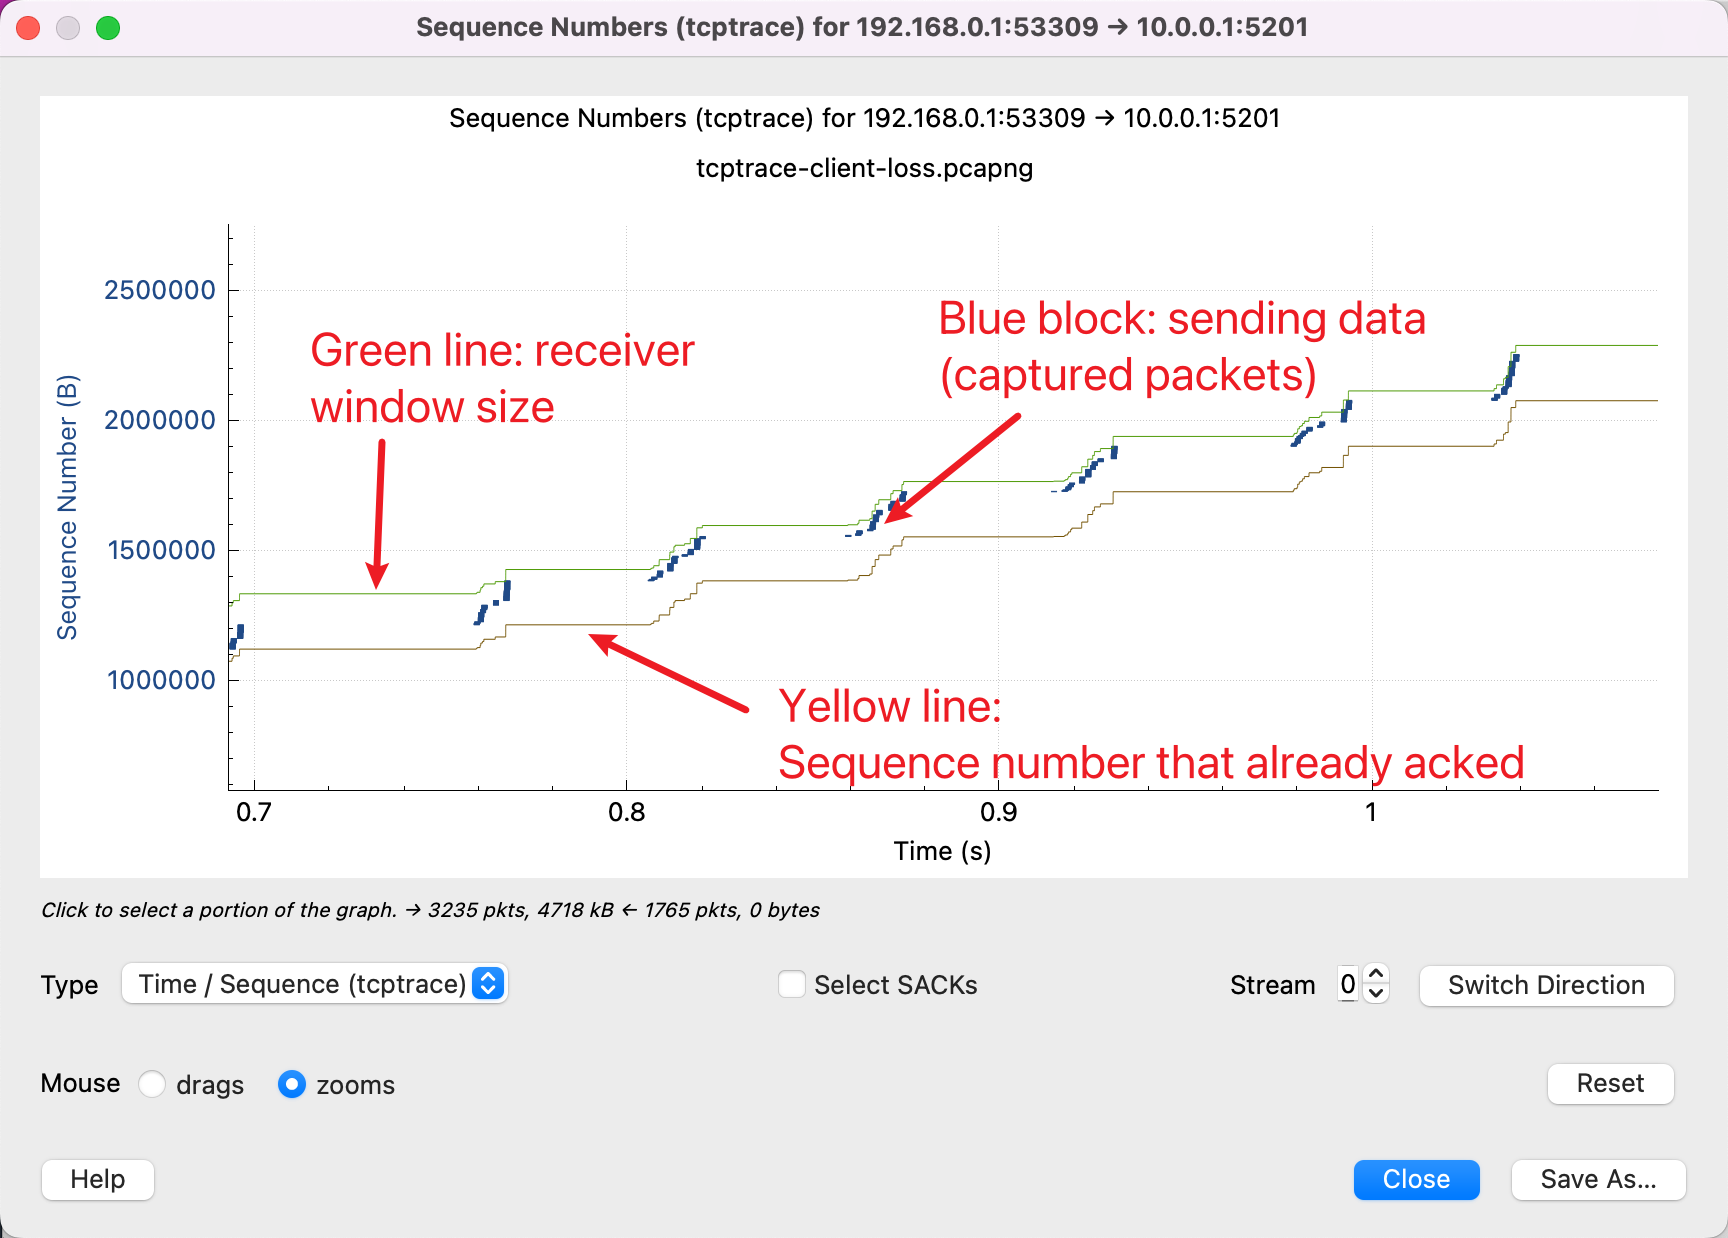
In addition to this, there are two other lines:
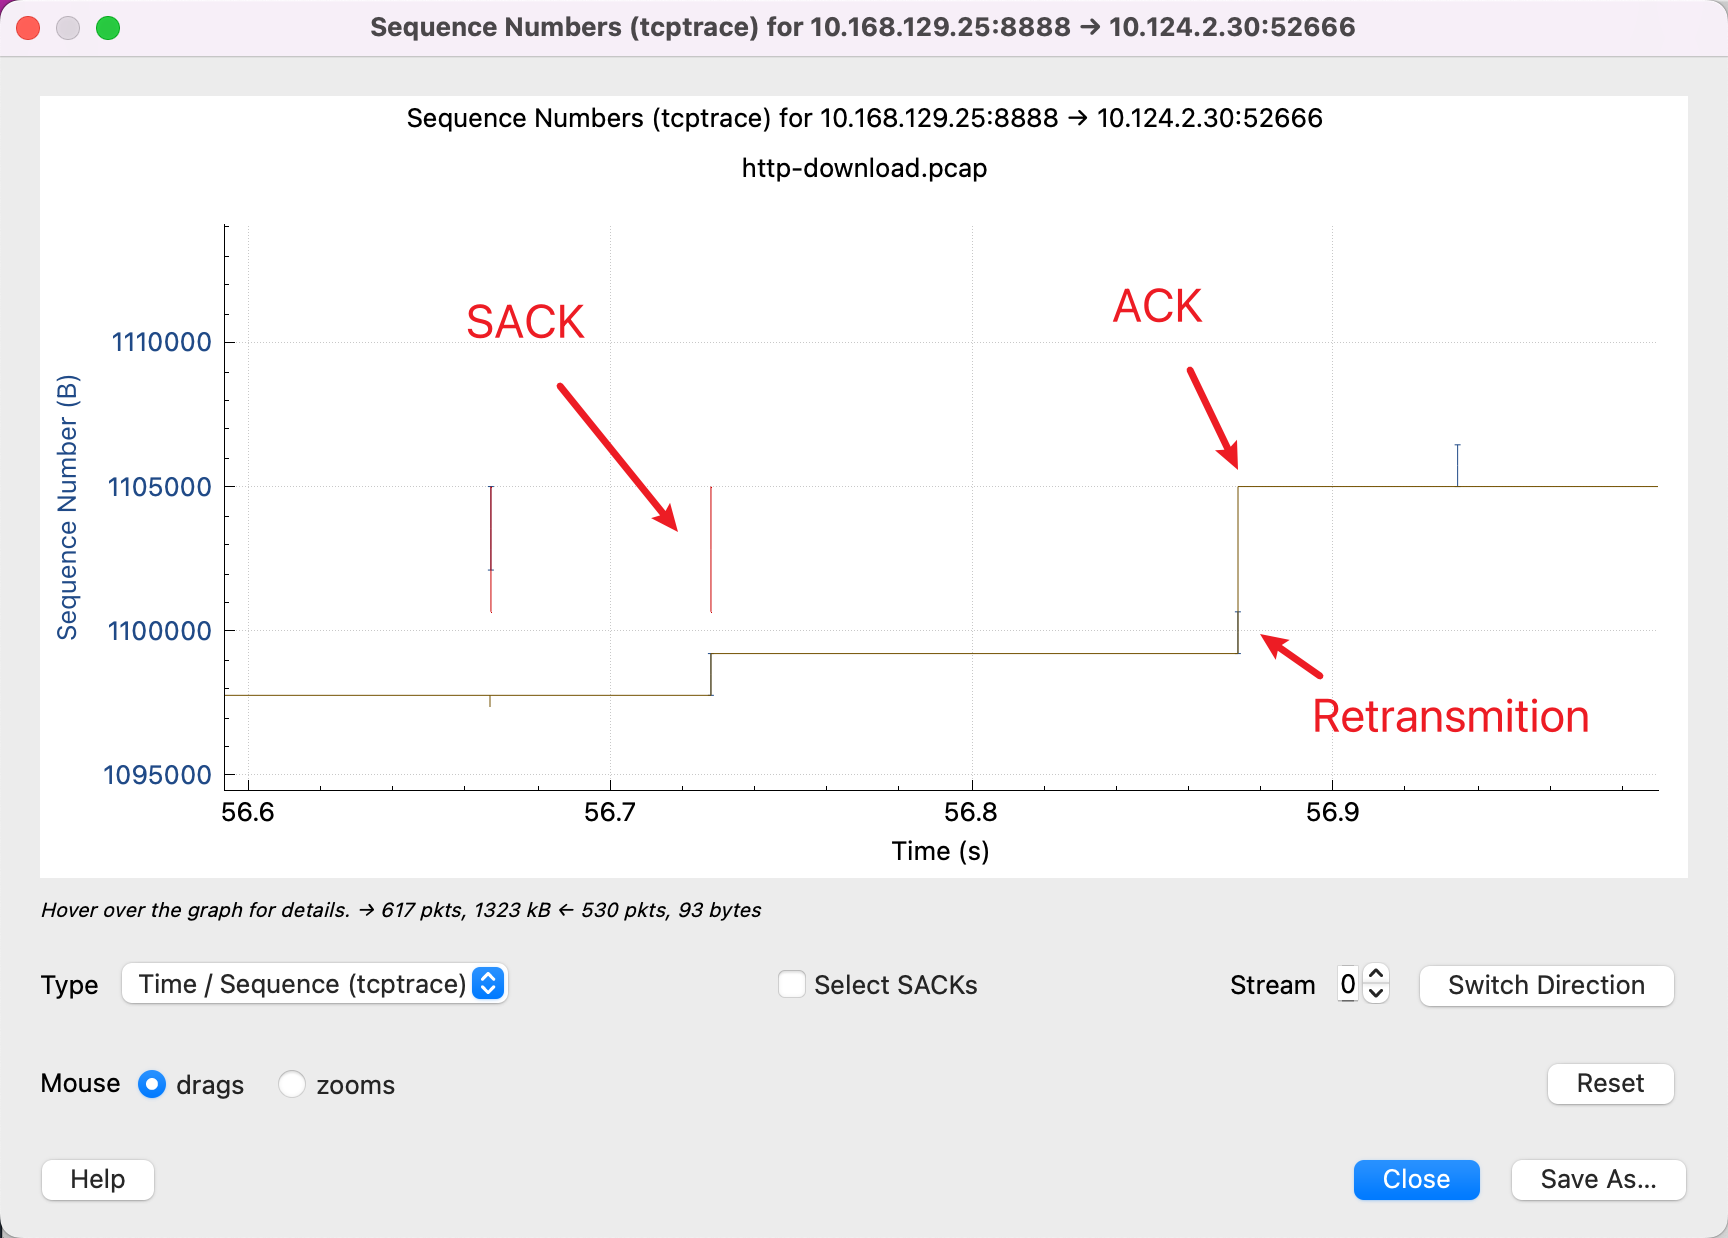
Always remember that the Y-axis is the Sequence Number, the red line indicates the SACK line indicates that this Sequence Number has been received, and then the yellow line indicates the ACKed Sequence Number, then the sender will know that in the middle The segment is empty, the packet is lost, and the vertical blank of the red line and the yellow line is the packet that has not been ACKed. Therefore, retransmission is required. The blue line means that it has been retransmitted again.
After learning to look at these pictures, we can recognize several common patterns:
packet loss
There are a lot of red SACKs, indicating that the receiving end is repeatedly saying: there is a packet in the middle that I did not receive, and there is a packet in the middle that I did not receive.
Throughput is limited by the receive window size
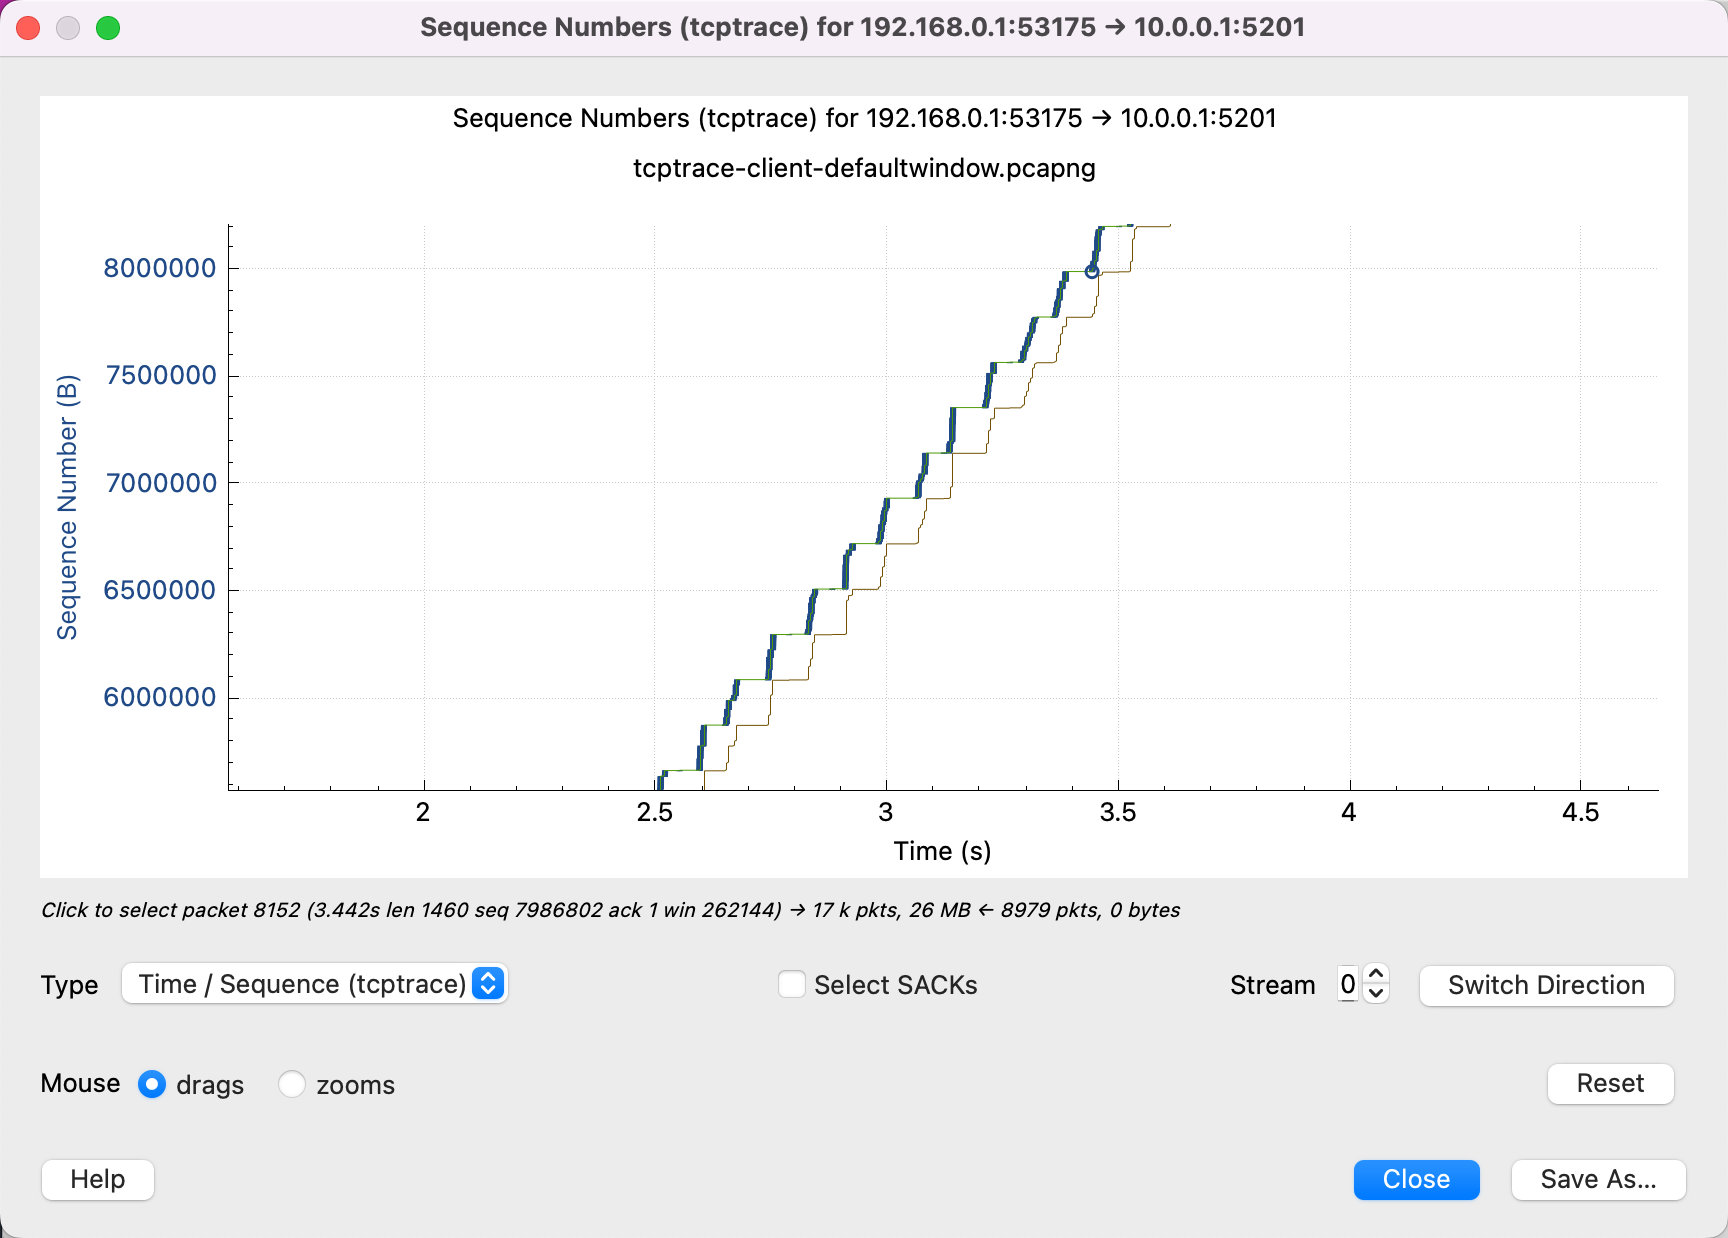
As can be seen from this figure, as soon as the yellow line (the receiving end ACK) rises, the blue line rises (the sending end starts sending) until the green line (window size) is filled. It means that the network is not the bottleneck, and the buffer size of the receiving end can be increased.
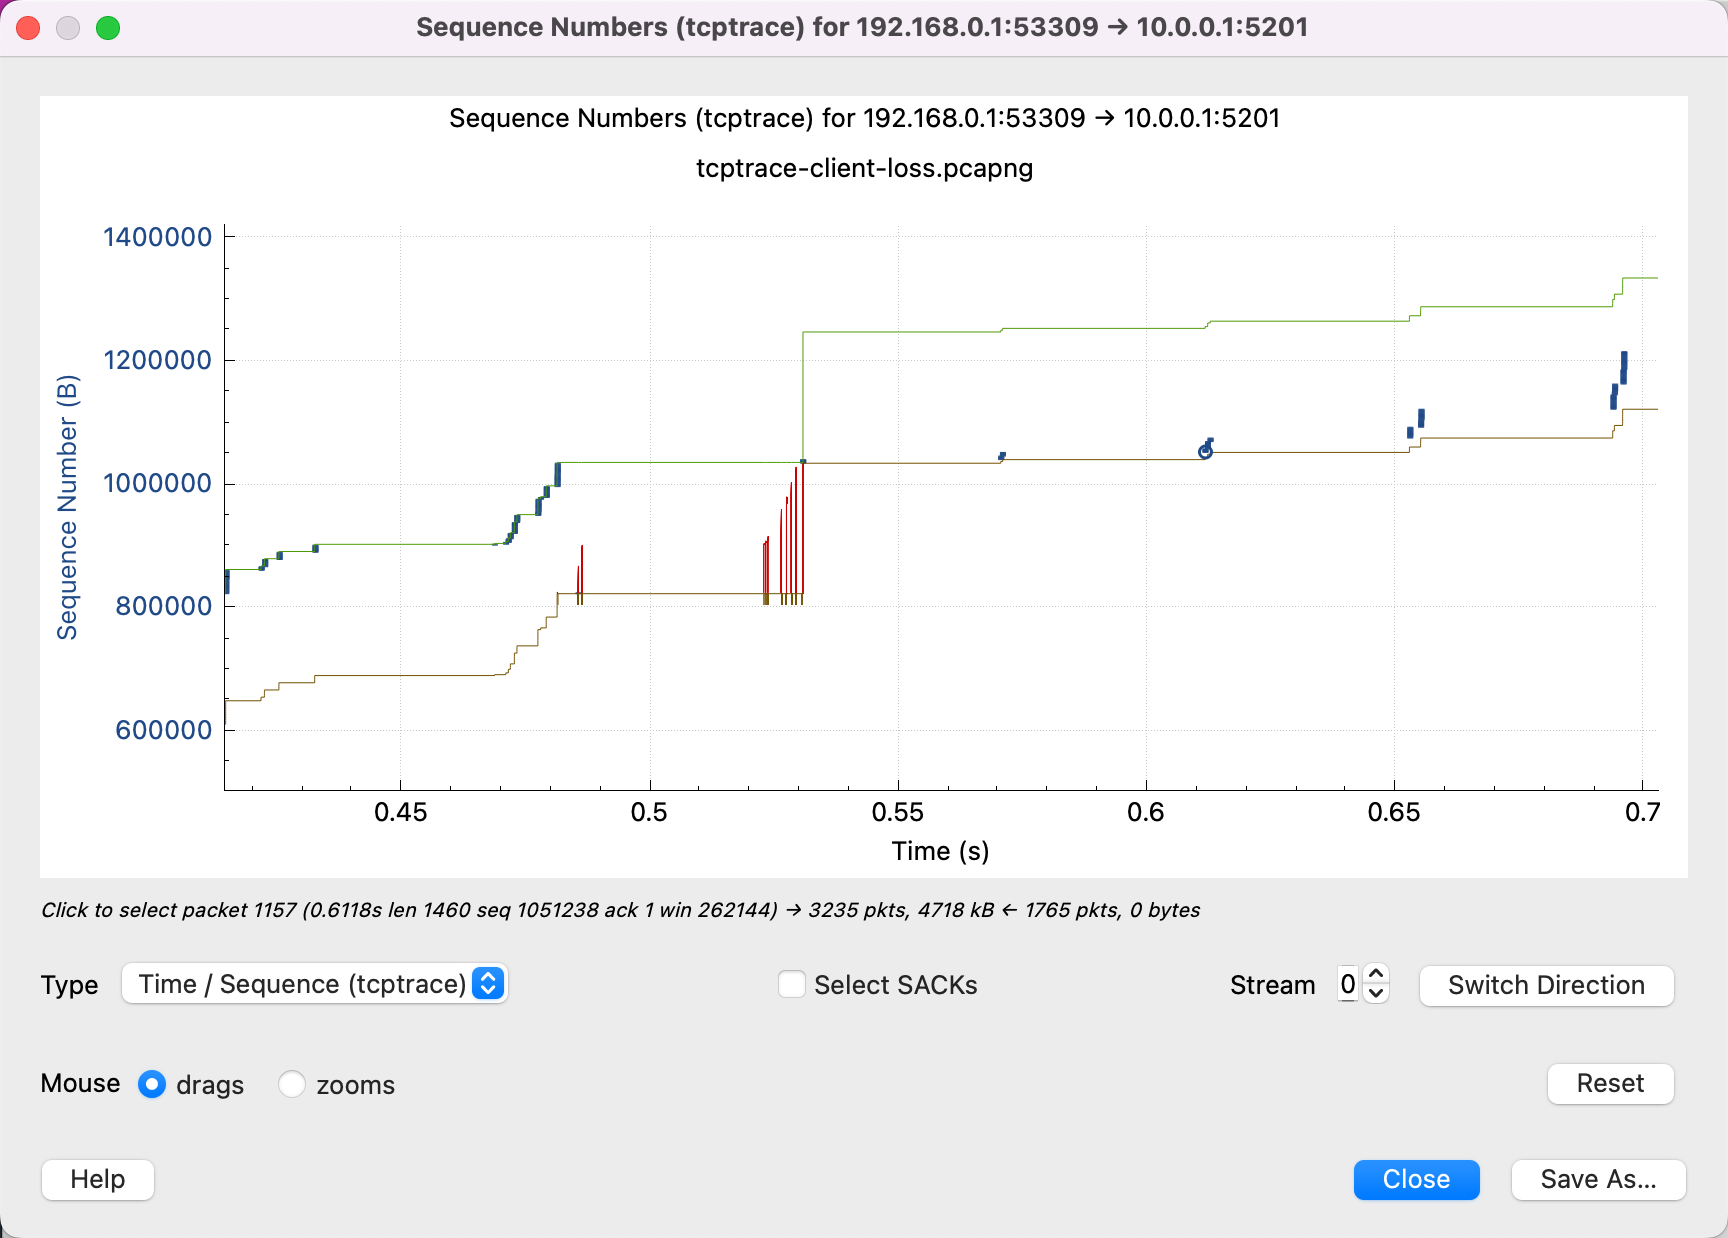
Throughput limited by network quality

As can be seen from this figure, the window size of the receiving end is far from being the bottleneck, and there is still a lot of free time.
Zooming in, it can be seen that there are many packet losses and retransmissions in the middle, and only a little bit of data is sent each time, which indicates that the cwnd is probably too small and is limited by the congestion control algorithm.
The packet capture files used in this article can be downloaded from here (credit: https://www.youtube.com/watch?v=yUmACeSmT7o ):
Some other references:
- https://www.stackpath.com/edge-academy/what-is-cwnd-and-rwnd/
- https://www.baeldung.com/cs/tcp-flow-control-vs-congestion-control
- https://www.cs.cornell.edu/courses/cs4450/2020sp/lecture21-congestion-control.pdf
- https://www.mi.fu-berlin.de/inf/groups/ag-tech/teaching/2011-12_WS/L_19531_Telematics/08_Transport_Layer.pdf
- https://wiki.aalto.fi/download/attachments/69901948/TCP-CongestionControlFinal.pdf
- https://paulgrevink.wordpress.com/2017/09/08/about-long-fat-networks-and-tcp-tuning/
The post Analyzing TCP Throughput Bottlenecks with Wireshark first appeared on Kawabanga! .
related articles:
This article is reprinted from: https://www.kawabangga.com/posts/4794
This site is for inclusion only, and the copyright belongs to the original author.