The calculation of index valuation is one of the most common problems encountered by our index fund investors. Today, 61 uses a “buyer’s perspective” to explain how the index valuation (PE) is calculated.
Let’s start with the basics, and the title of this article is in the second part.
1. Basic Concepts
In the securities market, PE is a common core valuation indicator, which can cope with the valuation judgments of most indices and individual stocks. Before understanding the index PE, let’s review the meaning of this indicator.
PE = Price/EPS = stock price / net profit per share = market value / net profit
Extending to the calculation of index PE, we are often confused: the index has assembled a series of constituent stocks, and each constituent stock has different market capitalization, different weights, and different profits. How to use the above formula to calculate?
1. Market capitalization weighted
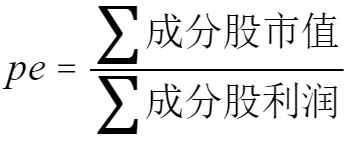
Our most common index valuation calculation method, index PE = constituent stock market capitalization and / constituent stock profit sum , can achieve a ” market capitalization weighted ” result without considering the upper limit of the weight.
2. Policy weighted or limited weight
Friends will find that using the first formula, it is actually impossible to calculate the index valuation of strategy-weighted categories , such as “dividend rate weighting”, “reciprocal volatility weighting”, “fundamental multi-factor weighting”, etc. In addition, in the index compilation rules, common weight restrictions such as the “10% weight cap” for a single component stock will also affect the calculation results.
Therefore, in fact, the official CSI index has also given a clear calculation formula:
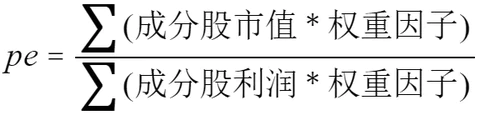
If we know the market value , profit and weight factor of each component of an index, we can accurately calculate its PE, but the weight factors of some indexes are difficult to calculate :
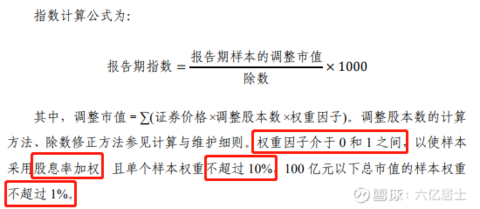
The above picture shows the compilation rules of the dividend index. The functions implemented by the weighting factor can be described as rich: the dividend rate is weighted and the single sample does not exceed 10%, and the market value below 10 billion does not exceed 1%. Therefore, the weight factor is the data after a series of complex calculations, which is quite difficult for ordinary investors to grasp.
It should be emphasized here that the weight factor is not equal to the weight . The weight of each constituent stock is calculated based on the weight factor, but the weight cannot be directly replaced by the weight factor to participate in the calculation. Due to the complex rules and diverse data, individuals who want to accurately calculate the weight factor generally need to implement programming, and are also affected by the data source, which is quite difficult.
So, let’s change our minds.
2. Calculating the PE Index from the Buyer’s Perspective
Because it is difficult to obtain explicit weighting factors for each index, it is difficult to accurately calculate index valuations. Back to the beginning, starting from PE = market value / net profit , if we can accurately calculate the market value of the purchased asset and the net profit it can generate, we can also accurately calculate PE.
1. First give a chestnut:
An index has two constituent stocks: A, 10 billion market value, 500 million profit, 60% weight; B, 1 billion market value, 200 million profit, 40% weight;
You now have 1 billion to buy the index:
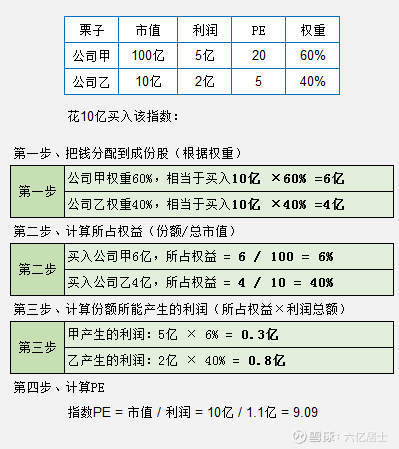
It is equivalent to spending 1 billion yuan and passively buying part of the equity of a package of companies according to the weight. These proportions of equity can generate 110 million profits per year, then divide the two to get the current price-earnings ratio of the index PE = 10/1.1 = 9.09 .
Of course, this calculation method must first obtain the actual weight of the index stocks. The official website of CSI will update the actual weight of each index at the end of each month, which can be downloaded from the index page .
2. Apply it to the actual index, and then look at the following figure:
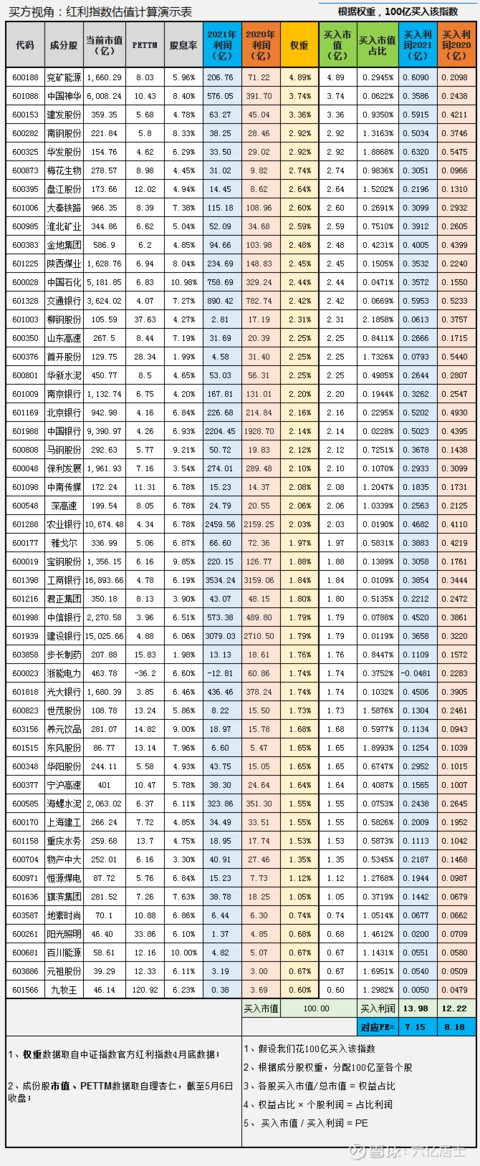
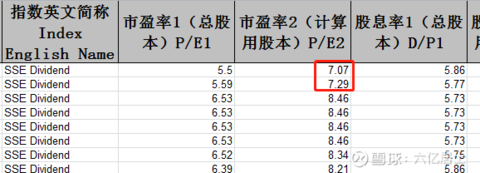
The above picture is to use the “buyer’s perspective” method to calculate the dividend index after the update of this annual report (May 1), in order to verify the substantial adjustment of the CSI official dividend index PE2.
The specific calculation process:
1) From the China Securities Index official, pull the weight information of each constituent;
2) Complement each constituent stock from the third-party data website: current total market value, annual profit;
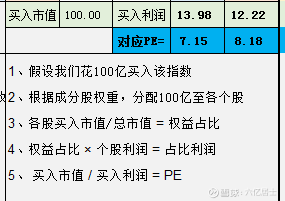
3) According to the weight of individual shares, the quota is allocated to each constituent stock;
4) Purchase market value/total market value of individual stocks, and calculate the “buy market value ratio”, or it can also be called “owner’s equity ratio”.
5) Calculate the profit that can be generated by holding part of the market value according to the annual profit of individual stocks and the proportion of holdings;
6) Obtain the current PE of the dividend index = total market value of purchase / total profit of purchase = 100 / 13.98 = 7.15 ;
Note: The weight data is as of April 30, and the market value data is the closing data on May 6.
3. Changes in the valuation of the dividend index
May 1st of each year is the date when the CSI officially updates its financial report. Therefore, the index valuations we focus on tend to experience large valuation fluctuations at this time.
1. Significant changes in valuation
2. Reasons for changes in valuation
The total profit of all constituent stocks of the dividend index in 2021 is 1,718.190 billion yuan, compared with 1,461.532 billion yuan in 2020, a year-on-year increase of 17.56%, which is the core reason for the sharp decline in the index valuation.
After increasing the weight, the 10 billion buy index will achieve a profit of 1.222 billion in 2020 and a profit of 1.398 billion in 2021, a year-on-year increase of 14.40%. Therefore, the valuation of index PE2 dropped from 8.18 to 7.15.
PS: The difference between the calculated data and the official data is mainly limited by the accuracy of the data and the timeliness of the weight;
3. The impact of cyclical energy stocks
Considering the weights, the changes in profits generated by the shares actually bought by the index are shown in the following figure:
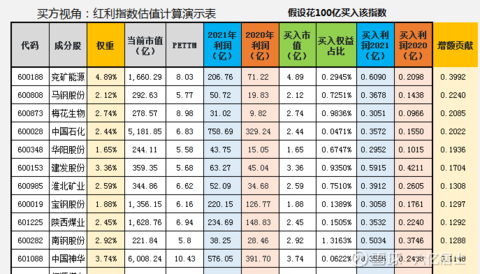
The right column in the above figure is “incremental contribution”, that is, the same constituent stock, in 2021, compared with the incremental part generated in 2020, most of the contributions are “energy” constituent stocks. If you are cautious, you can also exclude the impact of strong cyclical stocks such as coal and steel. After excluding the increase in coal and steel, PE2 remains basically unchanged, that is to say, the dividend index, excluding the increase in the profit of energy stocks, the rest of the constituent stocks are almost flat.
The advantage of this calculation method is to clearly understand the exact source of the profit contribution of each share I buy.
4. About the dividend underestimation threshold
Many friends will ask whether it is necessary to adjust the underestimation threshold. In fact, the annual financial report update will greatly affect the valuation of the stage. The valuation standard we set is based on long-term data, and there is no need to be too nervous about the fluctuation of the stage.
However, 61 hopes that through this article, everyone can have a rational understanding of the calculation of index valuation, the difference in index compilation rules, and the difference in weights and weighting factors.
Then, according to the calculation, we can also better understand the profit of constituent stocks in different industries and the impact on the index valuation, so that we can have a bottom line.
5. Mistakes
I have checked many articles about this calculation method, but for the time being, I have only seen that Mr. Tianma Tianma has mentioned it, and I have also asked for advice from @明大教主@大豆说@Calculus Quantitative Price to vote for a few old irons, also see Thank you for the post of @huiyuanwalking about the calculation of index valuation.
I don’t know if there is a better way to obtain the “weight factor”. In the above calculation process, it is found that the effect of “buy equity ratio” is similar to the weight factor. I don’t know if there are any flaws in this calculation method, so writing this article is more about asking and discussing.
61 has limited ability. If you find problems or have other suggestions, please feel free to let me know.
Extended reading: “61” index fund investment guide series articles (beginners must read)
$CSI 300ETF(SH510300)$ $Zhonggai Internet ETF(SH513050)$ $Dividend ETF(SH510880)$
@Today’s topic @ETF star push officer @snowball creator center @snowball fund
#雪ball star plan# #snowball ETF star push officer#
Risk warning: The fund has risks, and you must be cautious when entering the market. Article content is for reference only and does not constitute investment advice.
There are 61 discussions on this topic in Snowball, click to view.
Snowball is an investor’s social network, and smart investors are here.
Click to download Snowball mobile client http://xueqiu.com/xz ]]>
This article is reproduced from: http://xueqiu.com/9391624441/219302851
This site is for inclusion only, and the copyright belongs to the original author.