Dear friends: Happy New Year, continue to offer some personal investment thoughts.
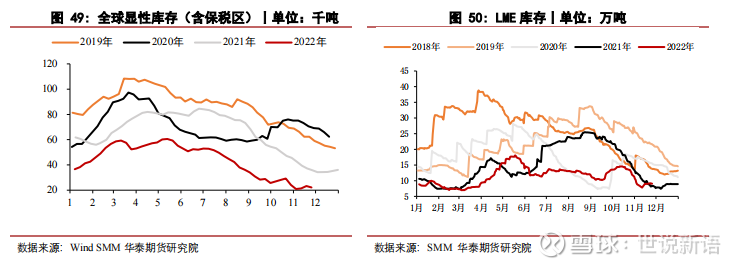
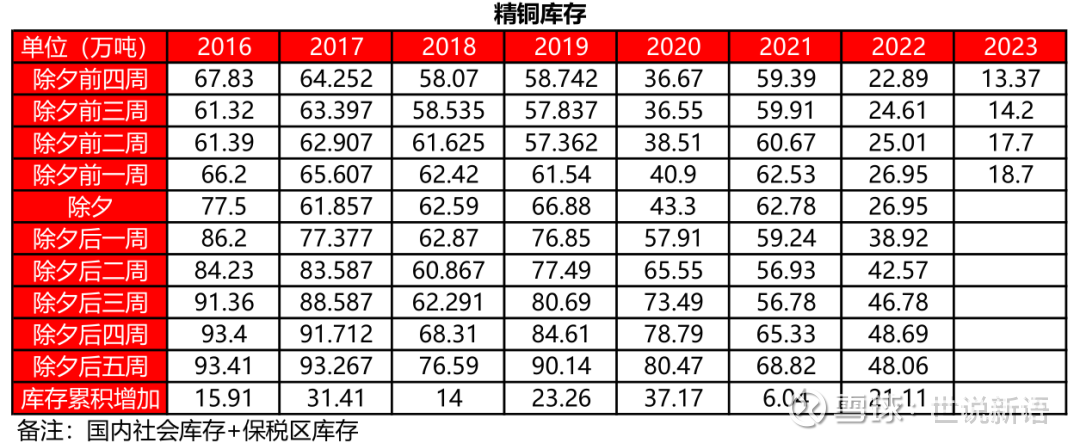
At the beginning of 2023, amidst doubts, copper prices continued to rise. Numerous cycle investors and brokerages are puzzled, which is quite different from their assertion that oversupply, first decline and then rise, their most common statement is “strong expectations, weak reality”, but the 3-4 days of overseas inventory, the domestic historically low Inventory, is this a weak reality? ![]()
——————————————————————
In 2022, under the situation of China’s epidemic situation being sealed off, real estate plummeting sharply, and the Federal Reserve raising interest rates continuously, copper prices fell by only a dozen points throughout the year. I can only understand that the market in 2022 is a tight balance between supply and demand , which may be due to Copper output was lower than expected and copper consumption was higher than expected.
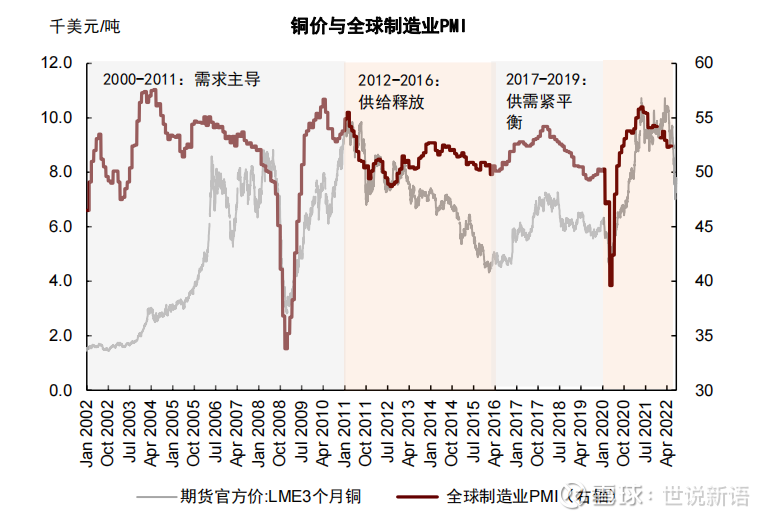
The core elements that will drive copper demand in the future are photovoltaics, wind power, electric vehicle price cuts, and the resulting power infrastructure construction. This is not only reflected in my country, but also in the world. These elements are macro-weakly correlated. The cyclicality of copper will also be very different from the past. These factors will not even change much due to the game between major powers. The climate issue is a common global interest, and it is a rare intersection between my country and the West.
The long-term copper supply increment is slight, the long-term demand growth is strong and certain, the short-term supply and demand are tightening, and the historically low inventory is superimposed.
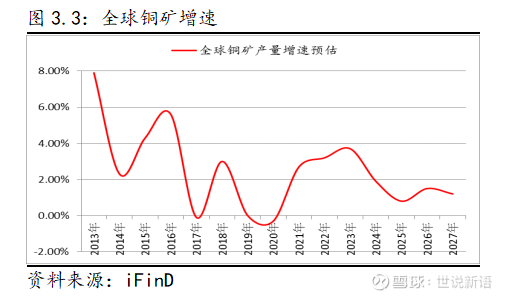
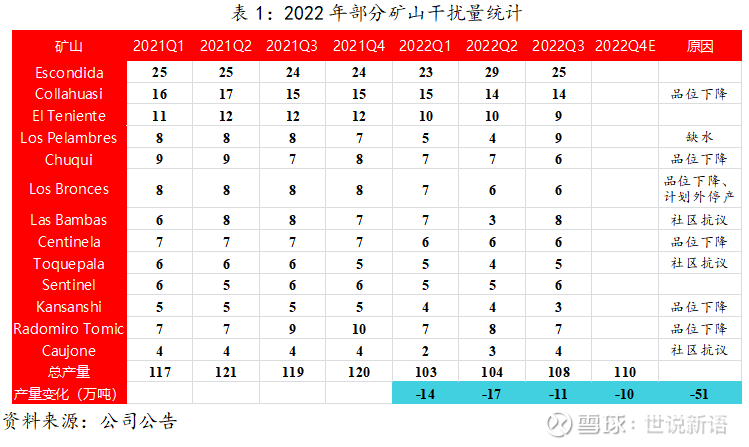
From the perspective of the supply side, the world’s copper mines are limited and concentrated. Researchers have already taken stock counts and reached a consensus. The actual output of the disturbance factors will be discounted, and the increase will gradually dry up after 24 years.
ICSG released preliminary global copper supply and demand data from January to November 2022:
【Copper Mine】
From January to November, the output was 19.864 million tons, a year-on-year increase of 3.2%; of which:
1) Chile -6% year-on-year;
2) Peru +3% year-on-year;
3) Congo +28% year-on-year;
4) China +6% YoY
【Refined Copper】
From January to November, the output was 23.483 million tons, a year-on-year increase of 3.4%; of which:
1) China +5% year-on-year;
2) Chile -5.4% year-on-year;
3) Congo +18% year-on-year;
From January to November, the consumption was 23.867 million tons, a year-on-year increase of 3.4%; of which:
1) China’s dominant copper consumption +6% year-on-year;
2) Copper consumption in regions other than China was about +0.5% year-on-year.
According to the data released by ICSG, there is a shortage of 384,000 tons of refined copper from January to November.
—————————————————————
Copper is the earliest metal used by human beings. The mines that are easy to find have long been used up, and new discoveries only exist in the fringe areas where human beings rarely go. Since 2007, the price of copper has stagnated, and exploration investment is limited, so few new discoveries have been made.
The increase in supply of copper mines is limited, but the increase in copper demand is obvious. From the perspective of electric vehicles replacing traditional fuel vehicles, electric vehicles consume 83kg of copper per vehicle, while traditional gasoline vehicles consume 23kg. As of November last year, the number of cars in my country was 3.18. 100 million, to complete the replacement needs to increase copper consumption by 18 million tons. What if it is a fuel car all over the world? It is foreseeable that with the continuous decline in the installed cost of photovoltaics and wind power, and the continuous reduction in the cost of electric vehicles and power batteries, the future demand for copper will soon become dominated by green demand, the shortage will continue to increase, and the cycle will gradually disappear.
To sum up, copper is a typical demand logic , and it is difficult to have accurate statistics on copper demand data. It is easier to see clearly from the perspective of marginal changes to explore the future supply and demand of copper.
—————————————————
Assuming that 2022 is a tight balance between supply and demand, look at the future growth and decline of core elements from the perspective of marginal changes:
In 2022, my country’s macroeconomic environment is extremely harsh. It can be said that the installed capacity of new energy has not met expectations, but the bidding data indicates the high growth in the future, especially considering that since the beginning of the year, the silicon material has been directly cut from 300,000 and the components have fallen sharply. Promote photovoltaic installation. The installed cost of wind power has also been greatly reduced in the past two years. Real estate has fallen off a cliff, top100 sales have fallen by 41.6%, and the completed area has fallen by 15%. This year, the industry is bound to ease.
1. Photovoltaic: 87.4GW (+60.3%) will be added in 22 years, and it is expected that the new installed capacity will increase by more than 50% in 23 years
2. Wind power: 37.6GW (-21.0%) will be added in 22 years, and it is expected that the new installed capacity will increase by more than 50% in 23 years
3. Electric vehicles: 6.89 million units sold in 22 years, +93.4% year-on-year, and sales are expected to increase by more than 30% in 23 years
4. Real estate: The completed housing area in 22 years is 860 million square meters (-15%), and it is expected to fall by no more than 5% in 23 years
5. Power grid: It is estimated that the investment will increase by 3% in 22 years, and the investment will increase by more than 4% in 23 years
From the perspective of my country alone, demand-pull factors are strong, and the drag on real estate will be greatly alleviated.
Given historically low inventories, supply disturbances are no longer enough to change the reality of actual shortages.
The world consumes more than 25 million tons of copper every year, and China currently accounts for more than half. China is the most important and largest market in the field of photovoltaic and wind power electric vehicles, but Western developed countries are also making every effort to promote these fields. In addition, there are still about 750 million people in the world who do not have access to electricity. The emergence of new energy, especially cheap photovoltaics, provides a cheap solution for these people’s electricity consumption.
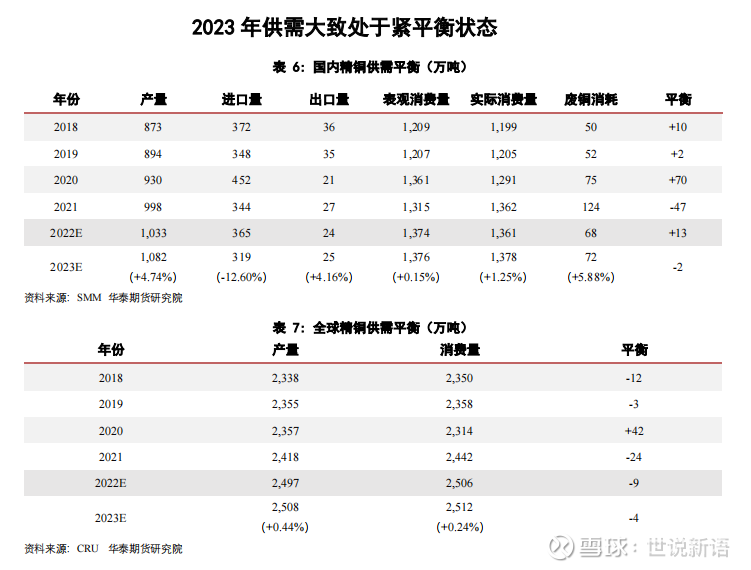
Looking forward, according to the marginal changes in the main factors of supply and demand, 2023 will be more tightly balanced than 2022, and the shortage will start in 2024 and continue for many years.
For a simple comparison, s2021, s2022, and s2023 are three-year copper consumption, and look at the incremental changes in 2023:
s2021=s photovoltaic + s wind power + s electric vehicle + s power grid + s real estate industry chain + s others
s2022=s photovoltaic (1+60%)+s wind power (1-21%)+s electric vehicle (1+93%)+s power grid*(1+3%)+s real estate industry chain (1-15%) +s other
s2023=s photovoltaic (1+60%) (1+50%)+s wind power (1-21%) (1+50%)+s electric vehicle (1+93%) (1+30%)+s grid (1+3%) (1+4%) + s Real Estate Industry Chain (1-15%) (1-5%) + s Others
s2022 increment=s2022-s2021=s photovoltaic 60%-s wind power 21%+s electric vehicle 93%+s power grid 3%-s real estate industry chain*15%
s2023 increment = s2023-s2022 = s photovoltaic 80% + s wind power 40% + s electric vehicle 60% + s power grid 4% – s real estate industry chain * 4.25%
s2023 increment – s2022 increment = s photovoltaic 20% + s wind power 61% – s electric vehicle 33% + s power grid 1% + s real estate industry chain * 10.75%
Many people will think of the situation of copper used in household appliances and the recycling of scrap copper. The overall trend of home appliances and real estate completions is consistent. Last year, except for freezers and refrigerators, which had a single-digit sales increase due to the stockpiling of goods due to the epidemic, most of the other sales fell, but not more than 10%, which was better than the completion data. As for scrap copper, I think it is also closely related to the real estate industry chain, including household appliances. The recycling of scrap copper fell by about 20% last year. So these two categories can be reflected in the real estate industry chain.
———————————————————
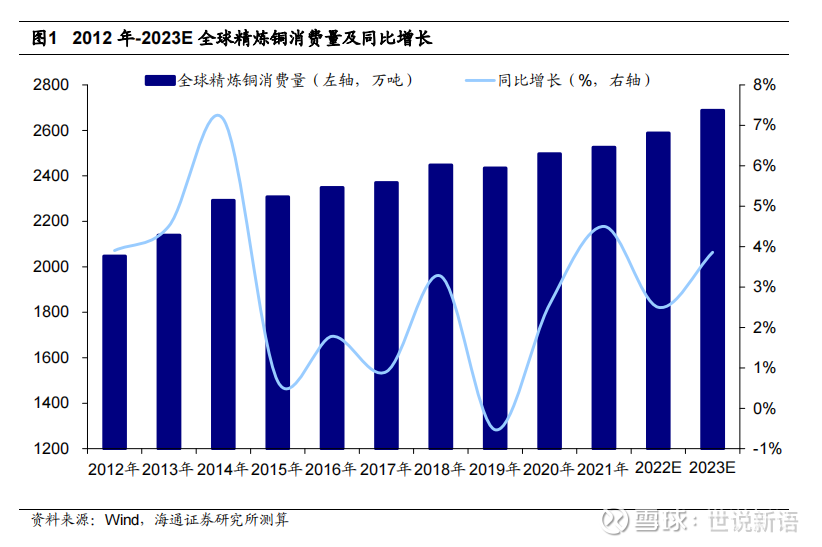
Attached are several research institutions’ forecast tables for supply and demand:
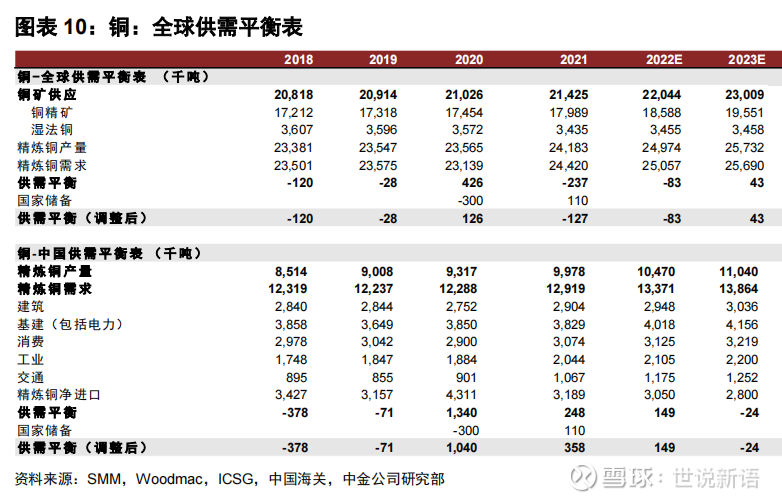
Haitong Securities: Global refined copper consumption in 2021 will be 25.256 million tons, a year-on-year increase of 4.5%. It is estimated that the global refined copper consumption in 2022 will be 25.887 million tons, a year-on-year increase of 2.5%; in 2023, the global refined copper consumption will be 26.871 million tons, a year-on-year increase of 3.8%.
———————————————————
On the eve of New Year’s Day, I wrote an article ” A New Main Line: The Cost of New Energy Installed Machines Continues to Fall “. This article is a continuation ![]()
$Zijin Mining(SH601899)$ $China Nonferrous Mining(01258)$ $China Gold International(02099)$
There are 15 discussions on this topic in Xueqiu, click to view.
Snowball is an investor social network where smart investors are all here.
Click to download Xueqiu mobile client http://xueqiu.com/xz ]]>
This article is transferred from: http://xueqiu.com/7924227668/240577770
This site is only for collection, and the copyright belongs to the original author.