
There are a lot of terms in this article, some of which are quite awkward. It is recommended to read them carefully after collecting them.
Recently, the article “Buyer’s Perspective: Calculation Method of Index Valuation (PE)” by 600 million layman has aroused intense discussion on the calculation of index valuation. He also exchanged some questions with me before writing, but I didn’t study this issue in depth at the time, so I didn’t give a satisfactory answer at that time. Recently, I thought about it systematically and sorted it out, hoping to answer his question well.
First of all, there has always been disagreement about the calculation method of index valuation, and many people have discussed it, but it did not attract everyone’s attention at the time. Among them, the biggest disagreement comes from how index constituents should be weighted when calculating valuations.
According to the calculation instruction document of the almond index, there are the following weighting modes: market capitalization weighted value, equal weighted value, positive equal weighted value, average value, median, taking PE-TTM as an example (where N is the total number of samples):
Market capitalization weighted value Calculation formula: * ∑ market value / ∑ net profit *. This indicator means that you split the investment funds into N shares according to the company’s market value, and finally get the PE-TTM value of a basket of stocks. Equal weight calculation formula: * N / ∑(1 / (market value / net profit)) *. This metric means that you split your investment funds into N equal parts, then invest in N companies, and you end up with the PE-TTM value of a basket of stocks. Positive equal weight Calculation formula: * M / ∑(1 / (market value / net profit)) *. This metric means that you split your investment capital into M equal parts, then invest in M companies, and you end up with the PE-TTM value of a basket of stocks. where M = N – the number of loss-making companies. There are different exclusion rules for different indicators:
When calculating PE-TTM, it means excluding all unprofitable businesses.
When calculating PB, it means excluding all companies with negative net assets (more common in ST or fast-delisting companies, Hong Kong stocks and U.S. stocks have some long-term large-scale dividends, resulting in negative net assets companies).
When calculating PS-TTM, it means excluding all companies with 0 turnover (which can be seen in a very small number of companies that are about to be delisted, and a small number of investment companies in Hong Kong stocks).
When calculating the dividend rate, it means excluding all companies that do not pay dividends.
Arithmetic mean calculation formula: * ∑(market value/net profit) / N *. This indicator has only statistical significance and is used to reflect the valuation status of most normal companies. Median calculation formula: All companies PE-TTM are sorted from small to large, if the total is odd, take the middle number; if the total is even, take the middle two numbers, add the sum and divide by 2 . This indicator is only statistically significant and is used to reflect the valuation status of the entire market. In addition to these five, there is another scheme: weighted value weighting.
Weighted weighted value Calculation formula: * ∑ (market value of constituent stock with heavy weight ) / ∑ ( net profit of heavy stock with constituent stock) *. This indicator means that you purchase a basket of stocks according to the proportion of constituent stocks in the index. The result of this calculation ultimately reflects the PE-TTM value of your actual investment in this basket of stocks.
Each method has advantages and disadvantages:
First, culling negative numbers is inaccurate. For example, there are some bad fruits in a fruit basket, and the seller says that the price is only based on good fruits, which is obviously unreasonable. Arithmetic mean, equal weight and median are only statistically significant, but they deviate significantly from actual investment. The advantage of weighted value according to the overall market value is that it is more convenient to calculate, and data is relatively easy to obtain. It can be calculated only by index constituent stocks (the weight of constituent stocks is not required). The advantages of calculating according to the weighted value of (component stock) are: The actual investment is also the most reasonable calculation method in theory. However, the data requirements are very high, and theoretically, the weight of the index constituents every day is required. However, this data requires the authorization of the index compilation agency, and if it is not available, it cannot be calculated. For example, the China Securities Index generally only announces the weight of the index constituents on the last day of each month. If this is used as the weight of the index constituents for the next month, there will be a certain error. Occasionally, if there is a change in the constituents, resulting in a large change in the weight of the constituents of the index, the error may be larger. (Theoretically, the Wind terminal can only obtain the data of the index constituent stocks on the last day of each month)
If conditions permit, the weighted value is definitely the best choice, followed by the overall market capitalization weighted method. In addition, excluding negative values is not a particularly reasonable choice.
case
So what is the difference between the calculation results based on the overall market capitalization method (component stock market capitalization method) and the weighted value (component stock index weighting method)? Analyst Chen Jiahe of Cinda Securities conducted a comparative analysis of the two calculation methods in an annual report system in 2017. In his article compares a case:
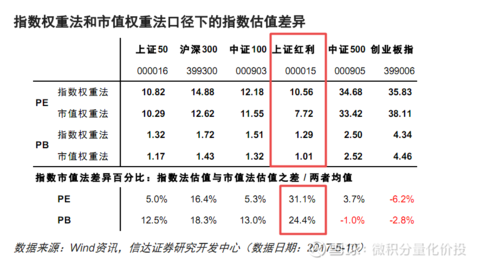
From the observation of the above case, the difference in the calculation of the Shanghai Stock Exchange Dividend Index is the largest. why? Because the weights of other broad-based indexes are mainly based on the free float market capitalization of the constituent stocks, the difference between the constituent stock market capitalization method and the constituent stock index weighting method is not very large. However, the dividend rate weighting method adopted by SSE Dividends, if the difference between the weight of the index constituent stocks and the market value is relatively large, the final calculation results will also be relatively different. From this point of view, for those indices that are not weighted based on free-float market capitalization (such as equal weight, weighted by dividend rate, etc.), the difference between the market capitalization method and the weighting method will be relatively large, which requires special attention.
At present, the Excel add-in of Wind Financial Terminal has been updated, adding index valuation results under different calculation methods.
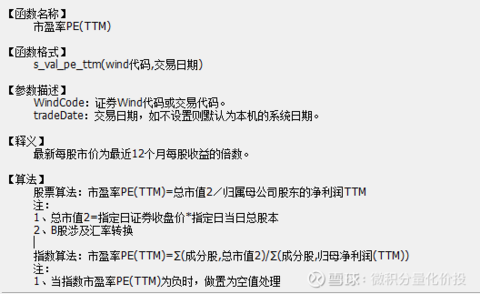
For example, for the price-earnings ratio PETTM, negative numbers are excluded here. Here is the direct summation of the total market value of the constituent stocks and the net profit attributable to the parent.
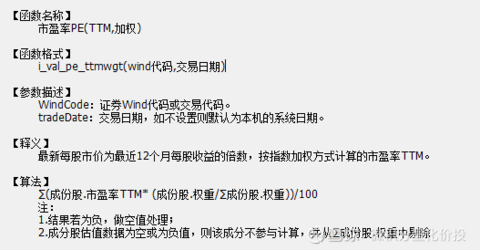
For example, for the price-earnings ratio PE (TTM, weighted), but this weighting is not the same as the previous weighting of the constituent stocks, this is directly weighted according to the constituent stocks’ P/E ratio TTM, and the weighted index TTM is obtained.
To give a simple example: Suppose the index is selected by two assets A and B,
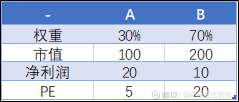
If according to Wind’s algorithm: PE of the exponent = 0.3 5+0.7 20 = 15.5
If it is the previous exponential weight method, the PE of the index = (0.3 100+0.7 200) / (0.3 20+0.7 10) = 13.07
However, from the practical point of view of investment, the index weighting method should be closer to actual investment. Therefore, everyone needs to pay attention when citing Wind as a valuation indicator.
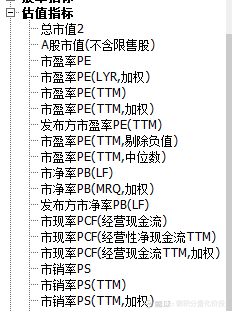
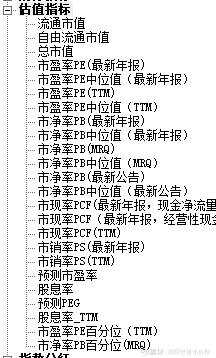
However, at present, Choice has not updated the valuation indicators related to different calculation methods. Here are the Choice Index valuation metrics:
improve proposals
Is there any room for improvement in the previous scheme? The answer is definitely yes. Sometimes, we not only pay attention to the current time point and the comparison of cross-sectional valuations of different indices, but also pay more attention to the performance of the current valuation in the historical range, and whether the current valuation is relatively overvalued or undervalued compared to the previous historical data .
Consider two special cases. For example, the MSCI China A50 Index was released recently, and there is no historical index constituent information. According to the previous calculation method, it is impossible to calculate the historical valuation of the index, but we need historical valuation to do it. refer to.
Another situation is that there are relatively large changes in the constituent stocks of the index, and the past can no longer represent the present. For example, the CSI 300 index before 2014 was mainly in the financial real estate industry (mainly banks), but the current CSI 300 is now It has been relatively balanced, and the weight of banks is very low. If the current valuation is compared with that in 2014, the current valuation must be high, but this is caused by the index constituent stocks at that time, not the current constituent stocks are undervalued. (Too many bank stocks in 2014 weighed down the index’s valuation).
If you want to solve this problem, a feasible solution is to assume that the weights of the index constituent stocks are different, and then go back to the historical financial data of the constituent stocks to calculate the valuation data on each day. In this way, it can be ensured that the data calculated for each day in the previous history is the valuation calculated according to the current and latest constituent equity weights. This line of thinking, in theory, can solve the two extreme cases discussed above.
However, there is a problem with this, that is, the current constituent stocks may not have been listed before. For example, CATL, a constituent stock of the CSI 300 Index, was not listed in 2014, and there was no data at that time. If this happens, the weight of CATL will be eliminated, and then its weight will be distributed to other constituents according to the weight of the constituents.
At the same time, it is necessary to pay attention to a problem that the valuation data of a cross-section at a certain time point is not unique. For example, using the latest index constituent stock data to calculate the valuation data of 2014-12-31 is different from the last month’s index constituent stock to calculate the valuation data of 2014-12-31, although both are calculated in 2014 -12-31 valuation data. Because the calculated index constituents are different.
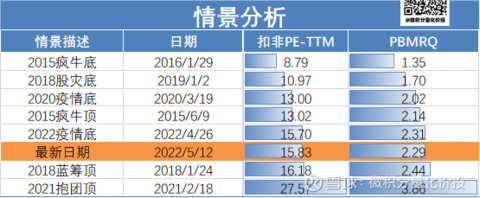
Here is an example of how I calculated the PE and PB valuations of MSCI China A50.
The weight of the index constituents. Due to the authorization of the MSCI China A50, the index weight of the MSCI China A50 cannot be found in China. Here, the index weight is estimated based on the position data of an overseas MSCI China A50 ETF. (There must be errors, but there is no way, it is better than no data at all.) Relevant financial indicators, obtain the relevant financial data of each index constituent stock on the latest date on the deadline (prediction data does not participate), the financial data considered are mainly : Net profit attributable to shareholders of the parent company (TTM) used to calculate the price-earnings ratio and equity attributable to shareholders of the parent company (MRQ) used to calculate the price-to-book ratio In addition, the total market value of the constituent stocks on each trading day is required. When retrospecting the weight of constituent stocks, the following processing will be done: If the index constituent stocks have been listed for less than one month, they will not be included. The market value during this period is unreasonable because of the effect of new shares that have just been listed. In addition, for the stocks listed on the backdoor, only the data after the backdoor listing is considered. For example, SF Express belongs to the backdoor listing, and the historical data before the backdoor listing is not considered. This is not SF’s own business. Taking into account, this is considering the progress of the annual report data update.
The calculated historical valuation of the MSCI China A50 is shown in the chart below:
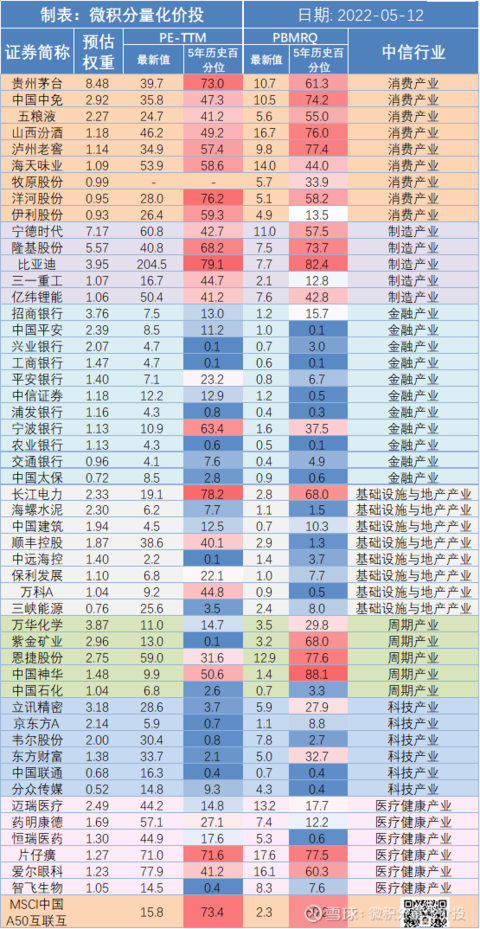
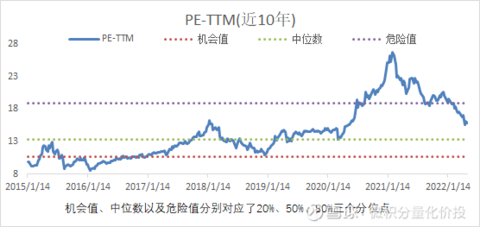
Due to limited historical data, the earliest in the past 10 years started from 2015-01-01.
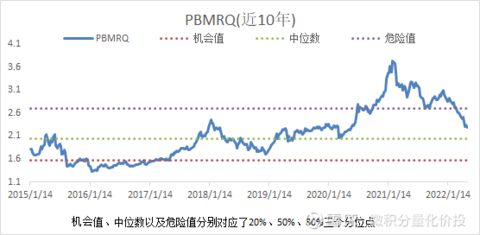
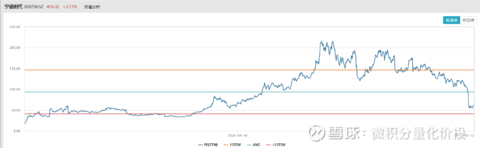
Seeing this, there will definitely be a doubt, that is why the valuation was so low in the craziest 2015? If you refer to the situation of CSI 300, this is very unreasonable. My thinking is that this method of mine does not take into account the development cycle of the company, and the valuations given by different development cycles of the company are also different. My method is to go back to historical data based on the current holdings of the index constituent stocks. For example, the current weight of the Ningde era is 7%, but in the early Ningde era, the power battery was still in the introduction or budding stage, and it entered the later stage. In the long run, the valuations given in the early market are generally not too high.
CATL only went public in 2018. Let’s look at another one that went public earlier. For example, LONGi shares are mainly in the photovoltaic industry. We all know that the photovoltaic industry has only performed very well in recent years. Historically, there was still a big loss in 2014.
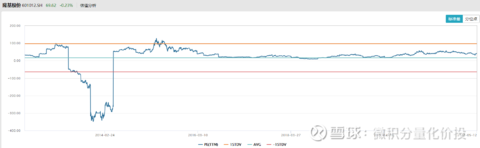
From an early point of view, the total market value of LONGi shares before 2014 was very small, only more than 10 billion, but now it has a market value of more than 300 billion. Visually, the weight of LONGi shares in 2014 should be much smaller than it is now. However, the current algorithm is based on the weight of the current market value of 300 billion to go back to history, which obviously will have a comparison error with the situation at that time.

Therefore, from this point of view, the valuation using the retrospective calculation of the existing index constituent stocks should refer to the latest data as much as possible, and the data that is too early may not be of great reference.
Summarize
Various index valuation calculations have been discussed earlier, and I don’t know if you’ve made the distinction clear. After my own analysis, I feel that the calculation of index valuation is more of an art than a science. When you use different methods and data methods (such as B stock market value, Hong Kong stock market value), you will get different results. When you find the shortcomings of a method and want to improve it, finding an improved method will lead to new problems. Press the gourd to float the scoop.
Going back to investment practice, as an investor, there is no need to worry about the differences in the results of valuation indicators on different platforms, or who is right or who is wrong. Because these data are the results of different statistical calibers. However, you should have a general understanding of the calculation of valuation indicators and understand its limitations, so that you can have your own ruler in your heart.
On the whole, the index valuation calculation should not exclude negative values. If the data conditions allow, the index constituent weight method is the most accurate. If the historical index constituent weight data is unknown, it is also a feasible method to use the latest index constituents to go back to the history.
Either way, more attention should be paid to recent historical valuation data. Data that is too early could be very different from the current scenario.
At this point, the full text is over, thank you for reading.
If you find any mistakes or omissions in my analysis, your corrections and additions are welcome.
The above content is only used as a personal investment analysis record, and only represents personal opinions. The analysis content is based on historical data. Historical performance does not indicate its future performance. It does not serve as a basis for buying and selling, and does not constitute investment advice.
References
1. Cinda Securities – Macro Strategy Special Issue: Discussing the Differences Caused by Different Recalculation Methods of Constituents in Index Valuation Work – Chen Jiahe, Gu Yongtao, 20170511
2. The almond index and industry valuation calculation documentation, Bing, 2020-03-22

Like and watch, investment makes more ¥
#星Plan Daren # #Snowball Star Project Public Offering Daren# #ETF Star Push Official#
@ Egg Roll Index Fund Research Institute @ Today’s topic @ Snow Ball Creator Center @ Egg Roll Fund @ ETF Star Push Officer @ 600 million layperson @陈嘉豪
Quickly retrieve historical articles
$CSI 300(SH000300)$ $China A50ETF(SH563000)$ $ Bonus ETF(SH510880)$
This topic has 13 discussions in Snowball, click to view.
Snowball is an investor’s social network, and smart investors are here.
Click to download Snowball mobile client http://xueqiu.com/xz ]]>
This article is reproduced from: http://xueqiu.com/4778574435/219898076
This site is for inclusion only, and the copyright belongs to the original author.