Original link: https://limboy.me/posts/visidata/
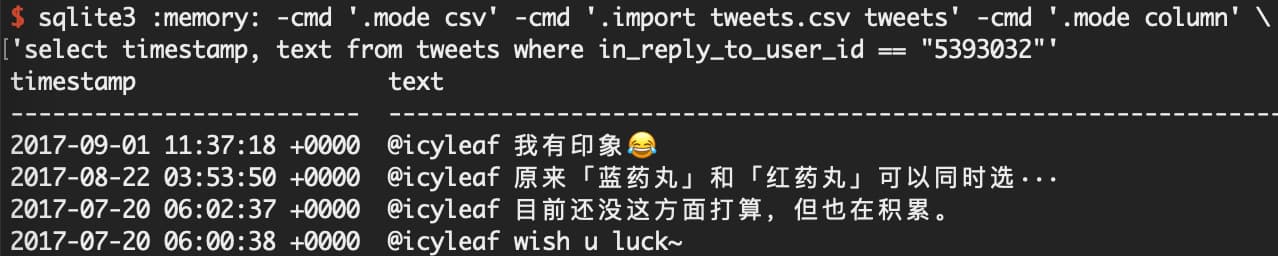
On Hacker News, I saw an article on how to easily operate CSV through SQLite . Using sqlite3’s native support for csv, execute SQL query on csv to get the data you want. It’s really convenient to try:
tweets.csv is personal data exported from Twitter. You can find the option to download an archive of your data in Twitter’s Settings and privacy. After clicking, you will receive your data after a period of time.
After saving as a bash function, it is more convenient:
csv2sqlite () { sqlite3 :memory: -cmd '.mode csv' -cmd ".import $ 1 .csv $ 1 " -cmd '.mode column' $ 2 } # usage csv2sqlite tweets 'select * from tweets limit 1'
By the way, I read the comments on HN and found that many people mentioned VisiData as a tool, and they experienced it. It is really good. It can meet the common data query work without writing SQL. Let’s take a look at the usage posture of VisiData through the tweets.csv file, combined with the specific scene.
VisiData is an analysis tool for tabular data (such as json, csv), which not only supports Excel-like data display, but also has efficient terminal operation and can process millions of rows of data.
This list of shortcut keys is very convenient and can basically cover commonly used operations.
How many Tweets are sent each year
After VisiData is installed, you can directly vd tweets.csv . The interface is as follows:
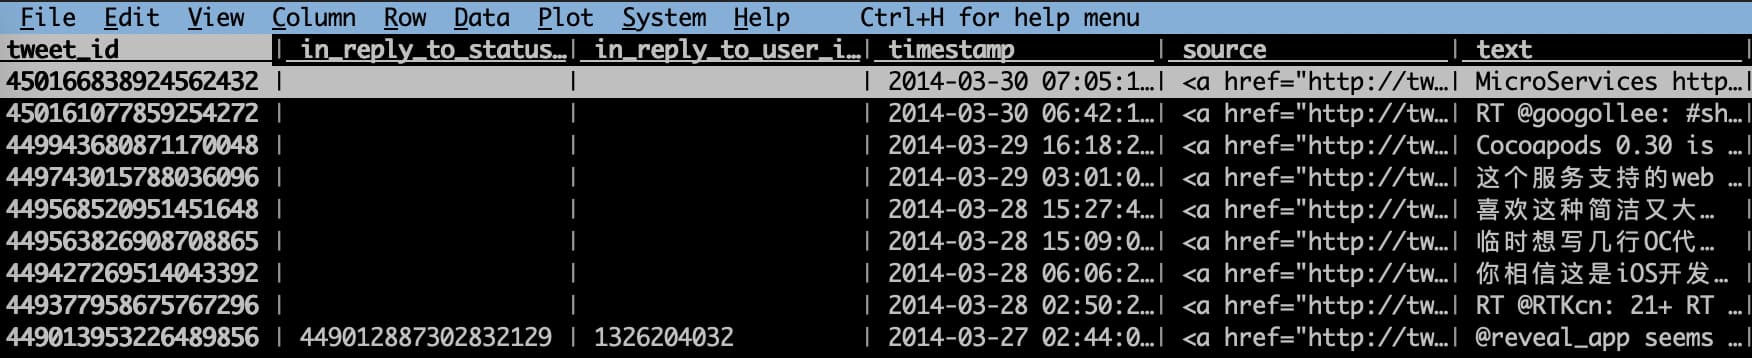
One of the columns is timestamp , which contains date and time . We need to separate Year before we can perform aggregation operations. The separation process is also very simple, first select the timestamp column, enter the shortcut key : it will enter the regular segmentation mode, enter a space , you can separate date and time , and then perform the same operation on the date column, but use - to split, so that you can get Year .
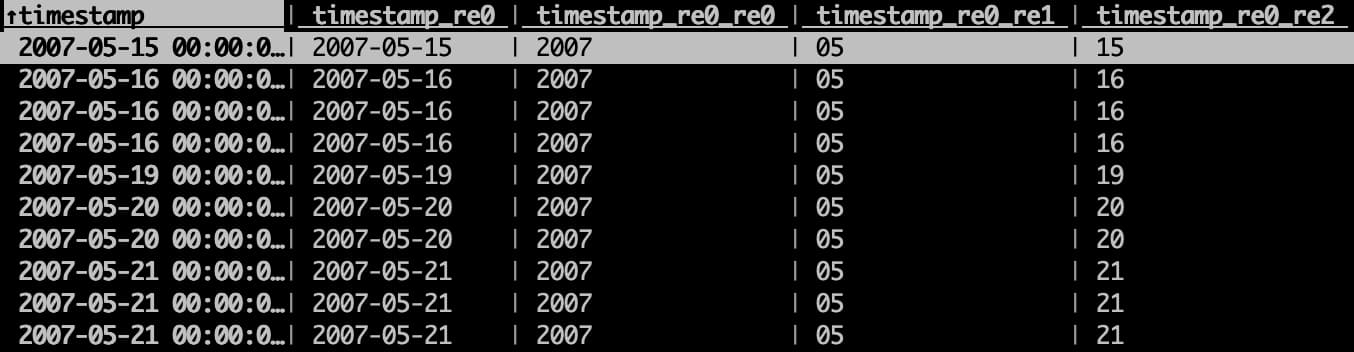
The column name is automatically generated, there is no adjustment here, it can be renamed by the ^ shortcut key.
Next, in the column corresponding to Year , press F ( shift+f ) to achieve the effect of group by , which is really convenient.
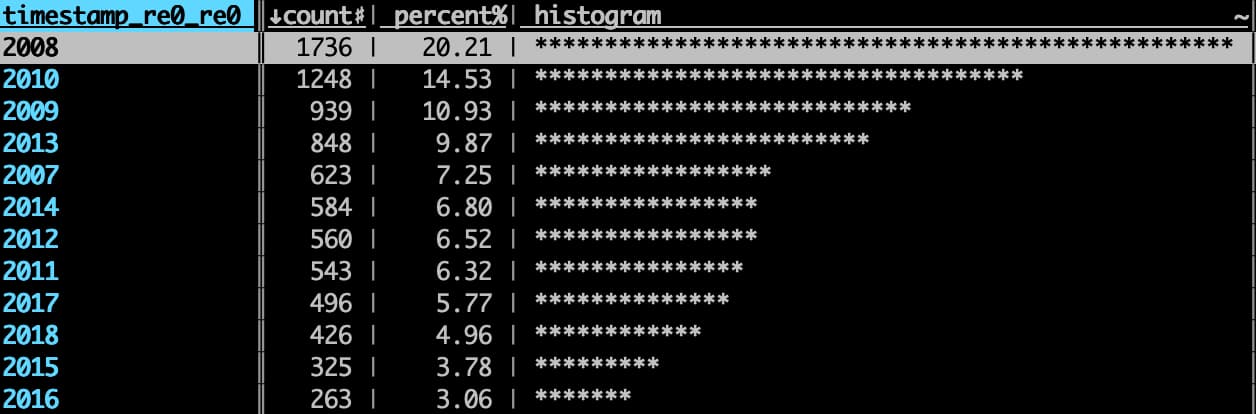
VisiData will create a new table, so don’t worry about overwriting the current table. After the operation, enter q to return to the previous table.
You can see that my favorite years to nag were 2008 and 2010, when Twitter was still accessible, and if I had any idea, I wanted to post it, and I could find a lot of interesting people on Twitter.
You can also use this method to see which days are the most frequently tweeted:
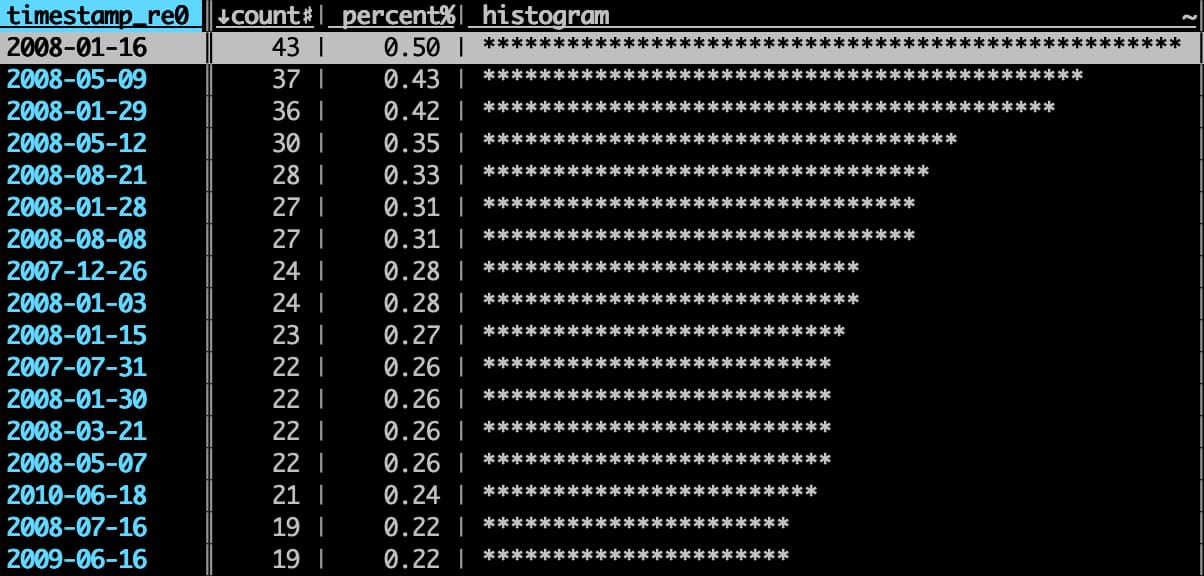
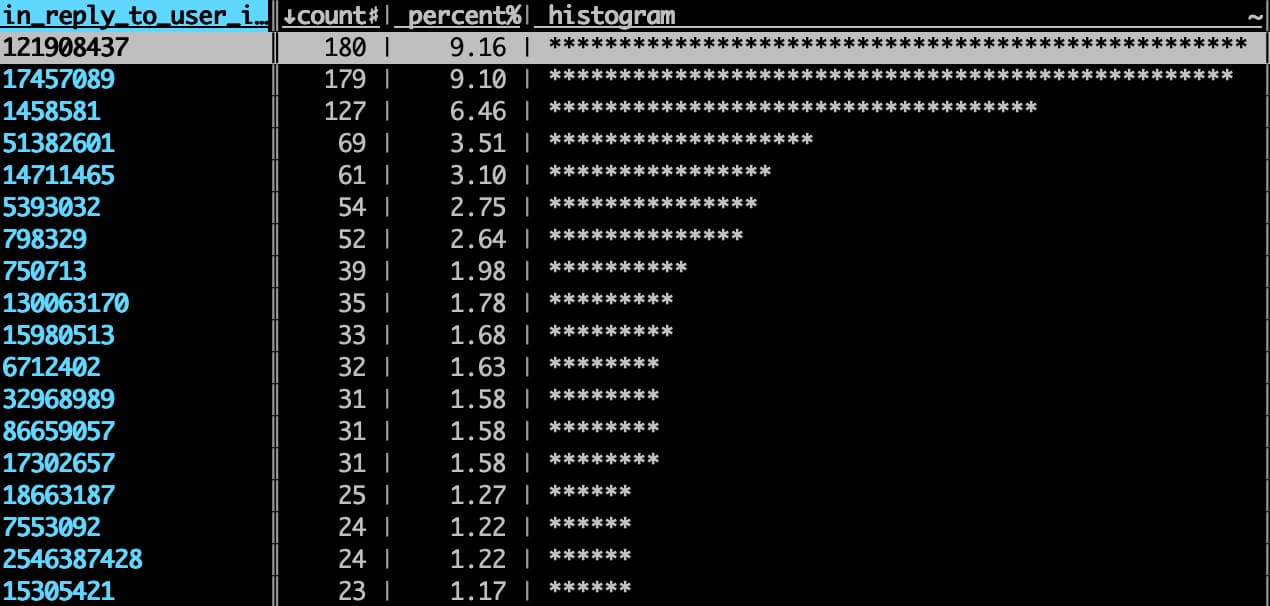
Or see who you are @ most frequently: (user_id is displayed here, you can see the corresponding person through the user_id to username service)
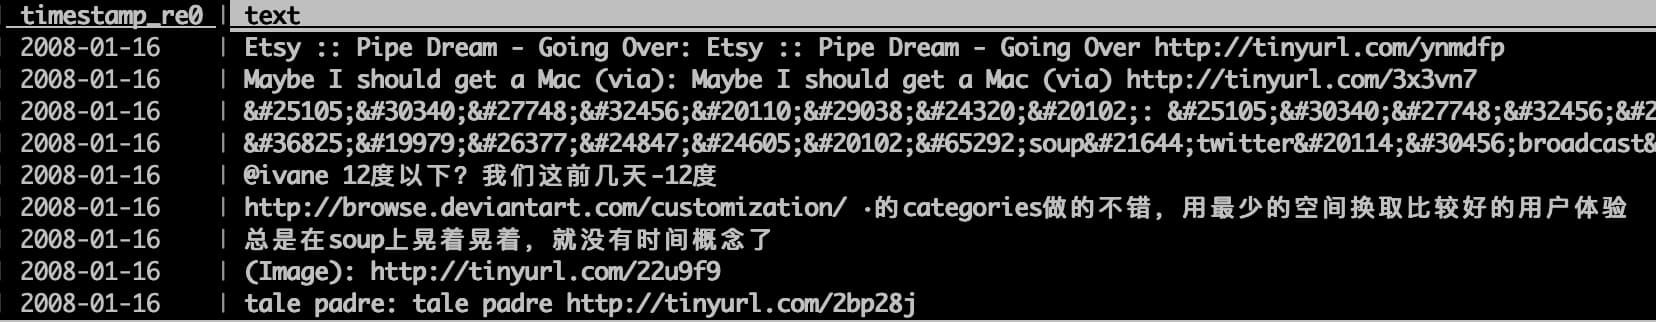
What tweets did you tweet on a day?
After finding the days with the most tweets, I naturally want to see what I have posted these days. For example, I want to see the tweets on 2008-01-16 , first select the date column, and then enter the shortcut key | , indicating that you want to select the lines that conform to the regular expression. At this time, the status bar will prompt you to enter the regular expression. Enter 2008-01-16 and press Enter to select these lines.
Although the status bar will prompt that there are N rows selected, but they do not appear in the currently displayed list, you can see it by entering the shortcut key " .
If the content of the text column is not fully displayed, you can select the text column and enter the shortcut key _ .
Graphical display of the number of tweets per month
VisiData also supports scatter plots, we can use this function to see the number of tweets per month, but the display effect is not very good.
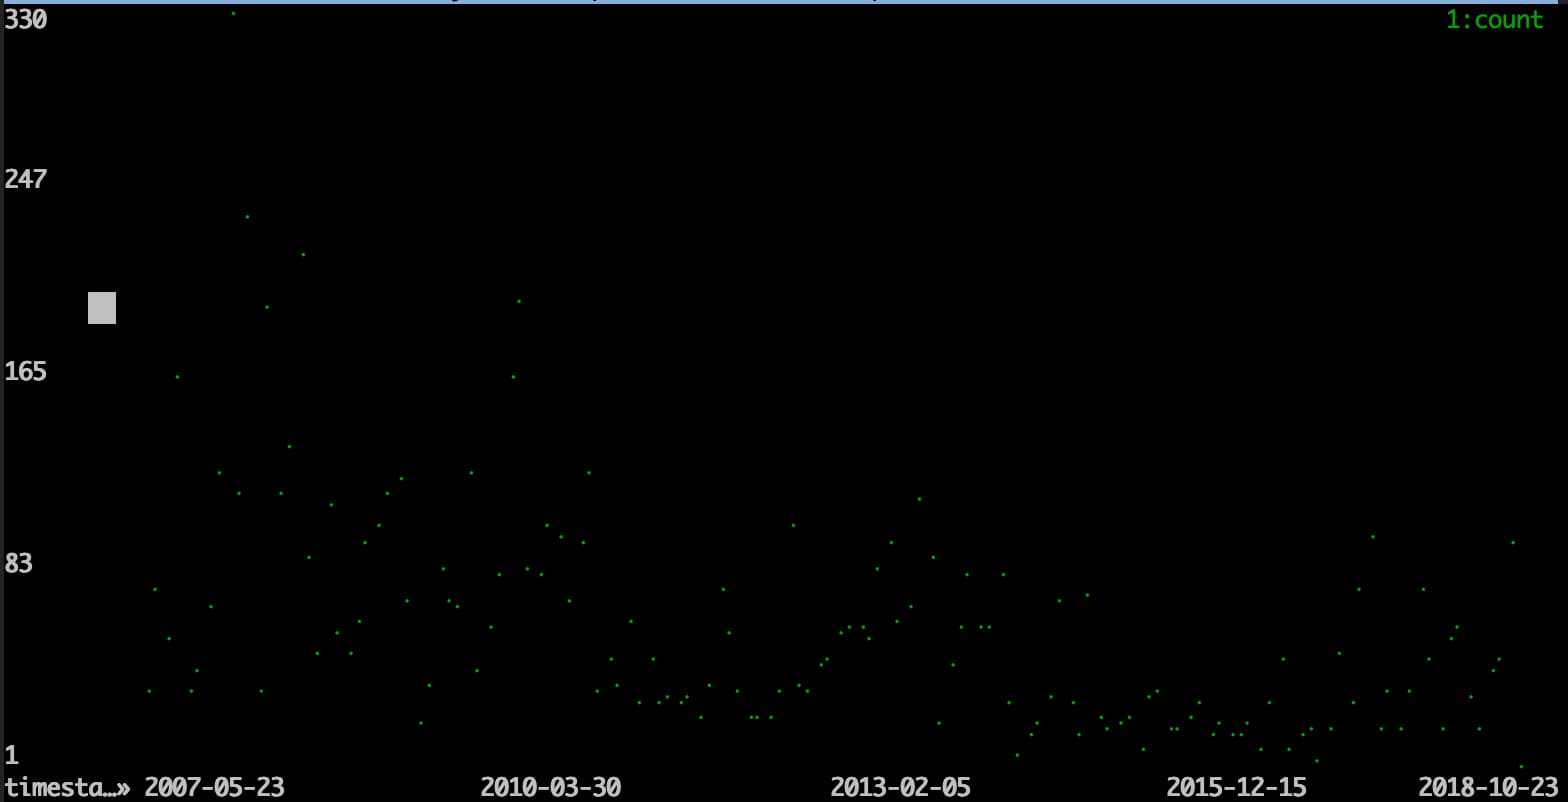
Fortunately, VisiData can export the content of the current Table to common formats such as csv , json , etc. We can import these data into other plot services to obtain better display effects.
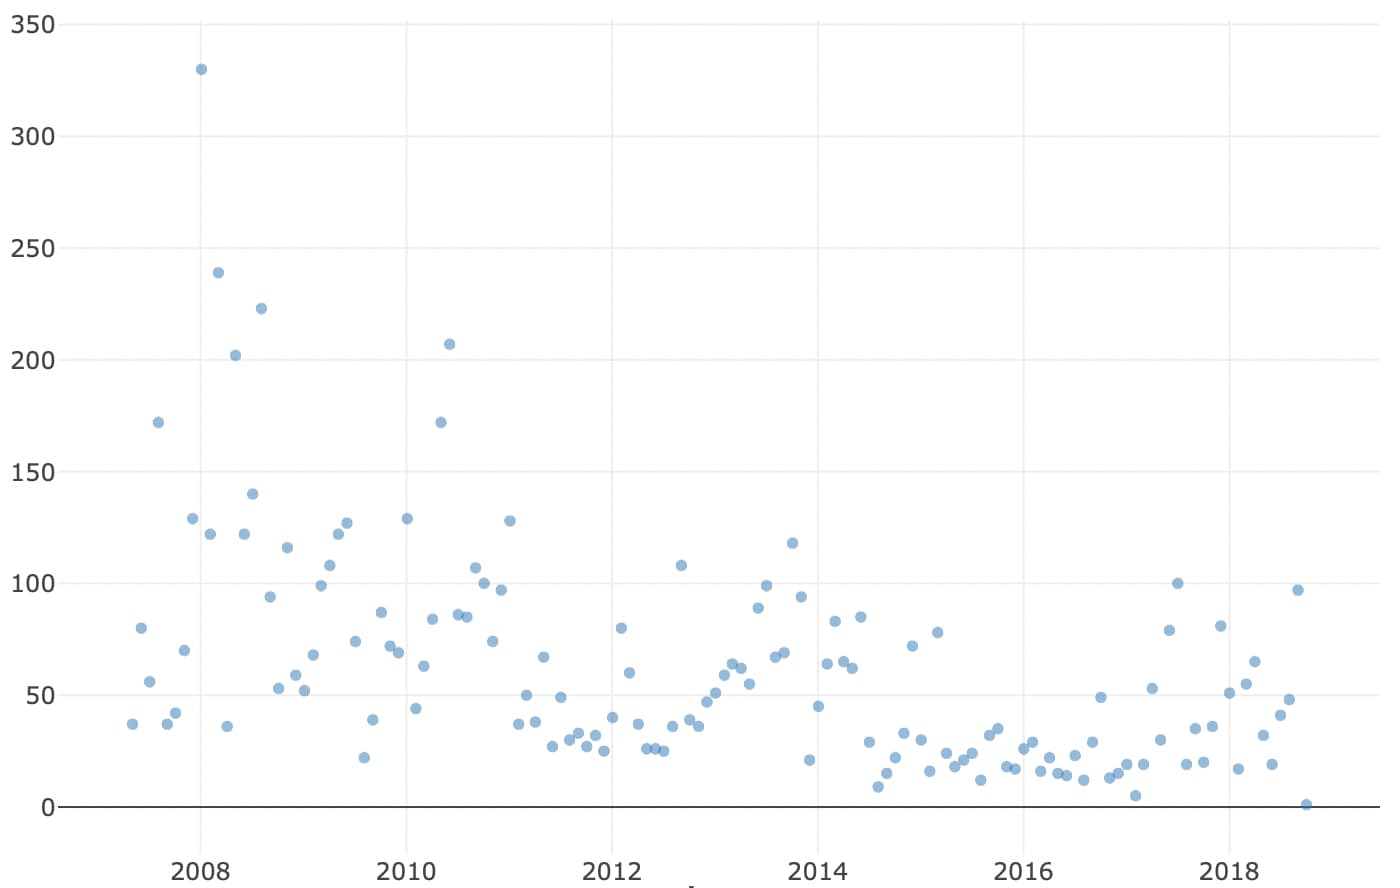
The above figure uses the online service csvplot .
summary
VisiData is an open source project with a history of more than 5 years. It is still being maintained and has a relatively high degree of trust. The above is my simple exploration, which can already meet many needs. At the beginning, I was a little resistant to TUI (Terminal UI), which was not as beautiful as GUI, but it is really convenient to operate with Terminal. If there is less complicated data analysis needs, I should choose VisiData.
This article is reprinted from: https://limboy.me/posts/visidata/
This site is for inclusion only, and the copyright belongs to the original author.