Original link: http://gaocegege.com/Blog/kubernetes/metrics-survey
TL;
DR In order to better support the collection of training metrics and the performance profiling of tasks, we designed a small-scale survey of machine learning development observability.
envd
Support profiler that is more in line with the needs of algorithm engineers
Function. Welcome to participate!
Deep learning training is rare and may be computationally intensive (Compute
intensive), it may be data intensive, or it may be memory intensive.
intensive) workloads.
This makes it profiling
The process is very complicated. When the model uses more video memory or memory than expected, or when the model training fails to use the computing power of the graphics card, it is difficult to understand what is going on. Of course, in order to solve these problems, there are also some open source products or tools.
TensorBoard
The most popular of these is undoubtedly
TensorBoard . It helps users collect metrics during training and visualize them. It is also very simple to use:
log_dir = "logs/profile/" + datetime . now (). strftime ( "%Y%m%d-%H%M%S" ) tensorboard_callback = tf . keras . callbacks . TensorBoard ( log_dir = log_dir , histogram_freq = 1 , profile_batch = 3 ) model . fit ( train_data , steps_per_epoch = 20 , epochs = 5 , callbacks = [ tensorboard_callback ])
not only
TensorFlow and Keras, PyTorch also began to support TensorBoard .
Nvidia
SMI
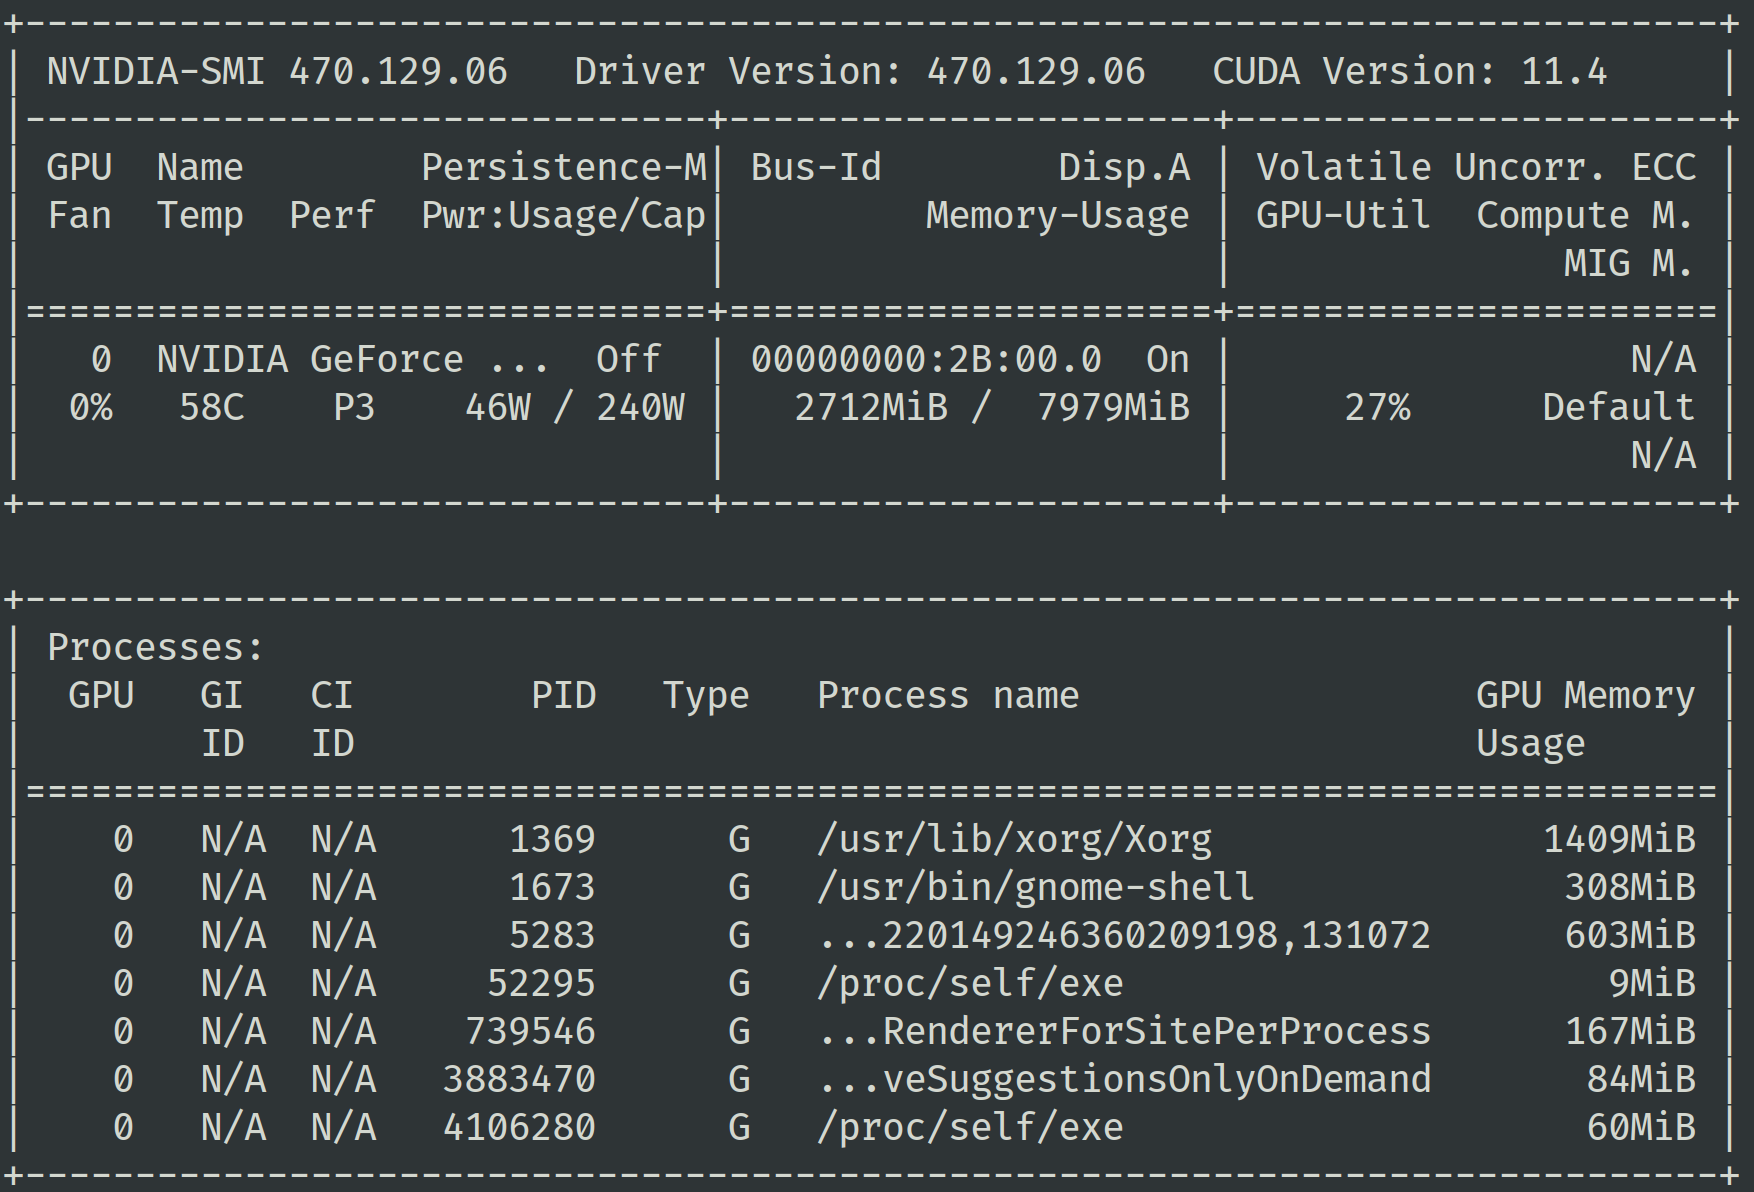
If you just want to get some hardware metrics, there is an easier way: nvidia-smi . You can view the GPU of different processes with the nvidia-smi command
Video memory usage. Usually you will want the training process to take up the vast majority of the available video memory, which means your model is using it well
GPU.
 Nvidia
SMI
In addition, you can pay attention to the power consumption (Power
consumption) indicator, when the GPU
The power consumption will increase when the computing unit of the device performs operations. A high power consumption means a higher frequency of use of the computing unit. When you find that the use of video memory is very small, or the power consumption is very low, you can try to use a larger
batch size for training. If you want to get more indicators, you can pass nvidia-smi command to obtain.
dmon
nvidia-smi is also a very commonly used performance debugging tool, it provides CLI
The interface is very simple to use.
Nvidia
Nsight Systems
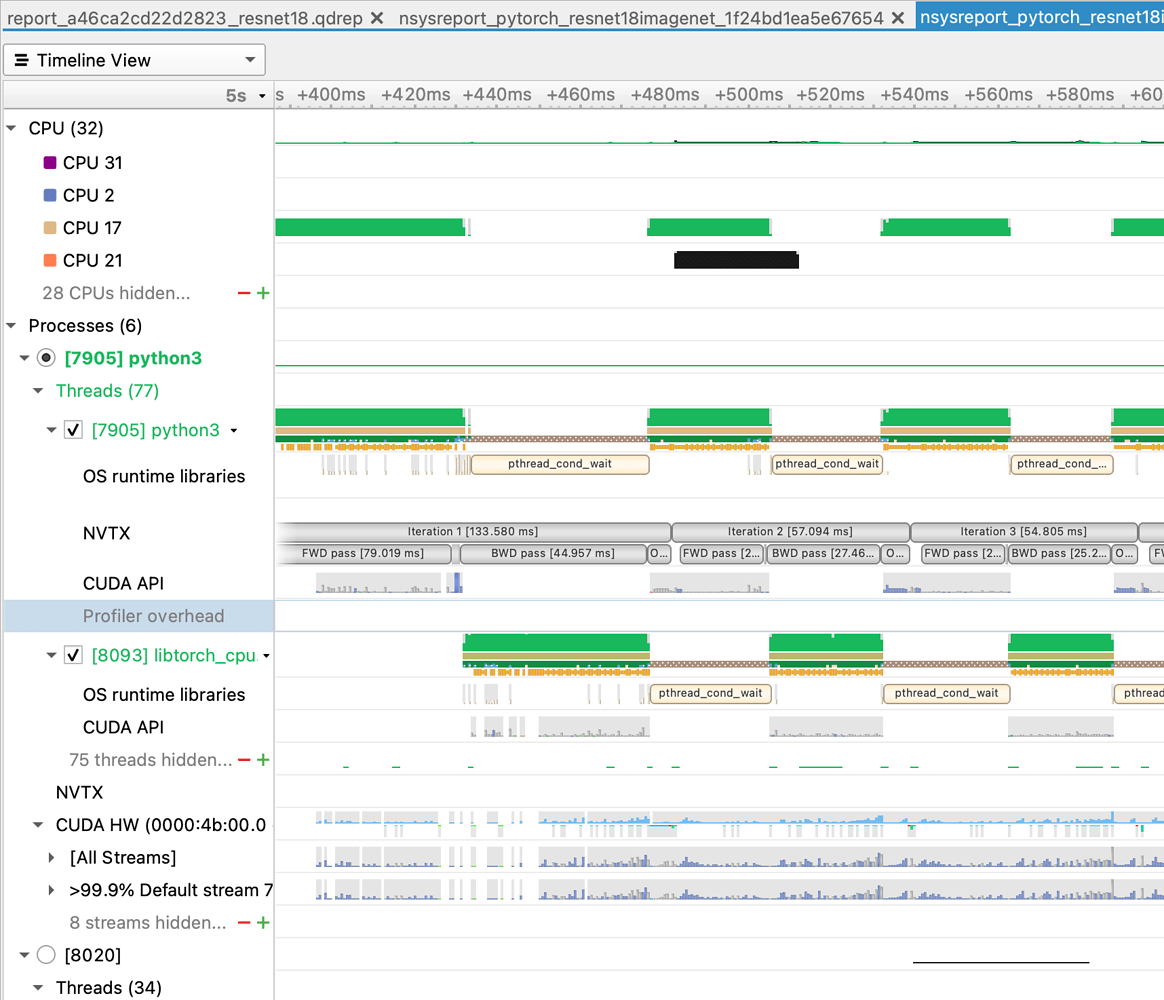
Nvidia Nsight
Systems are powerful tools for debugging and optimizing GPU programs. For deep learning training tasks, Nsight Systems
Ability to visually analyze memory usage, CUDA Kernel execution, and more. Although it is very powerful, it also has a relatively high learning threshold. If not very understanding
Nsight
Engineers of software series products, or when they are not pursuing extreme optimization, rarely use it for performance optimization.
 Nvidia Nsight
Systems
Nvidia DLProf
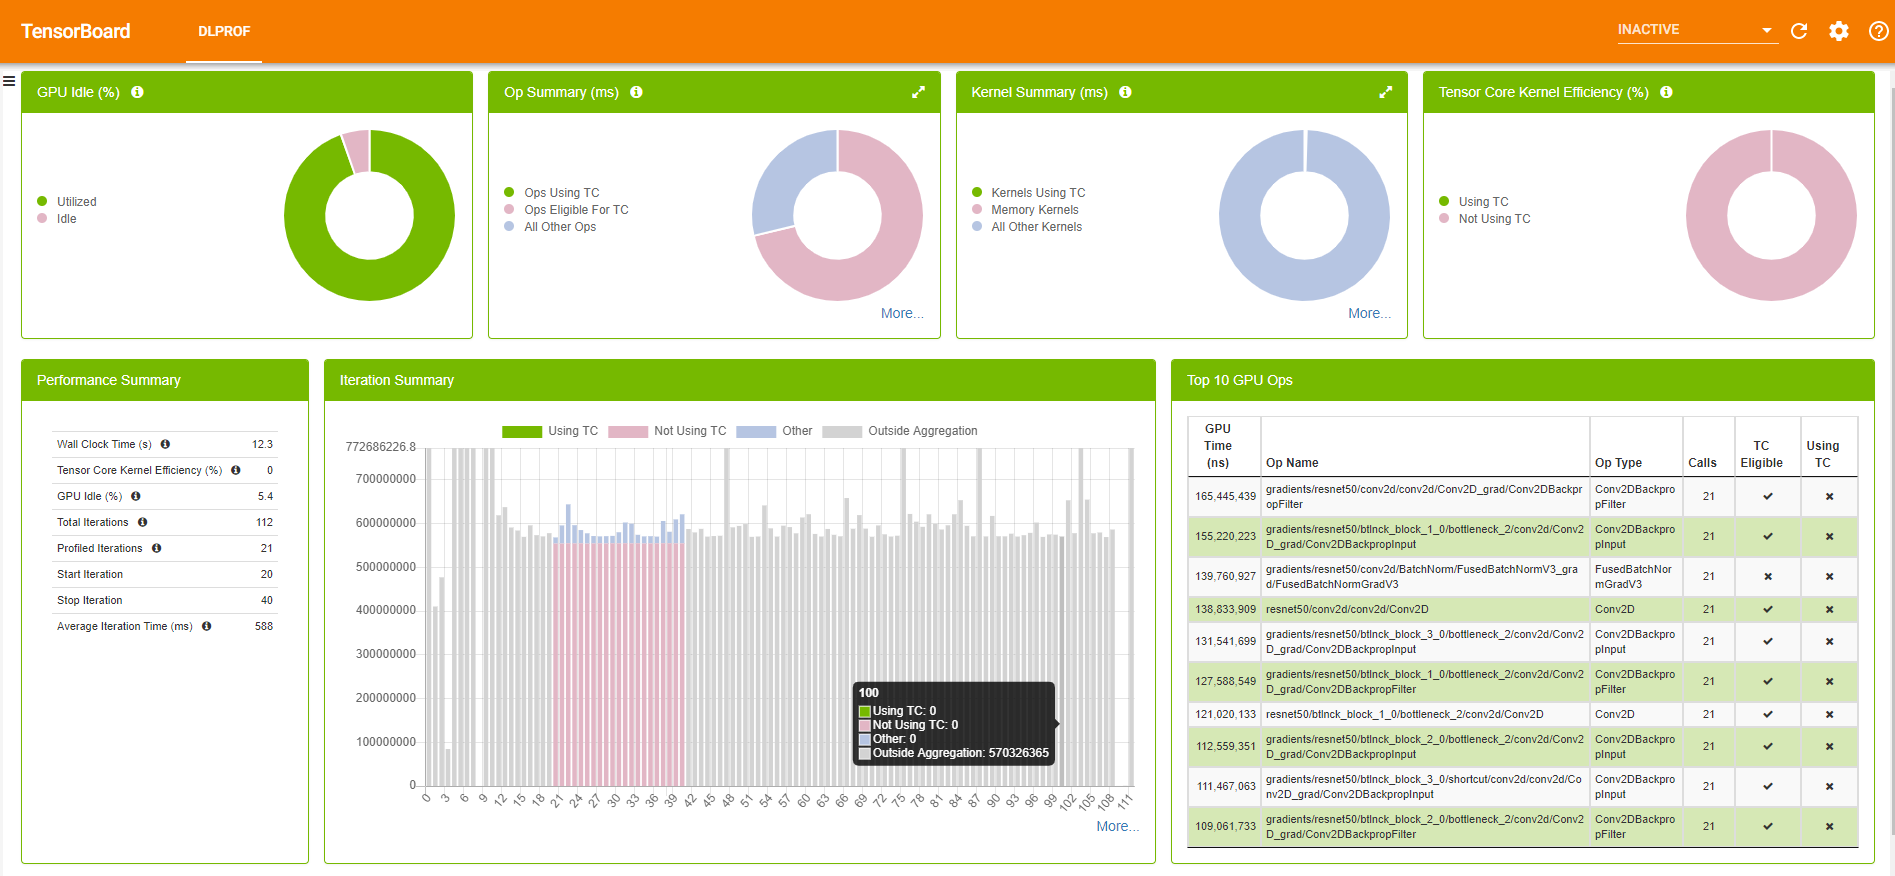
DLProf
Is a wrapper for Nvidia Nsight. You can pass dlprof python main.py
to collect metrics during training. It generates two files: sqlite and qdrep , and events_folder . can be used next
TensorBoard comes based on events_folder
Make a visual presentation.
DLProf
how to choose
While there are a variety of tools to choose from, in our opinion, these are all difficult to use. In our previous work, we also often encountered
It’s a headache when it comes to GPU-related performance issues.
To be able to better support training metrics collection and task performance
profiling, we designed a small-scale survey machine learning to develop observability small surveys , we hope in
envd
It supports the profiler function that is more in line with the needs of algorithm engineers. Welcome to participate!

references
License
- This article
is licensed under CC
BY-NC-SA 3.0 . - Please contact me for
commercial use.
This article is reproduced from: http://gaocegege.com/Blog/kubernetes/metrics-survey
This site is for inclusion only, and the copyright belongs to the original author.