It is the dream of all investors to only be the master of rising waves, that is, you don’t have to worry about falling into the trap of value destruction, and you don’t have to worry about wasting too much time and cost. No matter what stock fluctuates back and forth in disorder most of the time, its 80% increase is often completed in 20% of the time, and the trend during this period is the main uptrend.
Naturally, some people will think, can we filter out the disorderly fluctuations in most of the time and only eat the main rising waves in the 20% of the time? In theory, it is possible, but in practice, a sound investment system is required. This investment strategy is a trend following strategy.
The focus of trend following strategies: how to judge the formation, development and end of a trend. This requires fundamental and technical resonance. The fundamentals are hard enough and the logic is strong enough to achieve the best double-click of performance and valuation. The technical aspect is to make good use of the moving average system and the wave theory.
When a trend is first formed, anyone with a little common sense will judge. The most difficult thing is to grasp the continuity of the trend. It is necessary to filter out the false trend of many false breakthroughs and many times. Trend, and the process of screening and filtering is a process of continuous trial and error, and the loss in the process of trial and error is a part of it that must be endured.
Stock selection can use logical reasoning from fundamentals to ambush ahead of time. This is a left-side transaction, or you can select a trend that has just formed through technical aspects, and then filter by trial and error. This is a right-side transaction. The left-hand trading of fundamental stock selection needs to be technically expressed in the later stage, and the right-hand trading of technical stock selection also needs to be fundamentally and logically determined to determine the sustainability of the trend. The two are complementary to each other.
The last is the entry and exit and take profit and stop loss system. At this time, it is necessary to consider the changes in the fundamentals, and to use the technical volume-price relationship and the moving average system to execute.
Many people will say that it is not easy to judge the main rising wave. The one that rises more and keeps rising is the main rising wave. The key is how much it rises, how long it can rise, and when will it end? Is it a technical correction or the trend has ended? Wait for more problems. This requires not only the volume and price averages and other graphics you see on the technical side, but also a deep understanding and predictability of the fundamentals and logic of the industry trend.
Now most people agree that coal and oil stocks are taking the lead, but can you say that lithium ore and photovoltaics are not taking the lead? It is possible that the former is already in the late stage of the lead, while the latter is still in its early stages. . The big infrastructure is even more divided, because the current trend is not so clear, it is still in the stage of ambush in advance of fundamentals and logical cognition, and the real right-side trend can only be confirmed when it breaks through a new periodical high in the future. The trend of coal oil and lithium ore photovoltaics has already come out, and it is a question of how long the trend will continue.
How to judge how the main Shenglang participates? I don’t know if you can understand the above discussion. Simply put, it is to use trend following strategies to trade, use moving average systems and volume and price indicators to track, use fundamentals and logic to judge the sustainability of trends, and use continuous trial and error and stop. Profit and stop loss system for risk management.
Let’s take a look at what the real main rising wave looks like.
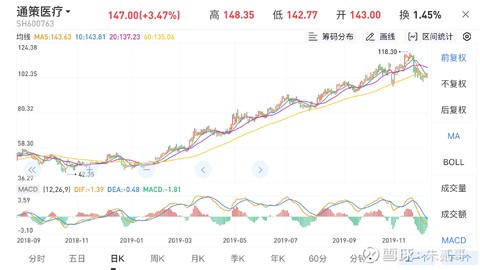
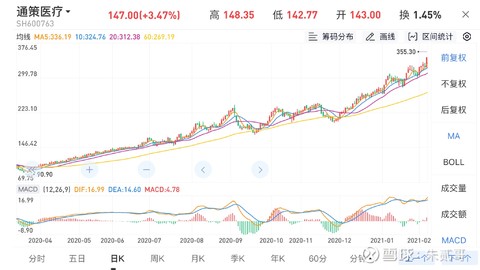
If you study the main Shenglang, the most classic graph is Tongce Medical. During the same period, many stocks in the medical industry such as Aier Eye, OPCOM, etc. have similar trends. This is the standard industry opportunity sector market.
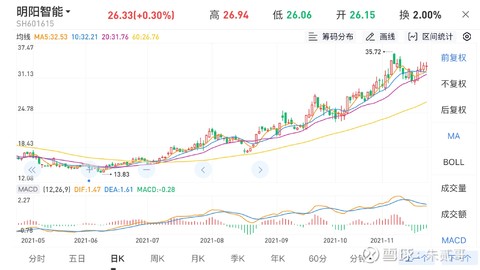
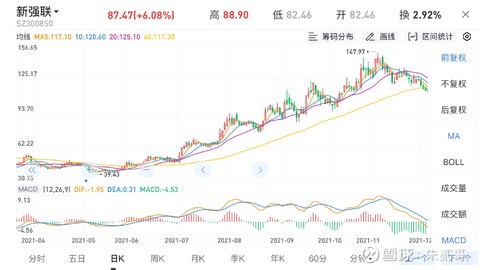
The picture above shows Mingyang Intelligence and Xinqianglian of wind power. In the same sector, there are also Daikin Heavy Industries, energy-saving wind power, etc., and their trends are basically the same. The really strong main rising wave rarely breaks the 20-day line or the 60-day line, and it can double or triple in half a year to a year.
I won’t list more stock charts here. If you are interested, you can figure it out for yourself. Liquor, chips, photovoltaics, new energy vehicles, the Internet, innovative drugs, CXO, etc. The daily charts of their leading companies should be studied carefully. Research. After you have studied enough main uptrend trends, you will be surprised to find that even the daily charts of different companies in different industries are so similar.
Did someone say it’s useful to look at the ones that have been gone? Of course it is useful, because the nature of investment remains unchanged, and the performance of stock price movements is very similar graphically. The graphics of stocks that can get out of the main uptrend in the future are similar to those in the past. Don’t criticize too much, and don’t blame blind empiricism, the truth is, the nature of investing is forever as old and unchanging as the hills.
Although I am bearish on the ChiNext and Track stocks for a short time, I feel that there is a high probability of a pullback, but I never deny that lithium ore and photovoltaics have stepped out of the trend, and they are likely to be in the starting stage of the main rise. How long will it be sustainable.
In the previous article, I wrote about the small technology of filtering shocks and callbacks in the main rising wave and only eating the big Yangxian, and gave you a successful case of China Communications Construction. Let’s talk about the failure here, Ganfeng Lithium Industry.
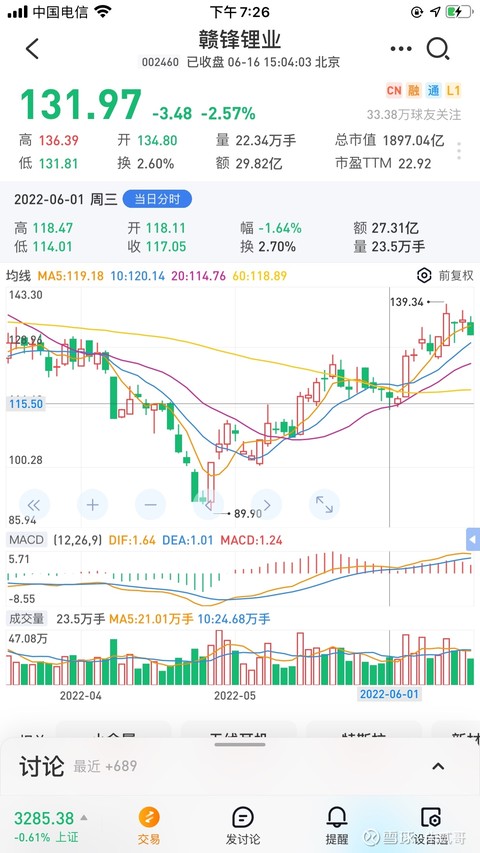
Looking at the picture above, on the day when No. 6.1 fell sharply, I took more than 10,000 shares at a low price. The entry point was good enough. It successfully filtered out the shock and correction of the previous seven or eight days. Unfortunately, it came out when it shook again the next day. , At that time, it seemed that Goldman Sachs in the United States or which investment bank was bearish on mining management, tricked me into getting out of the car. It rose more than 9% the day after it came out. Although I missed the big meat, it also proved that this method is possible for me.
I will continue to use this strategy of filtering out callback shocks and looking for a big Yang line in the main rising waves. Coal, petroleum, lithium, ore, photovoltaic, oil transportation and other sectors may have low-suction intervention to eat the big Yangxian at the right time.
There are 22 discussions on this topic in Snowball, click to view.
Snowball is an investor’s social network, and smart investors are here.
Click to download Snowball mobile client http://xueqiu.com/xz ]]>
This article is reproduced from: http://xueqiu.com/2299425930/222854750
This site is for inclusion only, and the copyright belongs to the original author.