From the perspective of economic structure, the industry is divided into upstream, middle and downstream industries. The downstream directly faces consumers, and the demand is the most stable; the downstream demand is transmitted upward, and the more links are more likely to be distorted, the more upstream, the industry demand fluctuates and cycles Sex will be stronger.
The consumer industry is subdivided into mandatory consumption and optional consumption; some subdivided consumer industries also have strong cyclical characteristics.
Different segmented consumer industries, investment value and investment methods should be different.
Let’s take a closer look at all consumer indices now.
The consumer industry can generally be equated with downstream industries, including food and beverage, household appliances, animal husbandry, media games, automobiles and other sub-sectors.
Such industries (themes) face consumers directly, with relatively stable industry demand and better long-term returns.
1. Required (main) consumption index
CSI Consumer Staples Index (000932) selects all major consumer listed companies from the CSI 800 Index constituent stocks as constituent stocks.
The index adjusts the constituent stocks every six months, and the maximum weight of individual stocks is capped at 10%. The base point is 1,000 points based on December 31, 2004.
In April 2022, there are 53 CSI major consumer index sample stocks, and the average total market value of individual stocks is 120.5 billion yuan, slightly smaller than the CSI 300.
The Shanghai Major Consumer Industry Index (000036) selects 30 major consumer listed companies with high market capitalization and good liquidity from the Shanghai securities market as constituent stocks.
The index adjusts the constituent stocks every six months. The maximum weight of individual stocks is capped at 15%. The base point is 1000 points on December 31, 2003.
In April 2022, the average total market value of the constituent stocks of the Shanghai Composite Index was 132.8 billion yuan, which is basically the same as that of the CSI 300.
The CSI Consumer Staples Dividend Index (H30094) selects the 30 listed companies with the highest dividend yields as constituent stocks from the CSI Consumer Staples Index constituent stocks.
The index adjusts the constituent stocks every six months, and the maximum weight of individual stocks is capped at 15%. The base point is 1000 points based on December 30, 2005.
In April 2022, the average total market value of the sample stocks of the CSI Major Consumer Dividend Index was 48.4 billion yuan, and the average market value was roughly the same as the ChiNext 50.
On April 29, 2022, the industry composition of the above-mentioned consumption indices is as follows:
CSI major consumption index: liquor 43.67%, aquaculture 15.70%, beverage dairy 10.86%, seasoning and fermented products 8.88%, non-liquor 4.38%, feed 3.88%, food processing 3.64%, snack food 2.12%, agricultural product processing 1.91%, Plantation 1.78%, cosmetics 1.63%, animal health 0.80%, personal care products 0.41% and chemicals 0.31%.
SSE Major Consumer Industry Index: Liquor 43.54%, Seasoning and Fermented Products 19.55%, Beverage Dairy 18.06%, Non-Liquor 7.08%, Cosmetics 3.67%, Snack Food 2.87%, Food Processing 1.76%, Planting 1.16%, Animal Health 1.04%, Agricultural products processing 0.87% and chemicals 0.40%.
CSI Major Consumption Dividend Index: Breeding Industry 17.17%, Snack Food 14.16%, Liquor 13.04%, Beverage Dairy 11.08%, Seasoning and Fermented Products 10.76%, Feed 9.01%, Food Processing 8.12%, Chemical Products 6.28%, Planting Industry 6.19% , animal health 2.31% and non-liquor 1.89%.
The industry composition of the CSI Consumer Dividend Index is more balanced and dispersed, unlike the first two indices that are highly dependent on liquor.
From April 30, 2012 to April 29, 2022 (bear market), the cumulative return of the CSI Consumer Staples Index was 239.93%, and the annualized rate of return was 13.01%; the accumulated return of the Shanghai Stock Exchange Major Consumer Industry Index was 251.58%, with an annualized return of 251.58%. The rate is 13.40%; much higher than the CSI 300 annualized rate of return of 4.34% over the same period.
During the 10-year period from February 11, 2011 to February 10, 2021 (the high point of the stage), the cumulative return of the CSI major consumer index was 371.14%, and the annualized rate of return was 16.77%; the accumulated return of the Shanghai major consumer industry index was 374.80%, The annualized rate of return is 16.86%; much higher than the 6.46% annualized rate of return of the CSI 300 over the same period.
From July 2, 2013 (the date of establishment of CSI Consumer Dividend) to April 29, 2022 (bear market), the cumulative return of the CSI Consumer Staples Dividend Index was 411.77%, and the annualized rate of return was 22.64%; the CSI Consumer Staples Index during the same period The cumulative return is 306.85%.
From July 2, 2013 to January 4, 2022 (the high point of the stage), the cumulative return of the CSI Consumer Staples Dividend Index was 524.33%, and the annualized rate of return was 25.73%; the cumulative return of the CSI Consumer Staples Index during the same period was 388.55%.
The CSI Consumer Staples Dividend Index returns are much higher than the CSI Consumer Staples Index.
On April 29, 2022, the CSI Consumer Staples (Price) Index closed at 21191.92, while the CSI Consumer Staples Total Income Index, which considers dividends, was 26294.03. The cumulative return of the Total Income Index since its establishment was 24.08 higher than the price index. %.
On April 29, 2022, the SSE major consumer industry (price) index closed at 15068.47, while the SSE major consumer industry total income index considering the dividend factor was 18478.48. The cumulative income of the total income index since its establishment was 22.63 higher than the price index. %.
On April 29, 2022, the CSI Consumer Staples Dividend (Price) Index closed at 42098.20, while the CSI Consumer Staples Dividend Total Income Index, which takes into account the dividend factor, was 56312.15. The accumulated income of the Total Income Index since its establishment is higher than the price index. out 33.76%.
Major consumption is the industry-themed index with the best return of A-shares in the past ten years, and because of this, the valuation of major consumption is high.
On April 29, 2022, the CSI major consumer index PE (TTM) was 47 times, which was in the 50-75% valuation percentile range in the past ten years; the Shanghai major consumer industry index PE (TTM) was 39.13 times, which was close to The ten-year valuation percentile is between 25-50%; the CSI major consumer dividend index PE (TTM) is 52.84, which is in the 50-75% valuation percentile range in the past ten years.
Although the demand for major consumption is stable, it may also face mean reversion at the same time, and investment in major consumption may have to lower the expected return.
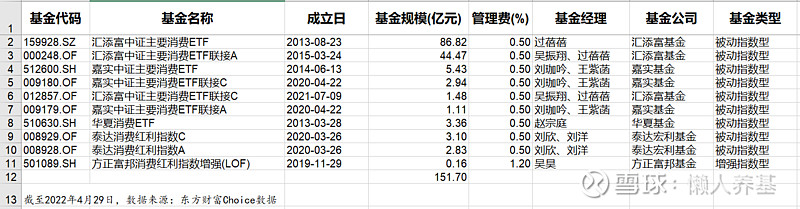
Details of on- and off-market index funds that track the CSI Consumer Staples Index, the SSE Consumer Staples Industry Index and the CSI Consumer Staples Dividend Index are detailed in the table below.
2. Comprehensive consumption index (including optional consumption)
The CSI Consumer Leaders Index (931068) selects 50 securities of listed companies with the largest scale and better management quality from the optional consumption and major consumption industries in the Shanghai and Shenzhen markets as index samples.
The index adjusts the constituent stocks every six months. The weight limit of individual stocks is 15%, and the weight limit of the top five constituent stocks is 60%. The average market value of the constituent stocks in April 2022 is 121.1 billion yuan.
In April 2022, among the constituent stocks of the CSI Consumer Leading Index, main consumption accounted for about 55%, and optional consumption accounted for about 45%.
The CSI Consumer 50 Index (931139) selects the securities of 50 leading listed companies with the largest scale and good management quality from the optional consumption of the Shanghai and Shenzhen markets and the major consumer industries except the passenger car and parts industry as the index sample .
The index adjusts the constituent stocks every six months. The weight limit of individual stocks is 15%, and the weight limit of the top five constituent stocks is 60%. The average market value of the constituent stocks in April 2022 is 128.6 billion yuan.
In April 2022, among the constituent stocks of the CSI Consumer 50 Index, main consumption accounted for about 63%, and optional consumption accounted for about 37%.
The SSE Consumer 80 Index (000069) selects 80 securities of listed companies in the major consumer, discretionary consumer and medical and health industries with the largest scale and better liquidity in the Shanghai Stock Exchange as the index sample.
The index adjusts the constituent stocks every six months, and the weight limit of individual stocks is 10%. The average market value of the constituent stocks in April 2022 is 91.6 billion yuan.
In April 2022, among the constituent stocks of the SSE Consumer 80 Index, main consumption accounts for about 40%, optional consumption accounts for about 28%, and medical and health care accounts for about 32%.
The CSI Shanghai-Hong Kong-Shenzhen Leading Consumer Index (931663) selects 50 leading companies in the consumer sector with large market capitalization, high market share and good operating conditions from securities listed in the Shanghai, Hong Kong and Shenzhen markets as index samples.
The index adjusts the constituent stocks every six months, and the upper limit of the weight of individual stocks is 10%. The average market value of the constituent stocks in April 2022 is 175.4 billion yuan.
In April 2022, among the constituent stocks of the CSI Shanghai-Hong Kong-Shenzhen Leading Consumer Index, main consumption accounted for about 51%, optional consumption accounted for about 42%, and information technology accounted for about 7%.
The CSI Southbound Connect Consumer Theme Index (931454) selects 50 consumer-related securities with relatively good liquidity and large market value from the scope of Southbound Connect securities as index samples.
The index adjusts the constituent stocks every six months, the weight of individual stocks is capped at 15%, and the average total market value of the constituent stocks is 171.6 billion yuan.
During the 10-year period from April 30, 2012 to April 29, 2022 (bear market), the cumulative return of the Shanghai Consumer 80 Index was 140.35%, and the annualized rate of return was 9.18%, much higher than the CSI 300 annualized rate of return of 4.34 in the same period. %, but far lower than the 13.01% of the main consumption of the CSI in the same period ; in the 10 years from February 11, 2011 to February 10, 2021 (the high point of the stage), the cumulative return of the Shanghai Stock Exchange 80 Index was 210.60%, and the annualized rate of return was 210.60%. It is 12.00%, much higher than the CSI 300 annualized rate of return of 6.46% in the same period, and much lower than the 16.77% of CSI’s main consumption.
It can be seen that the return of discretionary consumption in the past decade is much lower than that of main consumption.
The rest of the composite consumption indices have not been established for a long time, and there is no detailed data for the past ten years. However, it is certain that the past returns of the composite consumption indices are not as high as those of major consumption.
Excluding the impact of valuation factors, optional consumption is greatly affected by the economic cycle, and the demand for optional consumption in the economic boom cycle is strong. When the economy is depressed, the demand for optional consumption is sluggish. It is understandable that the long-term return of the optional consumption industry is not as good as that of main consumption. of.
On April 29, 2022, the industry composition of each index is as follows (the top ten secondary industries).
CSI Consumer Leading Index: Liquor 30.85%, white goods 11.29%, other 9.66%, beverage and dairy 9.32%, aquaculture 6.75%, auto parts 6.34%, seasoning and fermented products 5.44%, advertising and marketing 2.56%, hotel catering 1.78% And household goods 1.53%.
CSI Consumer 50 Index: Liquor 36.08%, White Goods 20.30%, Beverage Dairy 8.18%, Others 7.95%, Seasoning and Fermented Products 5.98%, Aquaculture 5.83%, Food Processing 3.10%, Household Products 2.18%, Feed 2.09% and Clothing Home textiles 1.60%.
SSE Consumer 80 Index: Liquor 20.59%, Medical Services 11.27%, Others 10.00%, Chemical Pharmaceuticals 8.79%, Beverage Dairy 8.31%, Seasoning and Fermented Products 6.01%, Auto Parts 5.92%, Traditional Chinese Medicine 5.14%, Passenger Cars 4.73% and White goods 3.49%.
CSI Shanghai-Hong Kong-Shenzhen Leading Consumer Index: Others 43.99%, Liquor 24.78%, White Goods 9.60%, Beverage Dairy 5.22%, Aquaculture 4.03%, Seasoning and Fermented Products 3.56%, Feed 2.15%, Food Processing 1.82%, Consumer Electronics 1.25 % and household goods 0.83%%.
CSI Hong Kong Stock Connect Consumer Thematic Index (Hang Seng Level 2): Software Services 35%, Food and Beverage 16%, Textiles and Apparel 11%, Home Appliances and Supplies 11%, Automobiles 9% and Others 18%.
Let’s take a look at the valuation data for these composite consumer indices.
On April 22, 2022, the CSI Consumer Leading Index PE (TTM) was 27.58, at about 50% of the valuation percentile in the past ten years; the CSI Consumer 50 Index PE (TTM) was 26.73, at 25 in the past ten years. -50% valuation percentile range; SSE Consumer 80 Index PE (TTM) was 31.87, in the 25-50% valuation percentile range in the past ten years.
After all, there is a considerable proportion of major consumption, and the valuation level of these comprehensive consumption indices is still not low.
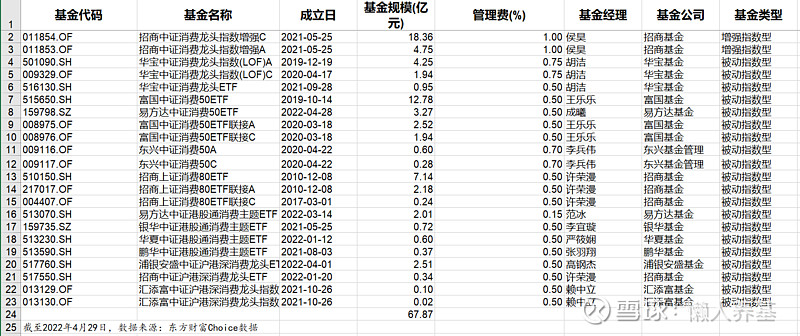
Details of the funds that track these composite consumer indices are detailed in the table below.
3. Subdivision Consumer Industry Theme Index
1) Food and Beverage Index
The CSI Food and Beverage Index (930653) selects the securities of 100 listed companies in the wine, beverage and food industries with high market capitalization and good liquidity as samples.
The index adjusts the constituent stocks every six months, and the upper limit of the weight of individual stocks is 10%. In April 2022, the average market value of the constituent stocks is 61.2 billion yuan.
The CSI Food and Beverage Industry Theme Index (000815) selects the securities of 50 listed companies in the food and beverage industry segment with the highest market value and good liquidity as a sample.
The index adjusts the constituent stocks every six months, and the upper limit of the weight of individual stocks is 15%. In April 2022, the average market value of the constituent stocks is 108.8 billion yuan.
During the 10-year period from April 30, 2012 to April 29, 2022 (bear market), the cumulative return of the CSI subdivided food and beverage industry theme index was 255.21%, and the annualized rate of return was 13.52%, slightly higher than the CSI major consumer index of 13.01%.
Because the CSI Food and Beverage Index has not been established for a long time, there is no complete data for the past ten years, but it is speculated from the constituent companies that the return level of the CSI Food and Beverage Industry Thematic Index and the CSI Major Consumer Index should be roughly the same.
Let’s take a look at the sector composition of the two indices (top 10 secondary sectors) as of April 29, 2022.
CSI Food and Beverage Index: Liquor 54.08%, Beverage Dairy 13.42%, Seasoned Fermented Products 11.37%, Food Processing 7.28%, Non-Liquor 6.04%, Snack Food 4.08%, Agricultural Products Processing 2.30%, Chemical Products 1.17%, Chemical Pharmaceuticals 0.12% and other 0.09%.
The CSI subdivided food and beverage industry theme index: liquor 63.77%, beverage dairy 14.20%, seasoning and fermented products 12.10%, non-liquor 5.53%, food processing 1.98%, snack food 1.23%, chemical products 0.87% and agricultural products processing 0.32%.
On April 29, 2022, the CSI Food and Beverage Index PE (TTM) was 36.19, and the CSI Food and Beverage Industry Theme Index PE (TTM) was 35.26, both in the 25-50% valuation percentile range in the past decade. .
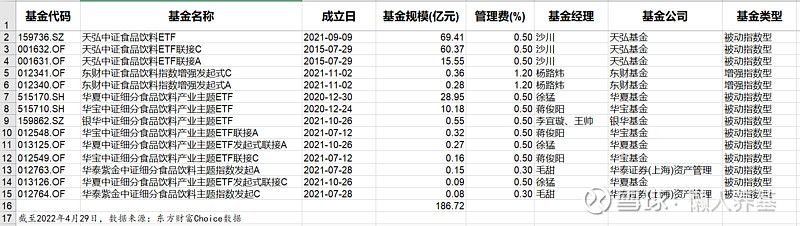
See the table below for a breakdown of on- and off-market funds that track the Food & Beverage Index.
2) Alcohol Index
CSI Liquor Index (399997) selects up to 50 securities from listed companies related to liquor business with high market capitalization and good liquidity from the Shanghai and Shenzhen markets as index samples.
In April 2022, the number of constituent stocks in the index was 17, with an average total market value of 246.4 billion yuan.
The maximum weight limit of individual stocks in the CSI Baijiu Index is 15%, and the constituent stocks are adjusted every six months.
CSI Liquor Index (399987) selects up to 50 securities from listed companies in the Shanghai and Shenzhen markets with high market capitalization and good liquidity in liquor, beer, wine brewing and other businesses as index samples.
In April 2022, the number of constituent stocks of the index was 31, with an average total market value of 142.8 billion yuan.
The maximum weight limit of individual stocks in the CSI Wine Index is 15%, and the weight limit of the top five constituent stocks is 60%. The sample stocks are adjusted every six months.
During the 10-year period from April 30, 2012 to April 29, 2022 (bear market), the cumulative return of the CSI Baijiu Index was 294.45%, and the annualized rate of return was 14.71%, which was higher than the 13.01% of the CSI Consumer Staples Index; in 2011 During the 10-year period from February 11 to February 10, 2021 (the high point of the stage), the cumulative return of the CSI Baijiu Index was 613.85%, and the annualized rate of return was 21.72%, which was significantly higher than the 16.77% of the CSI Major Consumer Index.
From July 2, 2013 (the date of establishment of the CSI Consumer Dividend) to April 29, 2022 (bear market), the cumulative return of the CSI Liquor Index was 584.68%, much higher than the 411.77% cumulative return of the CSI Major Consumer Dividend Index over the same period; From July 2, 2013 to January 4, 2022 (the high point of the stage), the cumulative return of the CSI Liquor Index was 630.68%, which was also much higher than the 524.33% cumulative return of the CSI Major Consumer Dividend Index over the same period.
Since the establishment of the main wine index is not long enough, there is no complete data for the last ten years, but the overall return of other wines other than baijiu is definitely not as good as that of baijiu, so the return of the wine index should also be slightly lower than that of the baijiu index.
The industry composition of the CSI Liquor Index is as follows: liquor 86.29%, non-baijiu 13.18% and professional chain 0.54%.
On April 29, 2022, the CSI Liquor Index PE (TTM) was 36.34, which was in the 25-50% valuation percentile range in the past ten years; the CSI Liquor Index PE (TTM) was 36.53, which was nearly 8 percent since the index was established. Annual 25-50% valuation percentile range.
The ultra-high rate of return shown by the liquor index at the peak of the bull market has attracted many investors to rush in to take over the offer, making the China Merchants CSI Liquor Index (LOF) A and C share a record size of nearly 100 billion yuan; the fund 2021 The annual report shows that as of the end of 2021, the number of fund holders has reached 10.32 million, and the Baijiu Fund is dubbed the “National Fund”.
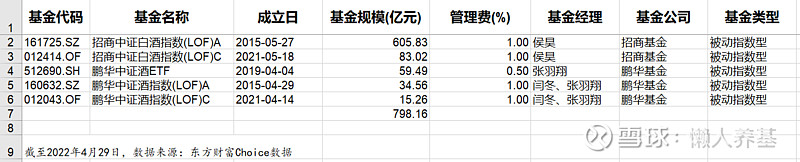
See the table below for the details of the on- and off-market funds that track the CSI Liquor Index and the Sprinkle Index.
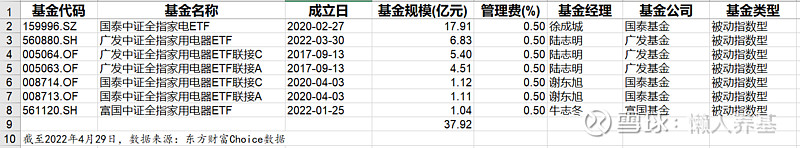
3) Household Appliances Index
The CSI All-Index Household Appliances Index (930697) is a selection of 50 sample stocks with large market capitalization and good liquidity from the three-tier CSI household appliance industry.
In April 2022, the average total market value of the index constituent stocks is 26.5 billion yuan, and the maximum weight of individual stocks is 15%, and the sample stocks are adjusted every six months.
The CSI All-Index Home Appliances Index was released on July 7, 2015, with a base date of December 31, 2004 and a base point of 1,000.
As of April 29, 2022 (in a typical bear market), the cumulative return of the index based on the base day and base point backtest is 791.68%, and the annualized return on the 17.33-year backtest is 13.74%.
Since the index was established on July 7, 2015, to April 29, 2022 (bear market), the cumulative return was 25.58%, and the annualized rate of return was 3.87%; to February 10, 2021 (stage high), the cumulative return was 91.86%, and the annualized rate of return was 91.86%. The converted yield is 13.92%.
On April 29, 2022, the industry (top ten) composition of CSI household appliances was as follows: white goods 50.10%, home appliance parts 12.00%, small household appliances 11.49%, black household appliances 6.22%, kitchen and bathroom appliances 6.12%, others 4.50%, lighting equipment 2.49%, household goods 2.39%, other power equipment 1.41% and batteries 1.14%.
On the same day, the CSI All-Index Home Appliances Index PE (TTM) was 16.33, below the 25% valuation percentile since its establishment (nearly 7 years).
See the table below for details of on- and off-market funds that track the CSI All-Index Home Appliances Index.
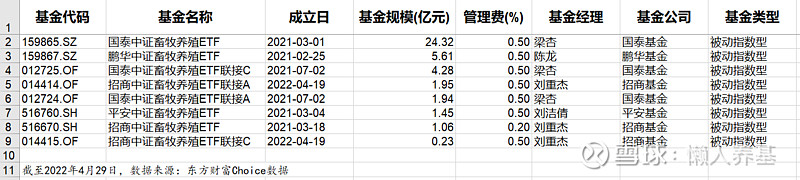
4) Animal husbandry index
The CSI Animal Husbandry Index (930707) selects up to 50 stocks of listed companies with the highest market value and good liquidity in livestock and poultry feed, livestock and poultry drugs, and livestock and poultry breeding securities from Shanghai and Shenzhen securities as samples.
In April 2022, the number of constituent stocks of the index is 35, with an average total market value of 24.4 billion yuan.
The upper limit of the weight of individual stocks in the CSI Animal Husbandry Index is 10%, and the constituent stocks are adjusted every six months.
The CSI Animal Husbandry Index was released on July 13, 2015, the base date is December 31, 2011, and the base point is 1000 points.
By April 29, 2022 (in a typical bear market), the cumulative return of the index based on the base day and base point backtest is 169.83%, and the annualized return on the backtest is 10.43%, which seems to be not bad.
However, in my country’s animal husbandry industry, pig breeding accounts for nearly half of the weight, so the index will follow the market ups and downs, and more importantly, it will be affected by the pig cycle, which will fluctuate greatly.
Therefore, although the index is classified into the main consumption category, it actually has a unique cyclical attribute. Investing in the CSI Animal Husbandry Index is generally not suitable for valuation analysis, but requires an accurate grasp of the pig cycle. It is not easy for ordinary investors to invest profitably.
On the other hand, this cyclical attribute of ups and downs has become an adventurer’s paradise.
On April 29, 2022, the industry composition of the CSI Animal Husbandry Index was as follows: aquaculture 58.65%, feed 27.83%, animal health 10.18%, agrochemicals 1.28%, chemicals 1.20% and others 0.86%.
Details of the on- and off-site funds that track the CSI Animal Husbandry Index are shown in the table below.
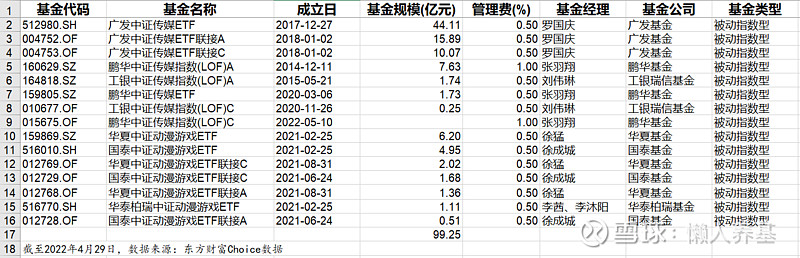
5) Media and animation index
CSI Media Index (399971): Select the top 50 securities of listed companies in market capitalization from industries such as marketing and advertising, culture and entertainment, and digital media as index samples, and the weight of a single sample does not exceed 10%, and the total weight of the top five samples no more than 40%. In April 2022, the average total market value of the sample stocks was 15.2 billion yuan.
CSI Animation Game Index (930901): Select the securities of listed companies in the entertainment industry of animation, comics, games and other related subdivisions as the index sample, and the upper limit of the weight of a single sample is 15%. In April 2022, the number of sample stocks is 30, and the average total market value is 9.9 billion yuan, which is roughly equivalent to the average market value of CSI 1000 of 9.7 billion yuan, typical of small-cap stocks.
As of May 27, 2022 (a typical bear market), the annualized returns of the CSI Media Index and the CSI Animation Game Index in the past three years were -8.79% and -10.86%, respectively, and the annualized returns in the past five years were -12.53. % and -18.06%, which are almost the worst sub-industry theme indexes in the past three to five years.
As of April 29, 2022, the industry composition of the two indices (Shenwan Level 2) is as follows.
CSI Media Index: 37.59% for games, 21.43% for advertising and marketing, 12.17% for film and television theaters, 11.01% for digital media, 10.89% for TV broadcasting, 6.26% for publishing and 0.66% for Internet e-commerce.
CSI Animation Game Index: 90.03% for games, 4.54% for movie theaters, 2.77% for software development, 1.89% for special equipment and 0.77% for personal care products.
On the same day, the PE (TTM) of the CSI Media Index and the CSI Animation Game Index were 21.74 and 30.78, respectively, both below the 25% valuation percentile since their listing (about 5-8 years).
See the table below for a breakdown of the index funds that track them.
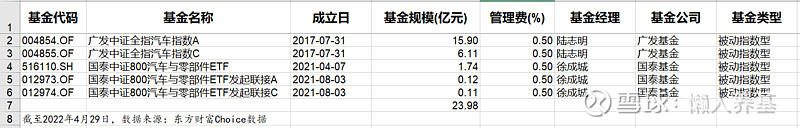
6) CSI Auto Index (931008): Select securities of listed companies in the industry corresponding to the theme of automobiles from the CSI Auto Index as index samples, and make a single sample weight no more than 15%. In April 2022, the number of sample stocks was 27, with an average total market value of 43.6 billion yuan.
CSI 800 Auto and Parts Index (H30015): Select securities of listed companies from the CSI 800 Index in industries corresponding to the theme of automobiles and their parts as index samples, with a single sample weight of no more than 15%. In April 2022, the number of sample stocks was 27, with an average total market value of 54.4 billion yuan.
As of May 27, 2022 (a typical bear market), the CSI Auto Index and CSI 800 Auto & Parts Index had annualized returns of 22.08% and 21.78% in the past three years, respectively, and the CSI 800 Auto & Parts Index The annualized rate of return in the past five years is 6.16%.
As of April 29, 2022, the industry composition of the two indices (Shenwan Level 2) is as follows.
CSI Auto Index: 76.78% for passenger cars, 11.00% for auto services, 8.66% for motorcycles and others, 1.76% for motors, 0.70% for comprehensive, 0.57% for railways and highways, and 0.54% for medical business.
CSI 800 Auto & Parts Index: 53.46% for passenger cars, 33.32% for auto parts, 8.50% for commercial vehicles, 1.84% for special equipment, 1.63% for automotive services and 1.25% for others.
On the same day, the PE (TTM) of the CSI All Index Auto Index and the CSI 800 Auto and Parts Index were 31.76 and 28.37, respectively, both in the 50-75% valuation percentile range since their listing (about 8-9 years).
See the table below for a breakdown of the index funds that track them.
4. Summary
1) In the past ten years, the CSI Liquor Index has had the highest return, followed by the food and beverage index with the largest weight of liquor. The main consumption including animal husbandry is lower than that of food and beverage, and the comprehensive consumption index including optional consumption is lower.
2) The return of the China Securities Consumer Staples Dividend Index since its establishment on July 2, 2013 is second only to the China Securities Liquor Index, and much higher than the China Securities Major Consumer Index. The weight of liquor in the CSI Major Consumption Dividend Index is only 13.04%, far lower than the 43.67% of the CSI Consumer Index. Therefore, the dividend strategy of the CSI Major Consumer Dividend Index has been very effective in the past, and it is a consumer index worthy of attention.
3) In the subdivision of consumption, the CSI Media Index and the CSI Animation Game Index are the most bearish consumer indices in the past three to five years. We will wait and see whether we can usher in mean regression in the future.
# Snowball Star Plan Public Offering Talent# $ China Merchants Liquor Index (F161725)$ $ Founder Fubon Consumer Bonus Index Enhancement (LOF) (F501089)$ $ TEDA Consumer Bonus Index A (F008928)$
@Today’s topic @snowball creator center @ETF star push officer @snowball fund
All the opinions and funds involved in this article do not constitute investment advice, but are only a true record of my own thinking and practice. I invest in the market based on this, at my own risk.
This article was first published by Lazy People , and the copyright belongs to the author. Reproduction without permission is strictly prohibited. Friends are welcome to forward the circle of friends.
[Lazy Man Support Fund Column] Review of Past Essences
[Lazy people support snowball column article directory]
“The Importance of Developing a Complete Investment Strategy”
“Why do I advocate “lazy people support foundation”? 》
“What should a fund manager do if they quit? 》
《2022, how will my fund be placed? 》
How can ordinary people achieve financial freedom through fund investment? 》
“The logic of my current investment in the China Internet Thematic Index Fund”
“A Simple and Easy Fund Buying Strategy”
How to choose when to invest in active funds? 》
” Fund in-depth backtesting: use data to tell you the ultimate correct way to buy funds to make money “
“Raising Funds to Lay Golden Eggs – The Investment Concept of “Lazy People’s Funding”
“My Active Fund Analysis Framework”
“Buy Index Funds or Active Funds? Deep insights after years of real money investment”
“Free fund fixed investment tutorial, one article is enough”
” Non-ferrous metal theme fund investment logic “
” Why not select funds based on performance theory? 》
” Merrill Lynch Clock, Economic Cycle and Fund Investment “
” Tips: Understanding the Currency Credit Cycle and the Allocation Logic of Equity and Debt Funds “
” Afraid of heights are miserable people! Do you still need a valuation? Let’s start with PE valuation ”
“Tips: Understanding Inflation and Deflation”
“Tips: Understanding the Ten-Year Treasury Bond Yield”
“2021, how to place my fund” (active fund part)
Originality is not easy, if you think it is useful to you, please like and watch it. Gifts of roses, hand left lingering fragrance.
This topic has 10 discussions in Snowball, click to view.
Snowball is an investor’s social network, and smart investors are here.
Click to download Snowball mobile client http://xueqiu.com/xz ]]>
This article is reproduced from: http://xueqiu.com/2356382715/222895062
This site is for inclusion only, and the copyright belongs to the original author.