As we all know, scientific Internet access, also known as tomato / magic / Wudang vertical cloud ladder, is an essential skill for contemporary youth. If you want to go online scientifically, you need two prerequisites:
- A server subscription address provided by a service provider is required
- Corresponding software needs to be installed
There are many service providers (airports), and the price, nodes, bandwidth and stability are all thrifty. My current main airport is
Bywave . Bywave is a high-end v2ray airport with all-intranet transfer lines. It not only has Alibaba Cloud/WTT/HKT and other lines, but also all-intranet transfer nodes and IPLC dedicated lines (intranet transfer lines and IPLC dedicated lines are extremely expensive, Therefore, the quality is excellent, the network is very smooth and stable, and it is not affected by the supply.) ByWave does not provide a lot of nodes like other airports, requiring frequent subscription updates and maintenance. Friends who are not registered can click
Sign up for the experience at this link .
There are also many options for proxy software. Leaving aside paid products, the most powerful free proxy software is Clash. Clash is a cross-platform, rule-based network proxy software that supports SS/V2ray/Trojan protocols. Beautiful interface and subscription support, especially for airports and paid services. There are also many GUI clients based on Clash, the more popular ones are Clash for Windows, Clash X, Clash X Pro and OpenClash used by OpenWrt, and the difference is not big.
There are also many variants of Clash core, such as Clash Premium, which is written by the same author as Clash, the difference is only that it is closed source and provides more advanced functions.
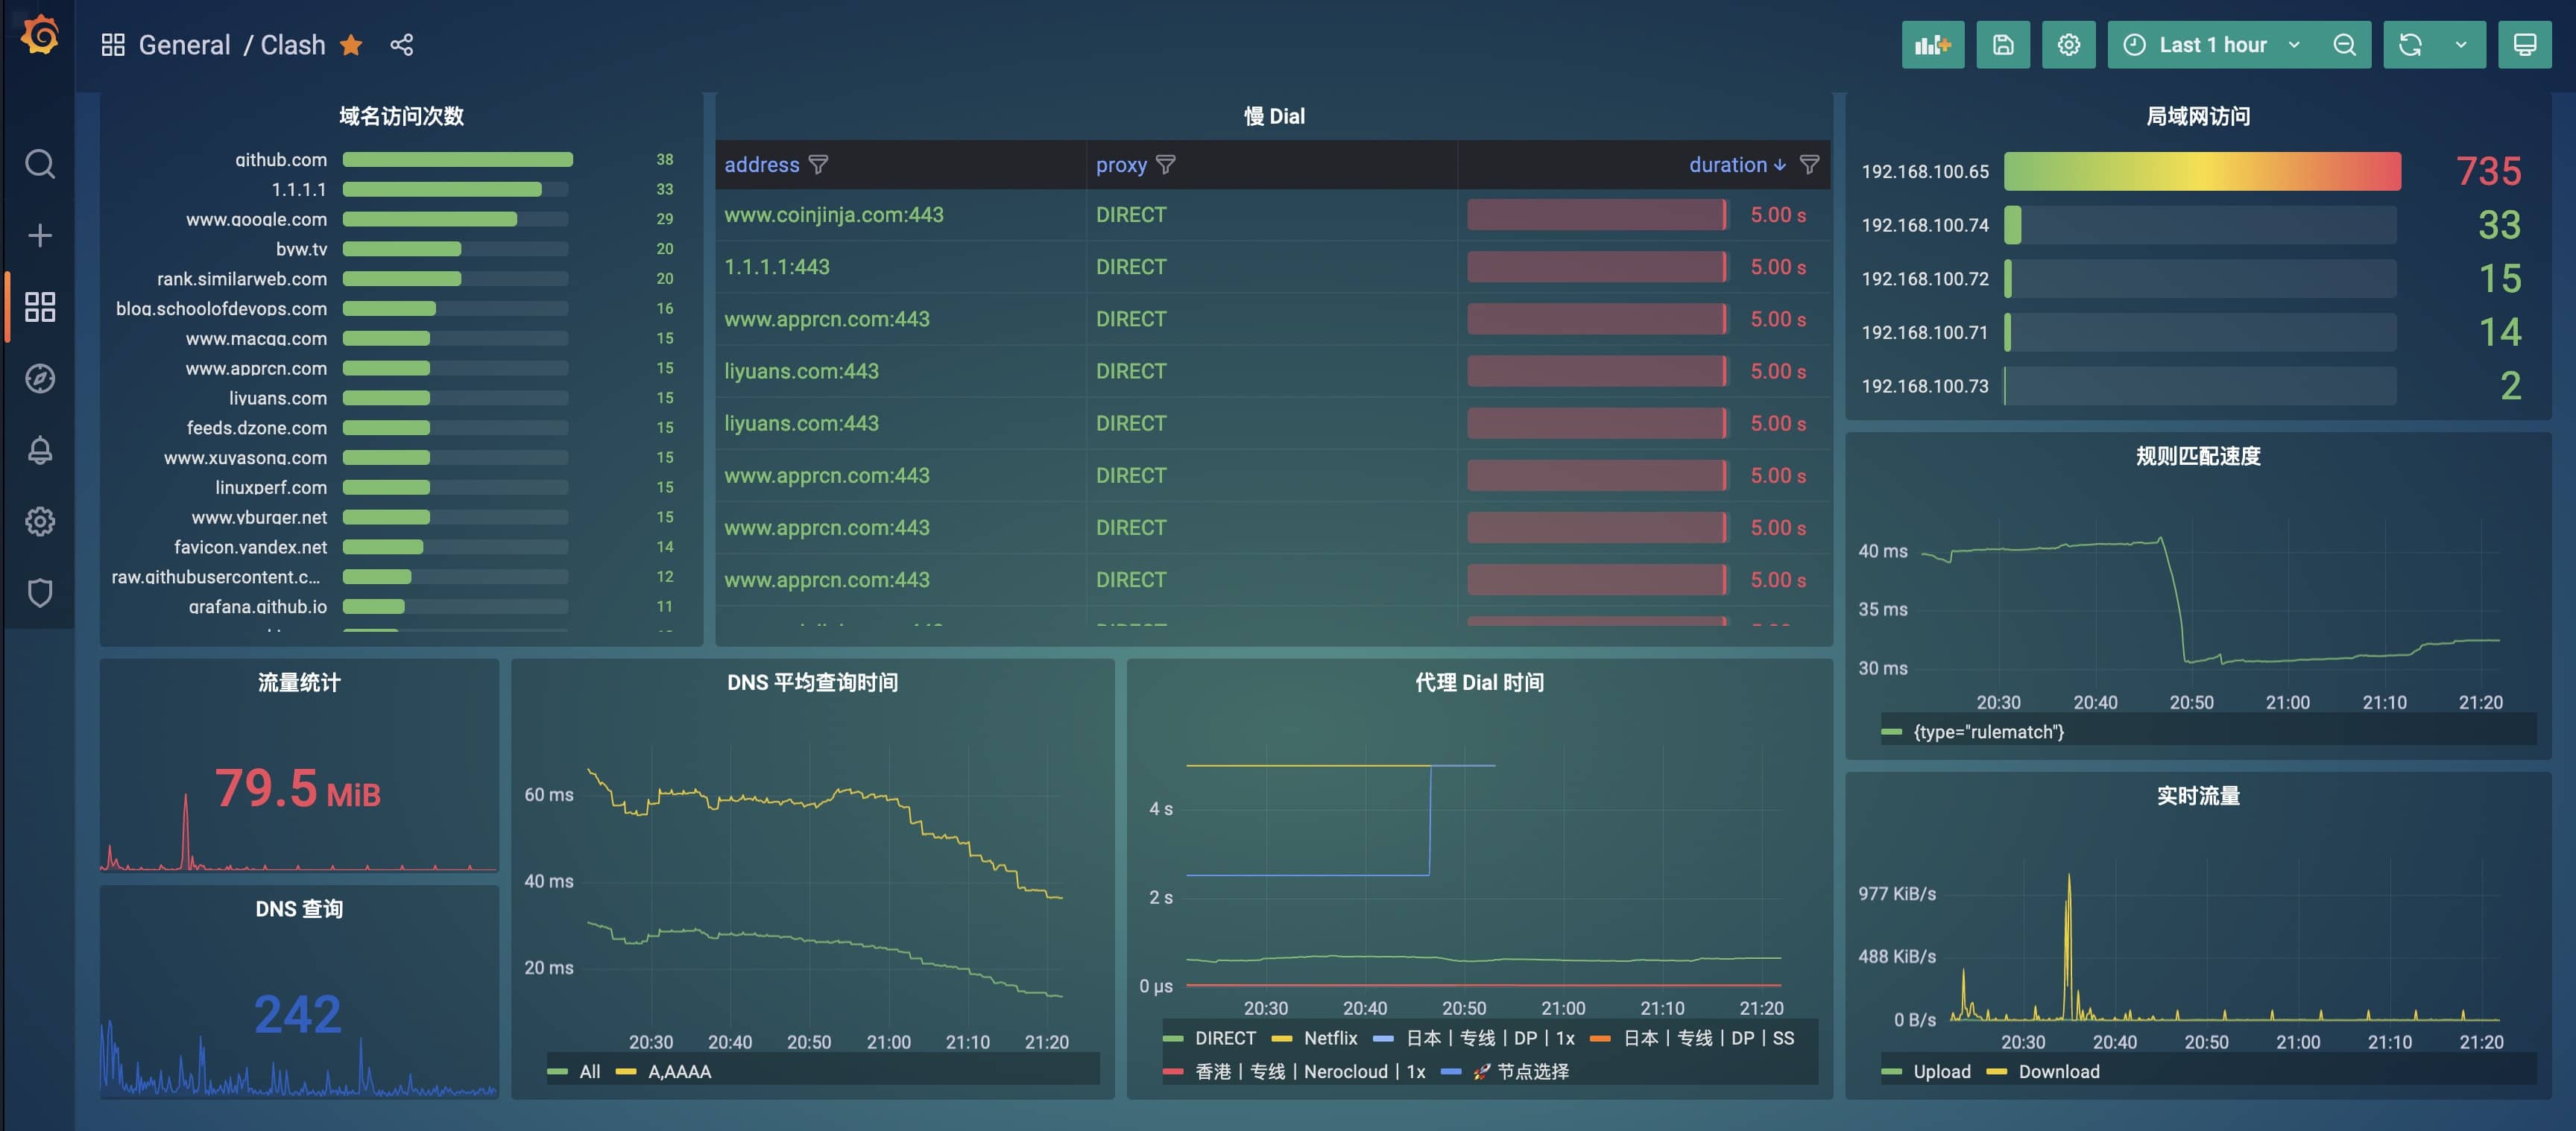
The Clash Premium kernel has a relatively new and still experimental function called Tracing, which can easily collect the traffic data passing through the Clash kernel. This article will introduce how to monitor the traffic of Clash Premium, and use Grafana’s visualization panel to display the monitoring data. First picture:
In order to facilitate monitoring, the developers of Clash created a new project called
clash-tracing , use Clash Premium’s Websocket Tracing API to collect data, then use Vector to convert it into logs, and push it to Loki, and finally use Grafana’s visual monitoring panel to display the data, which is very practical. Before monitoring, you first need to modify the configuration file of Clash Premium to enable the Tracing function:
profile : # open tracing exporter API tracing : true
If you are using OpenClash, then you need to add the above content directly at the top in [Configuration File Management] [You can modify the configuration file directly below: config.yaml, only supports settings that have not been taken over], and then restart OpenClash, that is Can.
The developer has provided docker-compose.yml , the container player can directly pull up all the services through one command of the compose file, and then there is no more, and the flowers are over!
Wait, don’t be in a hurry, what cloud native player doesn’t have a Kubernetes environment of his own? Can this monitoring service be quickly deployed to the Kubernetes environment?
In order to be able to deploy this monitoring service in K8s with one click, I
Fork the project , add GitHub Action to automatically build Docker images, and add Kubernetes orchestration files. The usage is very simple, just a few commands:
# 先克隆仓库$ git clone https://github.com/yangchuansheng/clash-tracing $ cd clash-tracing $ kubectl create ns monitoring # 修改deployment.yaml 中的环境变量,然后执行如下命令: $ kubectl apply -f deployment.yaml $ kubectl apply -f vector $ kubectl apply -f loki
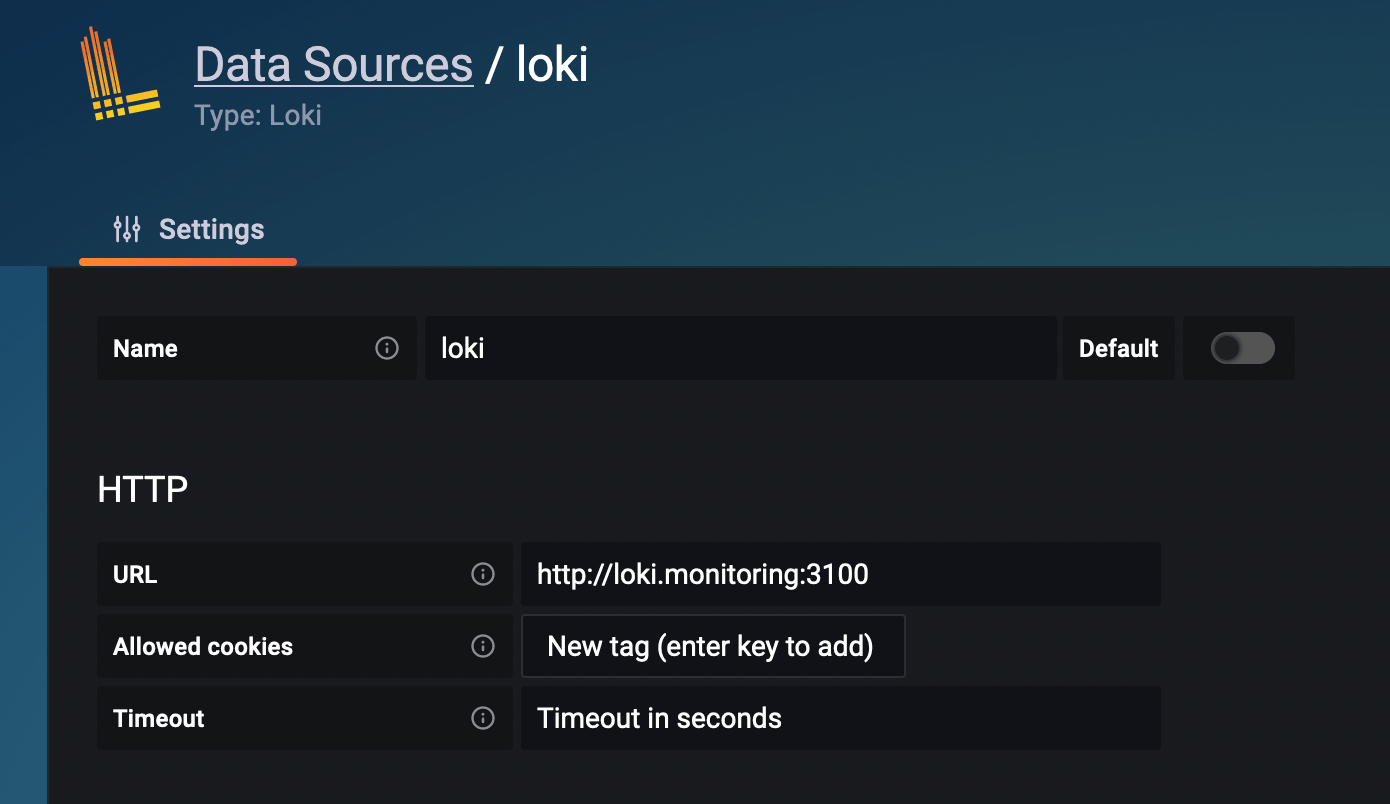
Then add the Loki data source in your Grafana visualization interface, the address of the data source is http://loki.monitoring:3100 , and the name is loki .
If you don’t have Grafana in your cluster, just deploy one yourself, and I won’t go into details in this article.
Next, execute the following command to change the data source in the JSON template of the monitoring panel to loki:
$ bash hack.sh
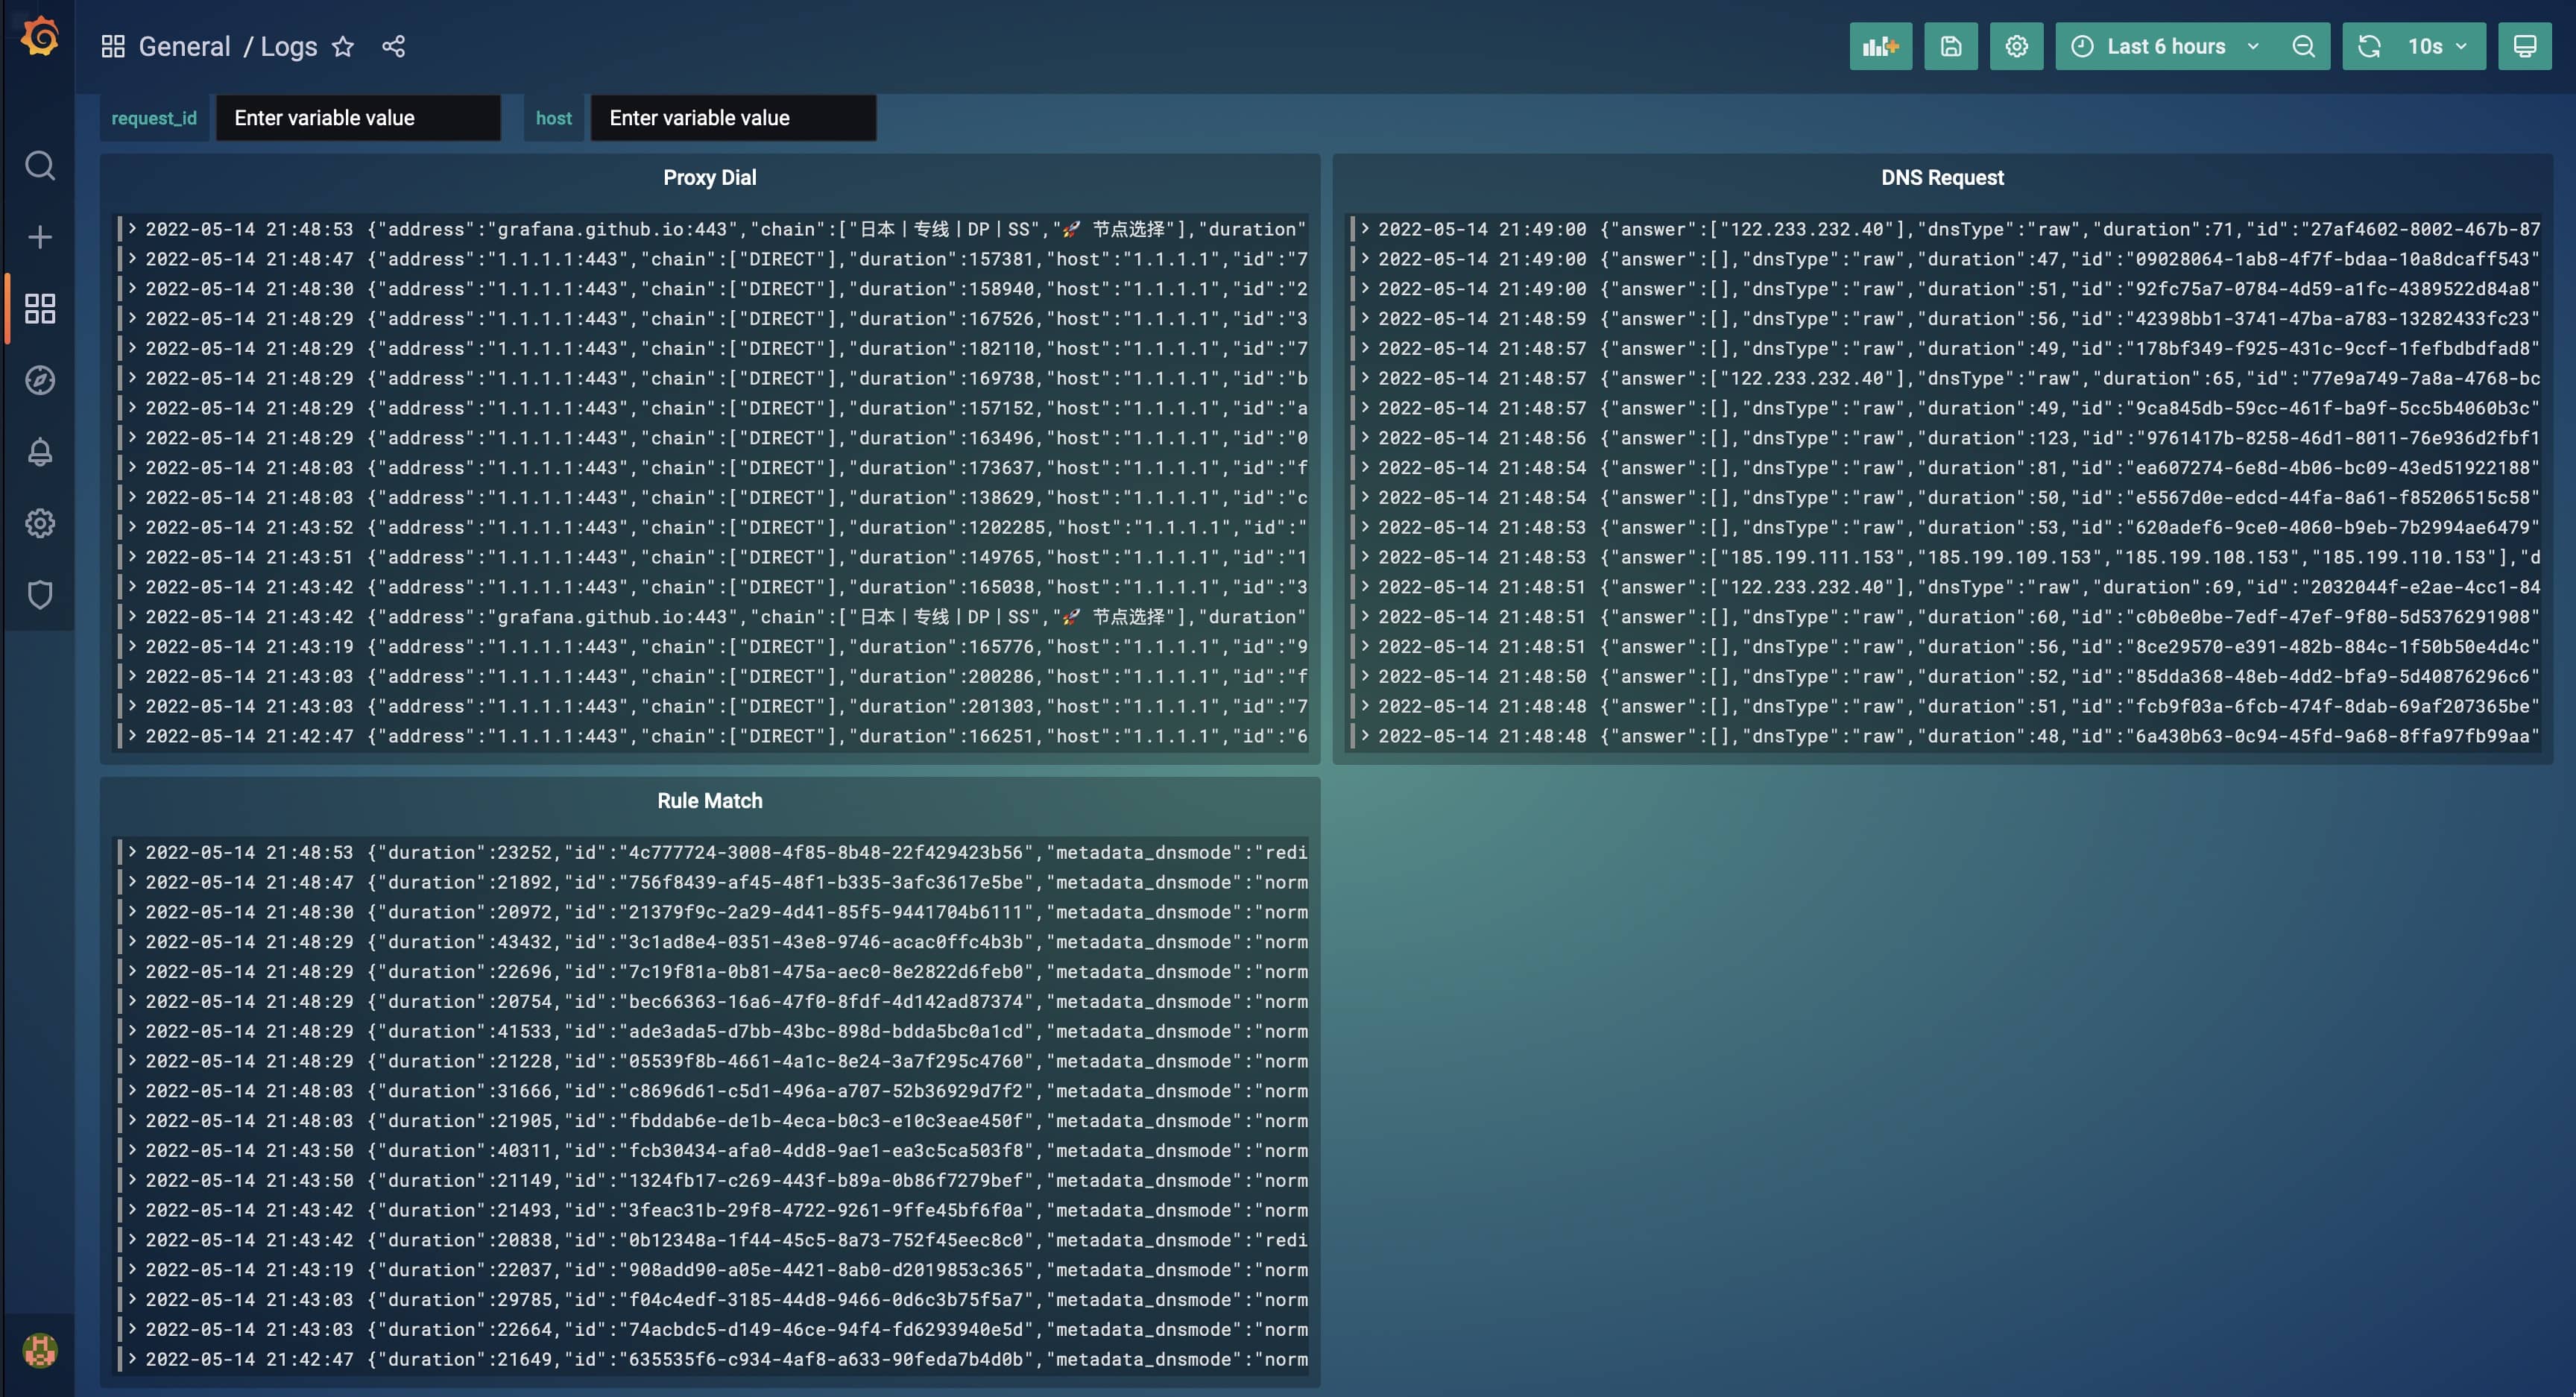
Finally, import panels/dashboard.json and panels/logs.json into Grafana.
final effect:
This article is reprinted from https://icloudnative.io/posts/monitoring-clash/
This site is for inclusion only, and the copyright belongs to the original author.