Original link: https://www.kawabangga.com/posts/4761
Prometheus is a relatively popular monitoring system now. Its working mode is the pull mode: the target to be monitored is responsible for exposing the metris data. The format is ordinary text format and the protocol is HTTP, just like opening an ordinary HTTP service. The same, then Prometheus periodically collects metrics from these HTTP interfaces and saves them.
So how do you tell Prometheus where to fetch these metrics?
You can directly write the target to be grabbed in the configuration file of Prometheus. But such frequently changing goals are not very friendly.
Prometheus itself supports many service discovery, such as consul_sd , configure a consul address, and Prometheus will discover the crawling target through Consul. There are other ways to support discovery on the cloud, such as ec2_sd of aws .
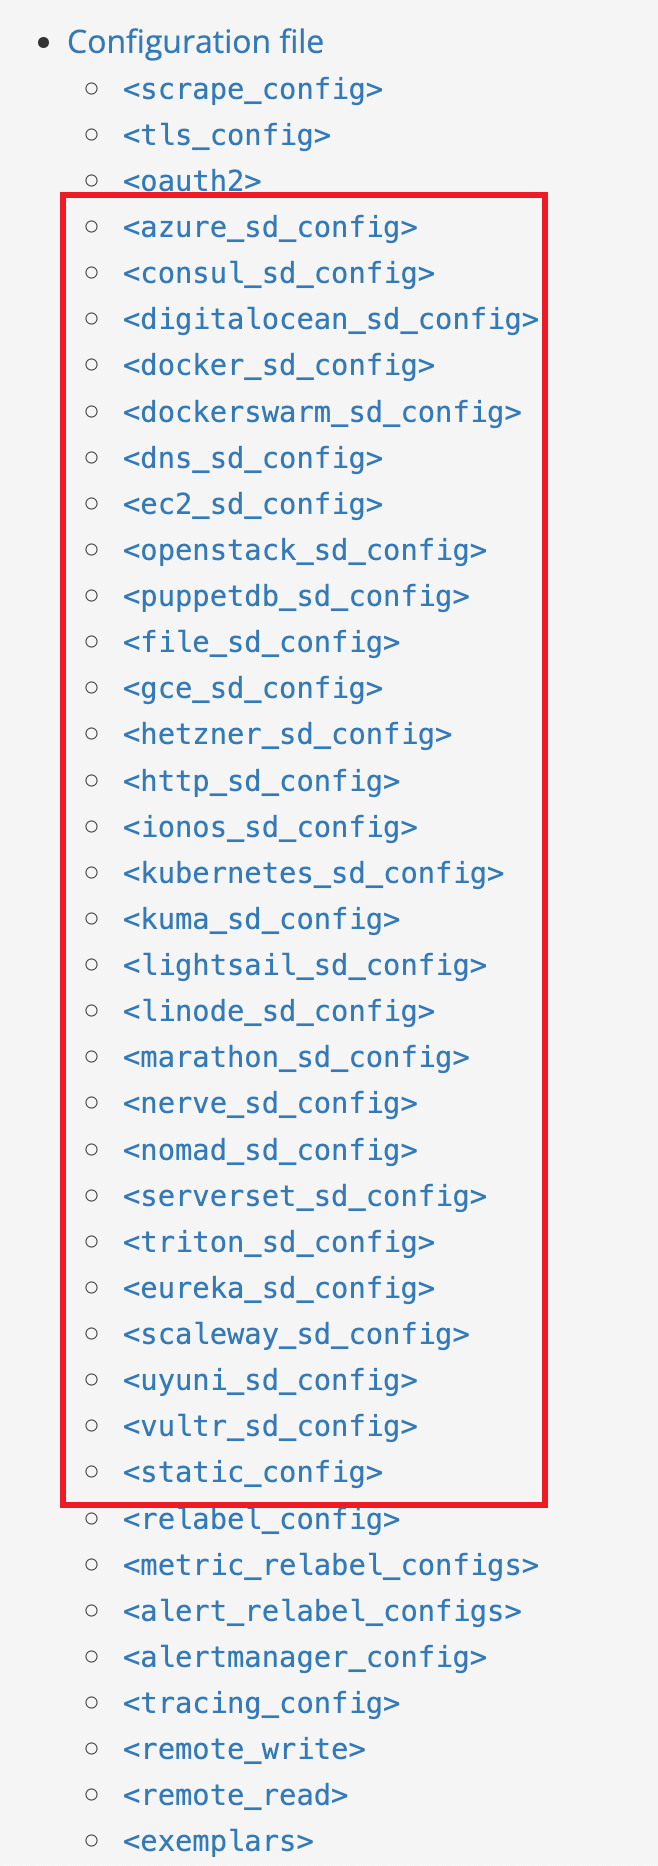
But there are also many that are not supported, such as Etcd, Redis, etc.
More importantly, many companies will have their own internal cmdb management systems, machine resource management systems, service governance, etc. If you want Prometheus to automatically capture metrics based on this information, one method is to regularly provide Prometheus support. sd to sync data. Another way is to use Prometheus’s file_sd or http_sd, which converts your own information into a format that Prometheus can use directly.
prometheus-http-sd is such a framework, which supports user-defined programming and returns the Prometheus targets format by implementing a generate_targets() function.
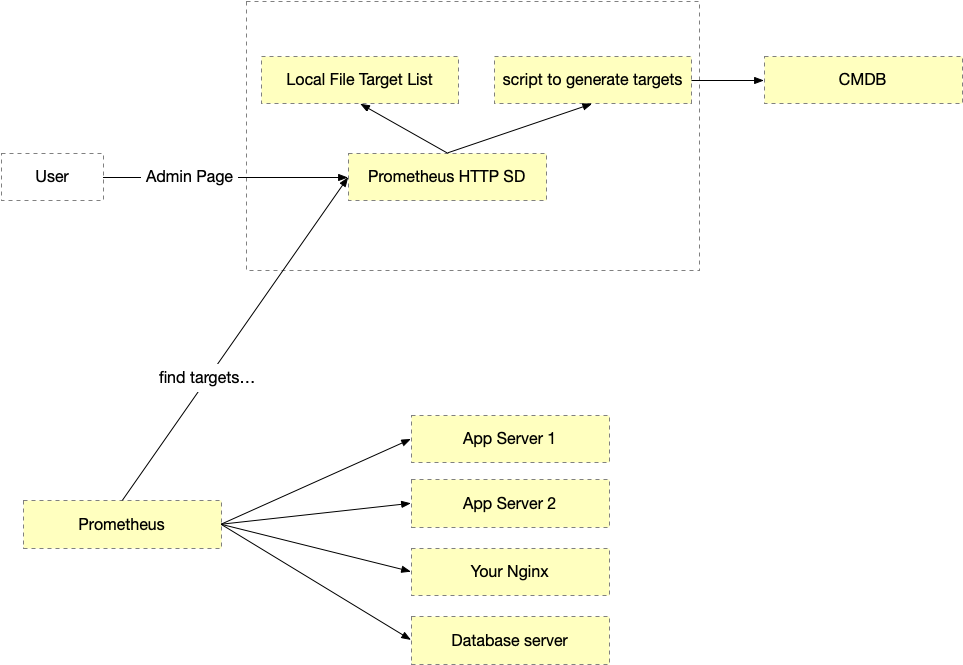
Then, start prometheus-http-sd, it will listen to a port, expose the crawling target through the HTTP service, and perform service discovery for Prometheus. Every time Prometheus sends an HTTP request, it will call the user-defined generate_targets() function to the backend, and then return the result of the function to Prometheus through HTTP Response.
https://github.com/laixintao/prometheus-http-sd
It organizes targets in a tree-like directory , that is, you can assign targets in different directories at the same level to different Prometheus instances to grab. In this way, it is also supported to use two jobs for the same set of targets to capture different metrics paths.
Support hot loading, if the target generator is modified, the application does not need to be restarted. It is recommended that users use git to maintain the target generator, and then just update this folder.
Supports Dry run mode, so that prometheus-http-sd can be integrated into CI, and every time the target generator is modified, it can automatically check whether the target generation conforms to the Prometheus specification and whether there is any problem with the Python code in CI.
In addition to supporting the definition of crawl targets with Python files, it also supports static file definition targets, json, and Yaml (Prometheus’ native file_sd does not support Yaml, I don’t know why).
In addition, prometheus-http-sd itself also supports exposing metrics, which can monitor itself, such as latency, the number of times the generator is called, the number of targets generated, and so on.
Support admin page, can be used to debug.
…
For other functions, you can directly see the project homepage of Github, and some newly added features will be written on the readme.
At present, some of our internal systems are relatively slow. If Prometheus does service discovery every 60s, it will sometimes time out, although most of the time this is not because of a problem, because Prometheus will fail when http_sd fails. Continue to use the last result, but in order to protect the backend system, I plan to add a cache function to http_sd.
The post Prometheus HTTP SD Framework first appeared on Kava Banga! .
related articles:
This article is reprinted from: https://www.kawabangga.com/posts/4761
This site is for inclusion only, and the copyright belongs to the original author.