Last time, I made a simple comparison of the asset structure of CITIC Securities and GF Securities:
CITIC VS GF: Don’t always stare at profits….
This time, let me add a little bit about the “hands-on” process in the history of CITIC Securities and GF Securities ( please verify the accuracy of the following information by yourself ). The story seems to take place around 2004:
Who will be the final winner of CITIC’s acquisition of GF?
far away….
After so many years,
Now, is there anything worth noting about GF Securities? Let me break it down quickly.
With the gradual advancement of the registration system, in recent years, the “institutionalization” of the capital market has become more obvious. For some brokerages, this may be a good opportunity brewing. The public offering fund industry is a typical asset-light and capital-light industry, and its on-balance sheet assets are much lower than off-balance sheet assets. Public funds have scale effects: think about it, why is Berkshire Hathaway only 20 or 30 people at its headquarters? It is said that domestic public funds generally have an ROE of more than 15%, and public funds are an important “track” for securities companies to deploy wealth management.
Excerpted from “Just Announced! The top 20 public fund non-stock, special accounts, pensions, fund subsidiaries, etc. are here” :
“The top fund companies in the top five have a solid position, and they are still E Fund Fund, GF Fund, China Universal Fund, China AMC Fund, and Wells Fargo Fund.”
Now, we will one-sidedly verify the statement that “public funds generally have an ROE greater than 15%” by reading the relevant information of five head funds, namely E Fund, GF Fund, China Universal Fund, China Asset Management, and Wells Fargo Fund. Is it reliable.
1. E Fund Fund (22.7% held by GF Securities)
1. ROE
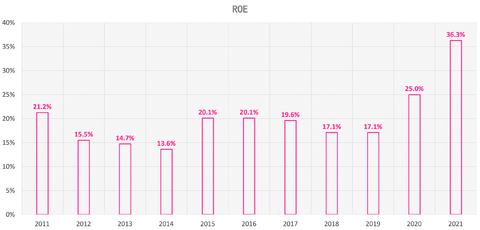
(Data source: estimated from the financial statements of GF Securities)
From 2011 to 2021, the long-term average ROE of E Fund is as high as about 20%.
In 2021, the ROE of E Fund will increase significantly to about 36.3% year-on-year!
(Important: Regarding this article, the accuracy of the data and the objectivity of the opinions are not guaranteed, and it is not used as any investment basis or company evaluation basis!)
………………………………
2. Net interest rate and debt ratio
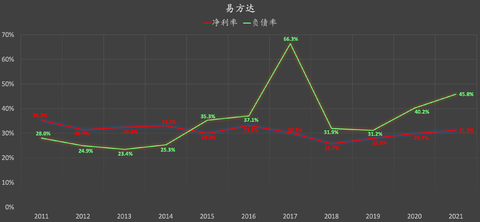
(Data source: estimated from the financial statements of GF Securities)
From 2011 to 2021, the long-term average net interest rate of E Fund is as high as 30.9%, and the long-term average asset-liability ratio is only about 35.4%.
………………………………
2. GF Fund (54.5% held by GF Securities)
1. ROE
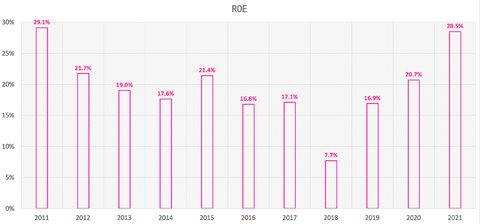
(Data source: estimated from the financial statements of GF Securities)
From 2011 to 2021, the long-term average ROE of GF Fund was as high as 19.7%.
In 2021, the ROE of GF Fund will increase significantly to about 28.5% year-on-year!
………………………………
2. Net interest rate and debt ratio
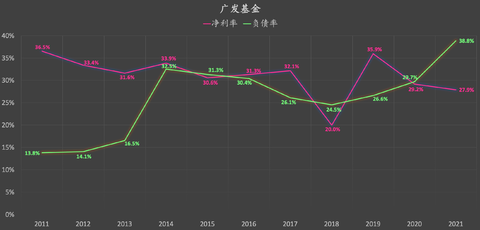
(Data source: estimated from the financial statements of GF Securities)
From 2011 to 2021, the long-term average net interest rate of GF Fund was as high as about 31.1%, and the long-term average asset-liability ratio was only about 25.9%.
………………………………
3. China Universal Fund (35.4% held by Orient Securities)
1. ROE
(Data source: estimated from the financial statements of Orient Securities)
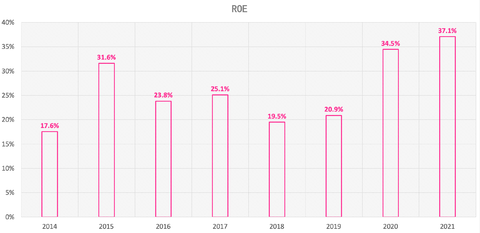
From 2014 to 2021, the average ROE of China Universal Fund is as high as 26.3%!
In 2021, the ROE of China Universal Fund will be as high as 37.1%!
………………………………
2. Net interest rate and debt ratio
(Data source: estimated from the financial statements of Orient Securities)
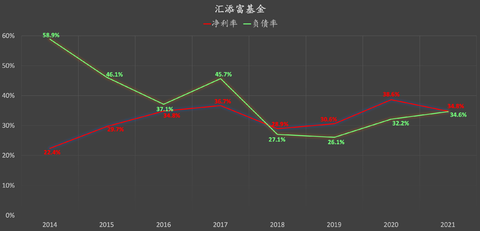
From 2014 to 2021, China Universal’s long-term average net interest rate was as high as 32.1%, and the long-term average asset-liability ratio was only about 38.5%.
………………………………
Fourth, China Asset Management (CITIC Securities holds 62.2%)
1. ROE
(Data source: Estimated from the financial statements of CITIC Securities)
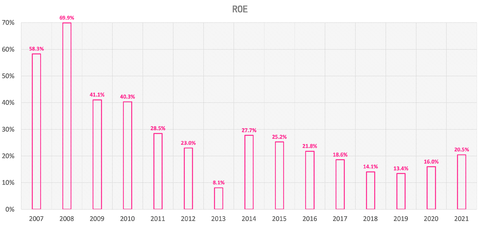
From 2007 to 2021, the long-term average ROE of China AMC was as high as 28.4%!
Especially striking is that in 2008, China AMC’s ROE was as high as 69.9%!
In 2008, the global financial crisis spread, did I read the wrong data? ? ?
So, I opened the 2008 annual report of CITIC Securities:

Guys, help me to see, is ROE 69.9%? ? ?
If I read the data correctly, and the calculation is not wrong, obviously, the public fund business is a good business.
………………………………
2. Net interest rate and debt ratio
(Data source: Estimated from the financial statements of CITIC Securities)
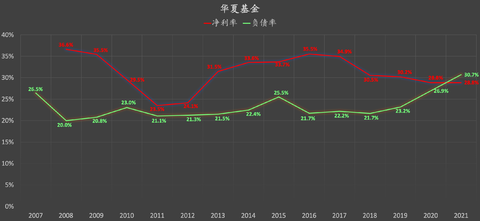
The long-term average net interest rate of China AMC is as high as 31.2%, and the long-term average debt ratio is as low as 23.2%.
………………………………
5. Wells Fargo Fund (Shenwan Hongyuan and Haitong Securities respectively hold 27.8%)
1. ROE
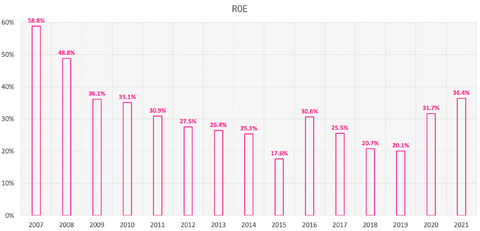
(Data source: estimated from the financial statements of Haitong Securities)
From 2007 to 2021, the long-term average ROE of Wells Fargo Fund was as high as 31.4%!
In 2021, the ROE of Wells Fargo Fund will be as high as 36.4%!
………………………………
2. Net interest rate and debt ratio
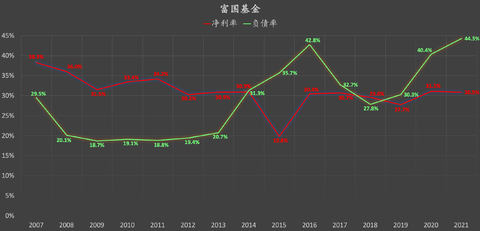
(Data source: estimated from the financial statements of Haitong Securities)
From 2007 to 2021, the long-term average net interest rate of Wells Fargo Fund was as high as about 31%, and the long-term average debt ratio was as low as about 28.8%.
………………………………
Six, compare
Compare the above five public funds:
1. Total asset size
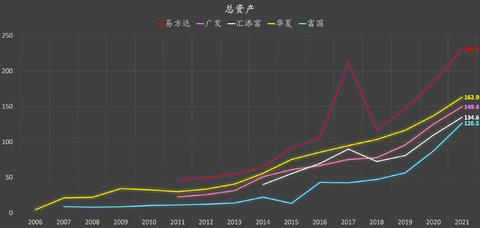
From high to low, they are: E Fund, Huaxia, Guangfa, Huitianfu, and Fuguo.
E Fund is significantly ahead.
………………………………
2. Income scale
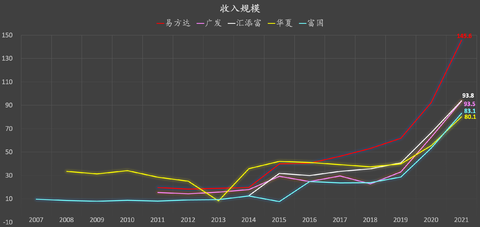
From high to low, they are: E Fund, Huitianfu, Guangfa, Fuguo, and Huaxia.
E Fund is significantly ahead.
………………………………
3. ROE
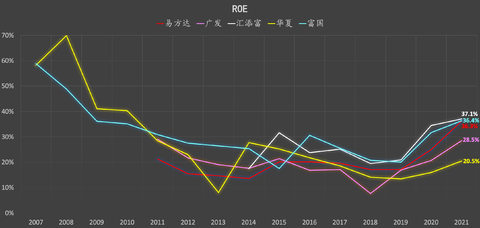
The average ROE from 2014 to 2021, from high to low: China Universal 26.3%, Fuguo 26%, E Fund 21.1%, Huaxia 19.7%, GF 18.3%
………………………………
4. Debt ratio
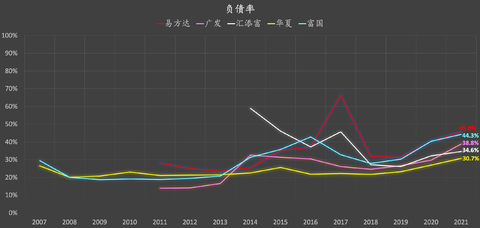
The average debt ratio from 2014 to 2021, from low to high, is: Huaxia 24.3%, GF 30%, Fuguo 35.7%, China Universal 38.5%, E Fund 39.1%
………………………………
Seven, in summary
Holding two major public funds, the total assets of GF Securities are only about 40.1% of that of CITIC Securities. Perhaps, the asset structure of GF Securities has its uniqueness.
【New Books Available: Discounts Available】
Author: me
JD.com purchase link: JD.com’s self-operated store “Value Growth Cycle Stocks: Looking for Certain Profit Opportunities”
The origin of this book: [World Book Day] I wrote a book
…………………………………………
$CITIC Securities(SH600030)$ $ $GF Securities(SZ000776)$ $Orient Securities(SH600958)$
There are 2 discussions on this topic in Snowball, click to view.
Snowball is an investor’s social network, and smart investors are here.
Click to download Snowball mobile client http://xueqiu.com/xz ]]>
This article is reproduced from: http://xueqiu.com/9930706260/219958373
This site is for inclusion only, and the copyright belongs to the original author.