
In the previous articles, we introduced the allocation-based perspective and the transaction-based perspective to analyze the appropriate management size of the fund. Today, I will discuss how to simplify the complexity and simplify the indicators to analyze the appropriate management scale of public funds.
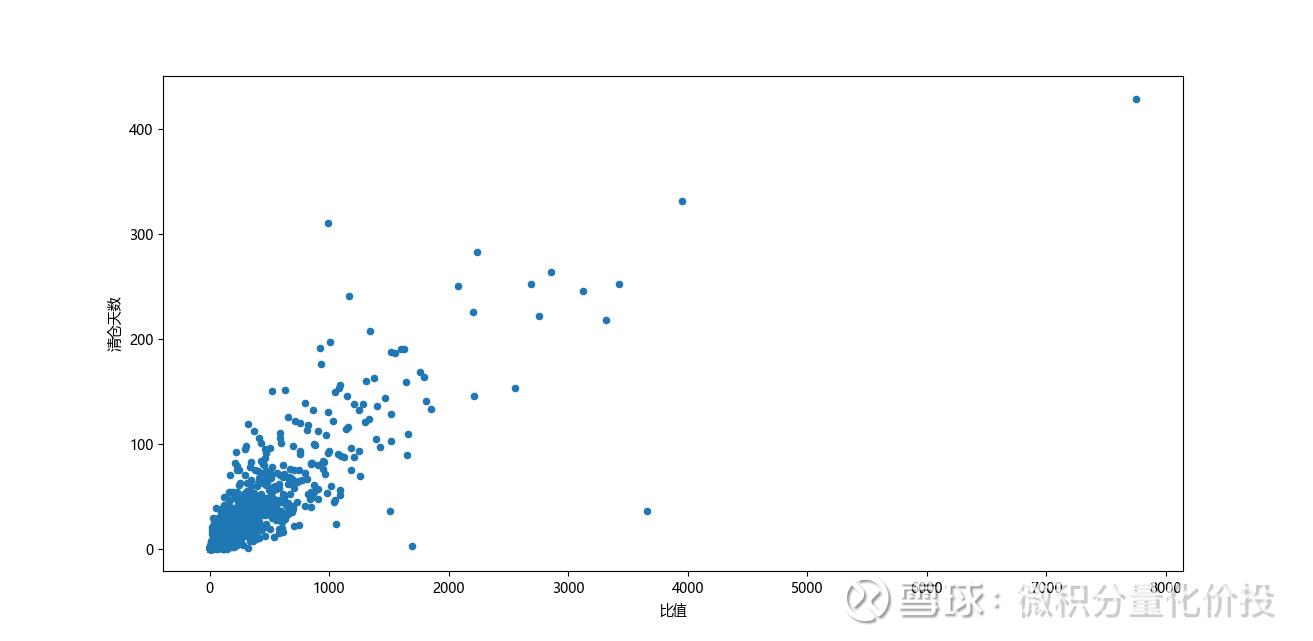
First, the ratio of the calculated combined value of fund size divided by the average daily transaction limit is highly positively correlated with the number of days of liquidation (correlation coefficient 0.87). This is easier to understand because it is nothing more than a different weighting method. Liquidation days are calculated first for each stock, and then the weighted sum is calculated. The combined value of the fund size divided by the average daily turnover limit is first calculated as the weighted ratio of individual stocks, and then the weighted sum is calculated.
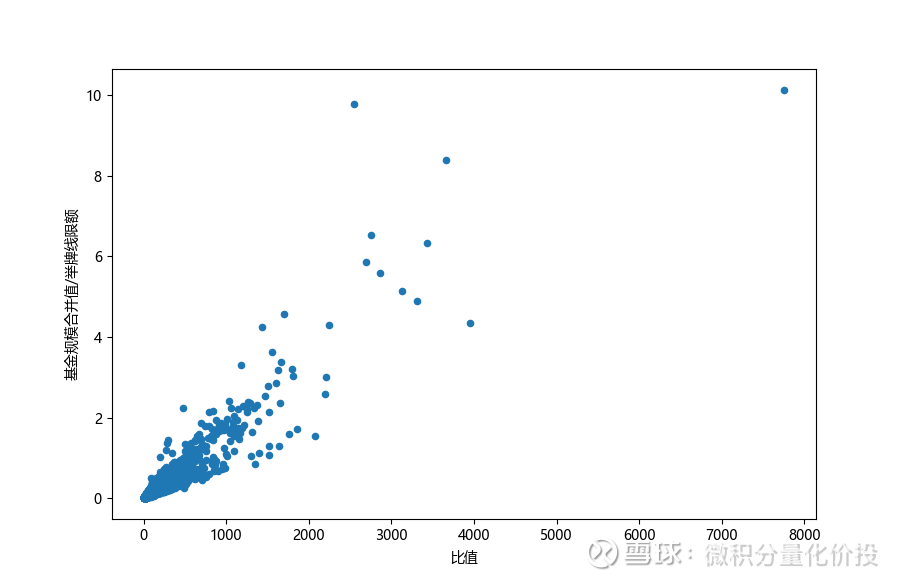
In addition, judging from the correlation between the placard line limit and the ratio of the combined value of fund size divided by the average daily transaction limit, the two values are also highly correlated (correlation coefficient 0.93). This is actually relatively easy to understand. Stocks with a relatively large total market capitalization generally have better average daily turnover and liquidity.
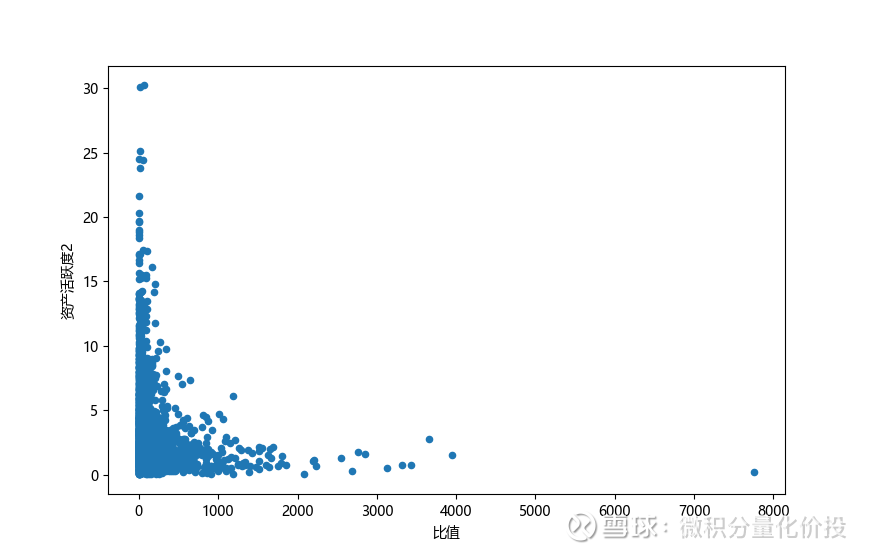
In addition, from the perspective of the correlation between the asset turnover rate 2 and the ratio of the combined value of fund size divided by the average daily transaction limit, there is basically no correlation between the two (correlation coefficient -0.16).
From the 3D chart: X: daily average transaction limit, Y: asset activity 2, Z: combined value of fund scale.
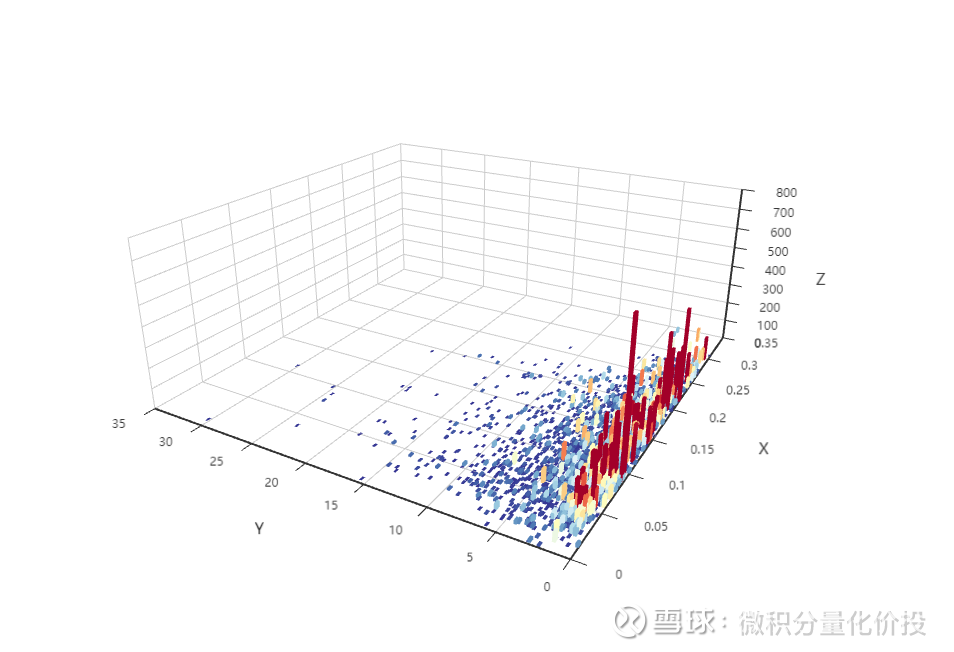
From the 3D chart above, the higher the sample size (red column) of the fund, the higher it basically only appears in the comparison area of the Y index (asset activity level 2). This shows that the biggest factor affecting the size of the fund is the asset activity. Only when the asset activity 2 is relatively low can it support a relatively large market value, followed by the average daily transaction limit. Even if the asset activity level 2 is relatively low, if the average daily turnover is relatively small, the upper limit of the management scale is relatively low.
Now that we know these two key factors that affect the size of the fund, how to calculate the appropriate management size of the corresponding fund manager? There are two ideas here, one is to find a perfect formula and directly calculate the appropriate management scale of the fund through the input parameters, and the other is to infer the appropriate management scale based on actual data. The second method is mainly adopted here. For example, if a certain indicator is considered to be at the 99% percentile of the whole market, it is considered to be the ceiling of the market. If it exceeds this value, it is considered to be an abnormal situation, so it can be reversed according to this threshold. The ceiling of the fund’s management scale Where.
Idea 1
First, the daily average transaction limit is divided into 10 equal parts from small to large, and the number of samples in each equal part is the same, and then a similar distinction is made for the asset activity level 2, and the statistics are divided into different groups of daily average transaction value and assets. In the case of group activity 2, the quantile of 95% of the combined size of funds, that is, in this case of average daily turnover and asset activity 2, the combined size of funds is sorted from small to large, and only 5% of the foundations exceed this. size limit.
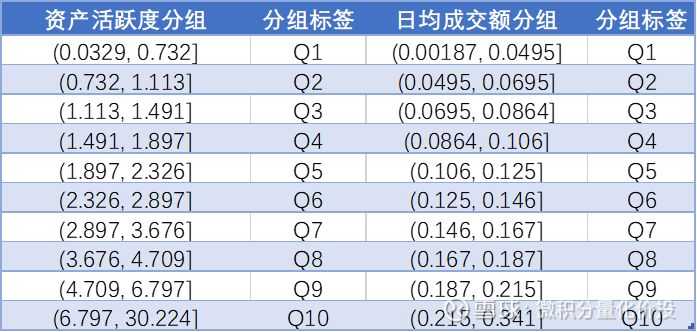
According to the above labels, the calculation results are as follows. For example, in the table below, the average daily transaction limit is grouped in Q1, and the asset activity is grouped in Q10, which means high turnover and low market value. Only 5% of the fund scale exceeds 1.258 billion, that is, if it exceeds this value, it can be It is believed that the fund has far exceeded the market average, and the fund size may not be within the appropriate range of the fund manager.
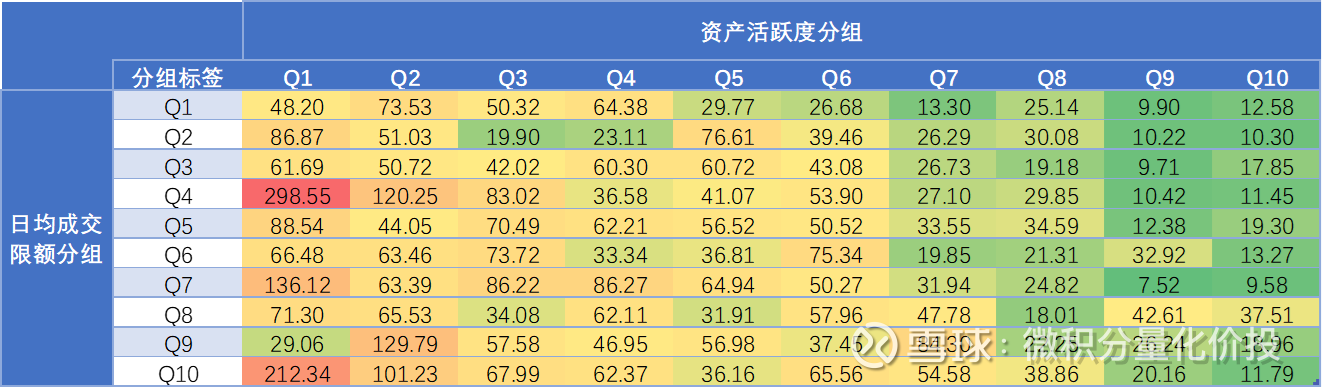
For example, Sheng Fengyan’s quantitative growth of western profits is in this range, and now the combined value of the fund scale has reached 1.7 billion. I would subjectively believe that the management scale of Sheng Fengyan is a bit more than the “comparably comfortable management scale”.
But there seems to be a problem. For example, for the online celebrity fund Jin Yuan Shun An Yuan Qi, the calculated scale threshold is 2.668 billion, but the current scale is 1.2 billion. According to this calculation, there is no indication that the scale exceeds the limit, but the actual situation is very Possibly overrun. The specific reason is that the previous grouping is too broad. For example, the span of asset activity partition and average daily turnover grouping is very large.
Idea 2
The liquidation days calculated earlier reflect the number of days it would take to sell all the stocks. This is to describe the liquidity of the position from the limit of the actual position.
In addition, from the management style of the fund manager, through the data of the interim report and the financial report, it can be inferred: asset activity = (total stock purchases + total stock sales)/average net asset value.
Among them, asset activity reflects the ratio of the fund’s stock trading volume to its net asset value within one year. Assuming that there are 365 days in a year, then 365/asset activity probably reflects the period in which the fund manager holds stocks. For example, Sheng Fengyan’s quantitative growth of Western Profits, the asset activity 2 calculated in the 2022 interim report is 7, because the interim report The data is calculated for half a year, and if the year is extended to 14, then the corresponding number of days for holding positions is 26 days, which is a little more than one month. This is in line with the holding period of Shengfengyan Roadshow, which is about one month to one and a half months. .
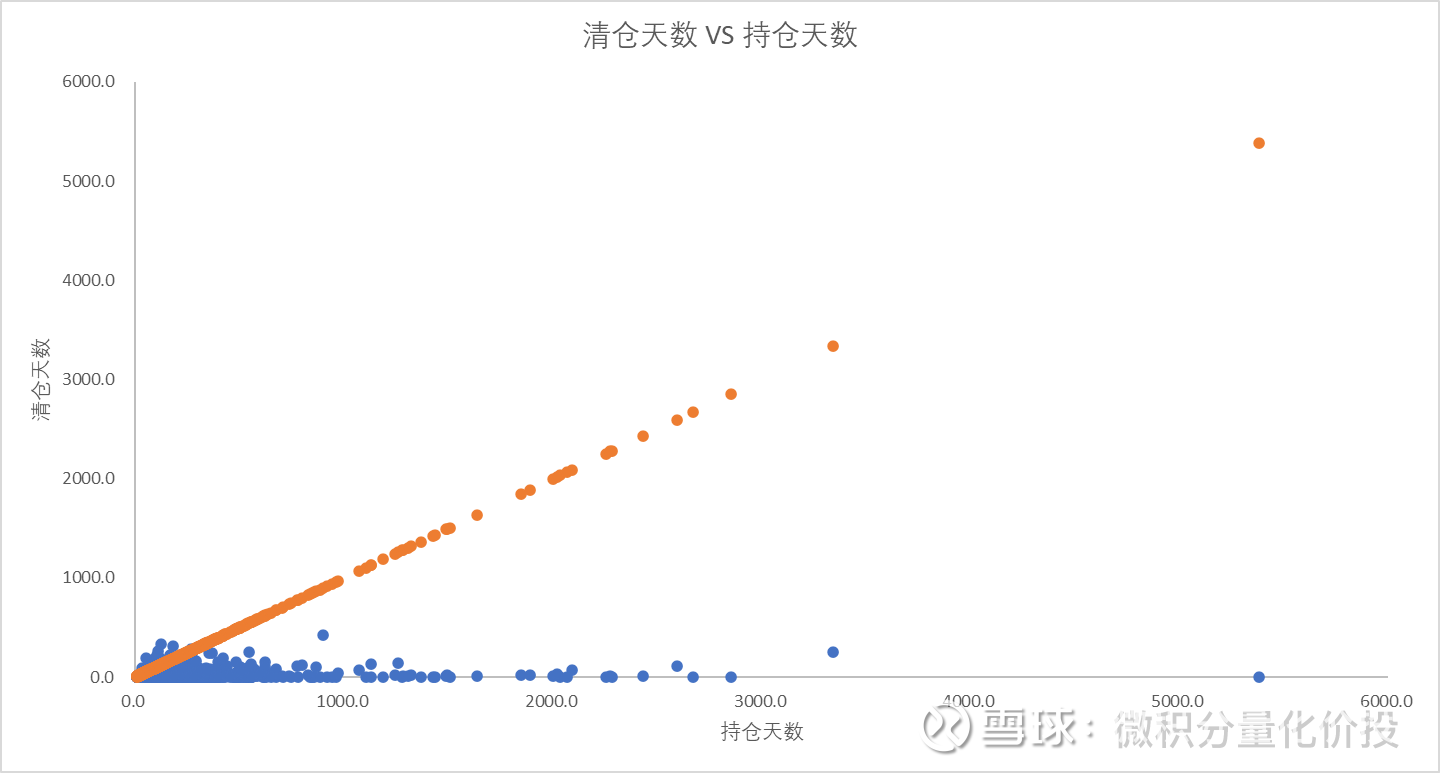
In this way, naturally, there is an intuitive way of thinking, by comparing the number of days of liquidation and the number of days of holding positions to roughly infer whether the size of the current fund is comfortable. If the clearing days are much higher than the holding days, for example, the holding days are 3 days, but the clearing days are 30 days, there will be a big problem in operation, and the positions will be replaced within 3 days, but these stocks will take 30 days to clear their positions. , the clearance cannot be completed normally in a short period of time. Conversely, if there are 30 days of open positions, but only 3 days of liquidation, the liquidity is good.
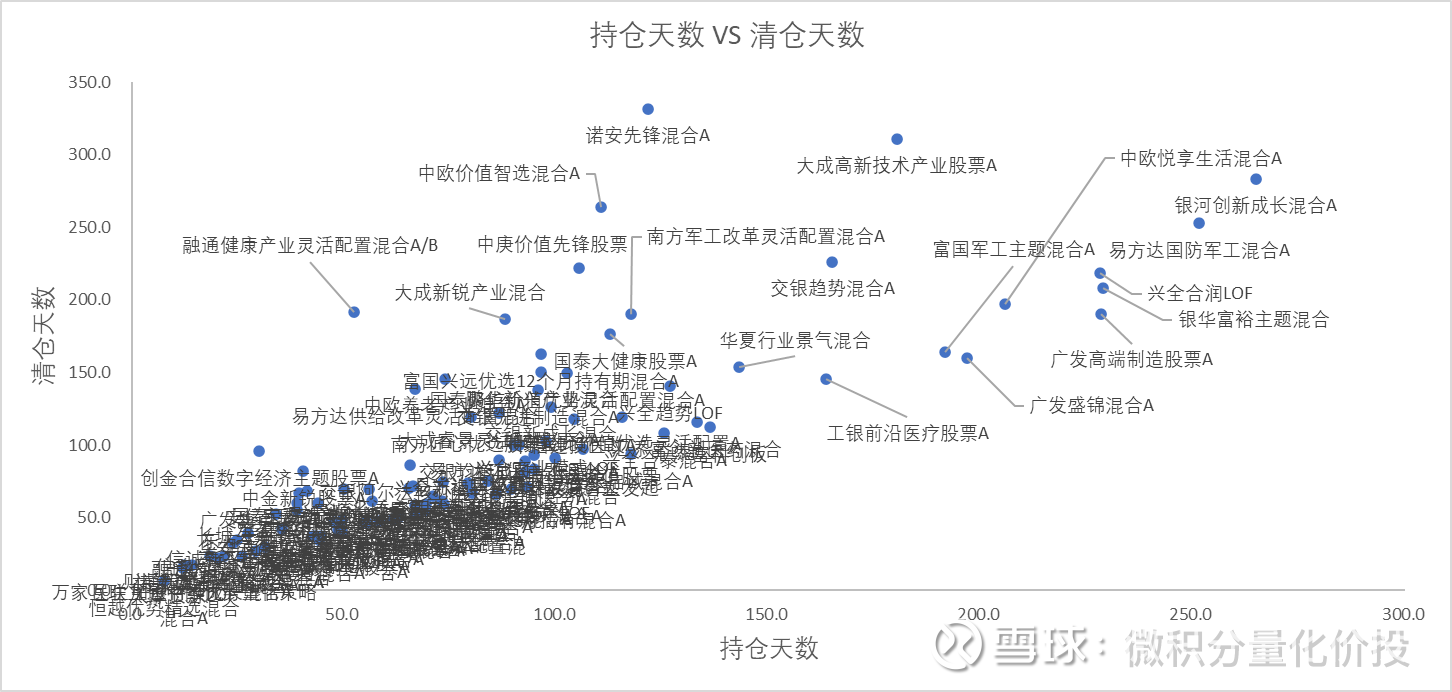
The figure below is a scatter plot of the number of days of holding and clearing positions of active equity funds in the 2022 interim report. The orange point indicates that the number of days of holding and clearing positions is consistent. If the blue point is above the orange line, it means that the number of days of clearing positions is greater than the number of days of holding positions. The larger the upward deviation is, the larger the number of days of liquidation is currently than the number of days of holding, and the fund scale may be too large.
Calculate the over-limit ratio = the number of days to clear the position/the number of days to hold the position. The higher the over-limit ratio, the larger the current scale is from the “comfortable” scale. The following are some funds with the highest over-limit ratio.
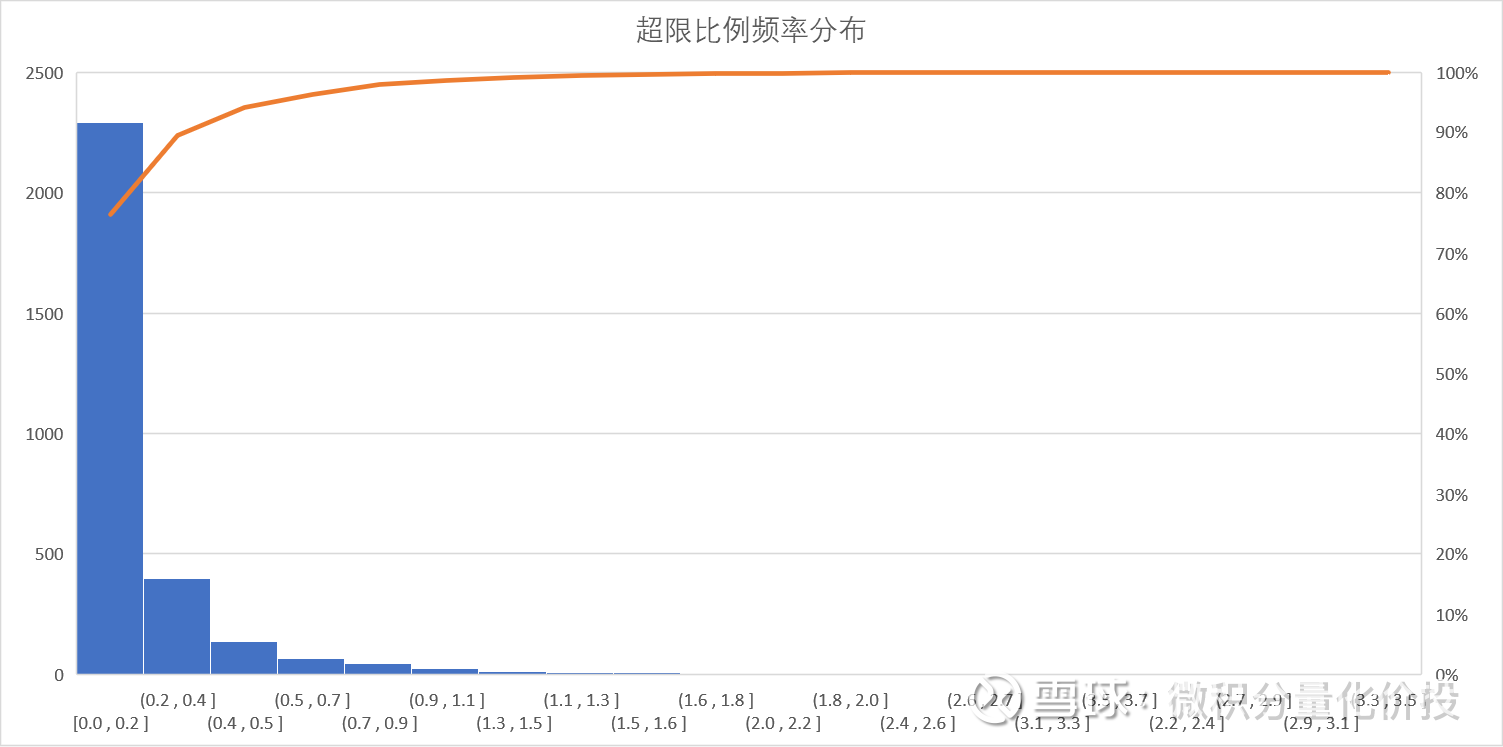
In addition to the perspective of the absolute value of the overrun ratio, it can also be observed from a relative perspective. From the frequency distribution of over-limit ratios, most funds in the market have over-limit ratios below 0.7. From here, we can use the values of different percentiles as the thresholds for judging whether the fund size is appropriate. For example, the historical percentile of 99% of the over-limit ratio from small to large is 0.9. If the over-limit ratio of a certain fund exceeds This value shows that the ratio between the number of days of liquidation and the number of days of holding positions of this fund is very extreme in the whole market, so it can be subjectively believed that the current size of this fund does not match the turnover rate.
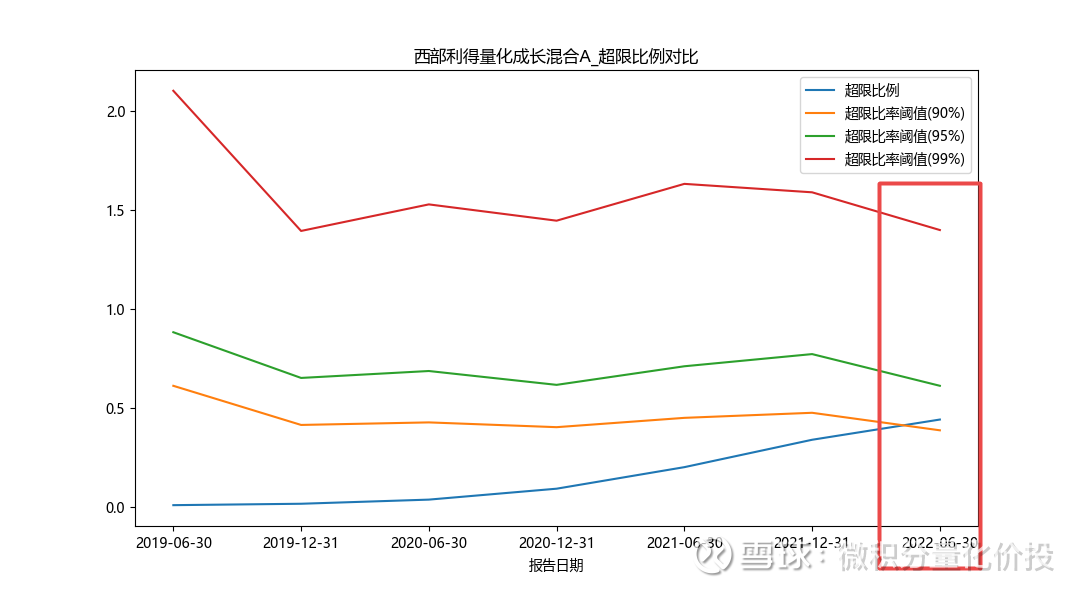
Above is the analysis for a single reporting period. It can be extended to each reporting period in history, and the historical percentile of the excess ratio is calculated in each reporting period as a threshold for comparison. For example, a fund exceeds the 99% percentile of the same period, indicating that the excess It far exceeds the level of the same type in the market, indicating that the current number of days of clearing positions and the number of days of holding positions do not match very well. It may be that the current fund manager’s management scale exceeds the more comfortable scale of its management.
For example, for the quantitative growth of western profits, with the growth of scale in the past 1-2 years, the over-limit ratio has increased rapidly, and the recent over-limit ratio has exceeded 90% of the historical percentile.
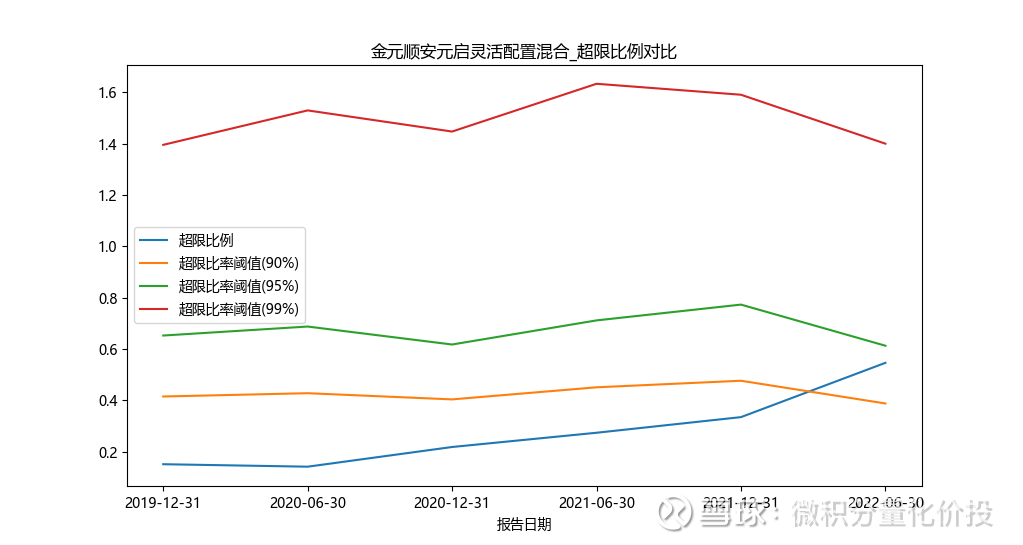
Looking at the flexible configuration of the Internet celebrity fund Jinyuan Shunan, the overrun ratio will increase rapidly after 2021. It has already exceeded the 90% threshold, and the next step will exceed the 95% threshold, which also explains why this fund should start Purchase is limited.
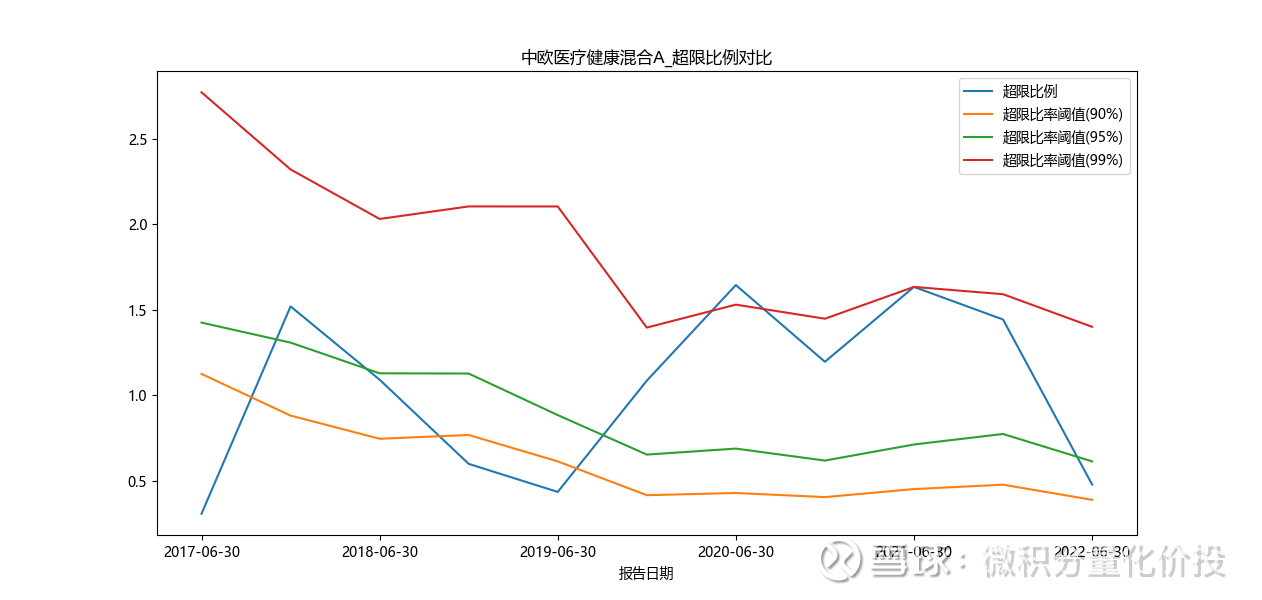
In Sino-European Healthcare Hybrid A, the early overrun ratio exceeded the historical threshold of 99%. Recently, the scale may be too large, and it is impossible to adjust the position. Therefore, the turnover rate has decreased, and the corresponding clearance days have increased. As the denominator increases, the overrun ratio decreases.
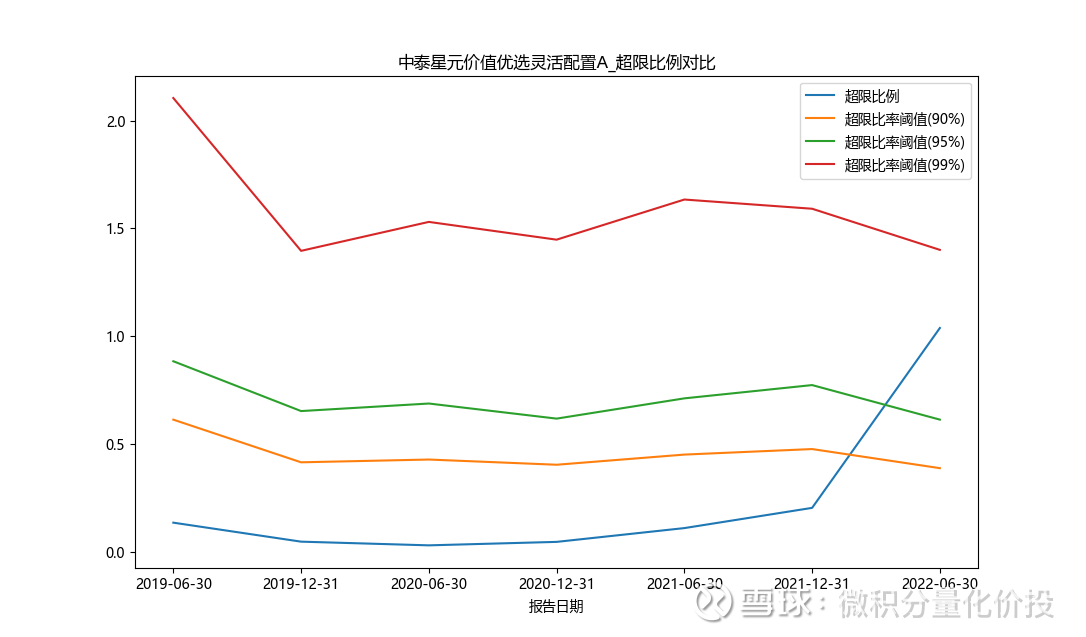
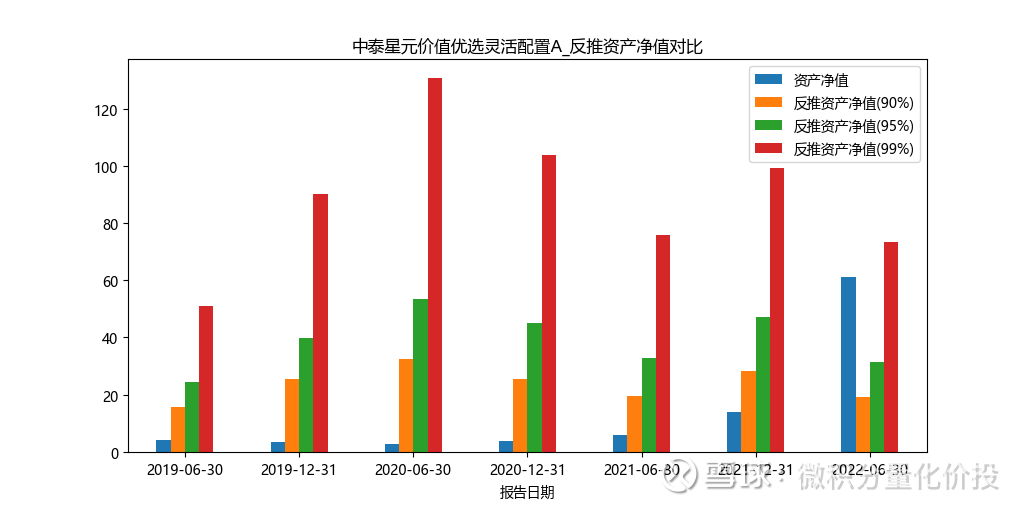
Looking at the optimal value of Zhongtai Xingyuan in the small and medium-cap style, the overrun ratio has exceeded the threshold of 95%, indicating that the current position and the frequency of position adjustment are not very matched, and the current management scale exceeds its more comfortable management scale.
The above discussion is still active equity funds, whether it can be relaxed to equity funds, including index funds and index-enhanced funds, so that the appropriate scale of index-enhanced funds can be observed.
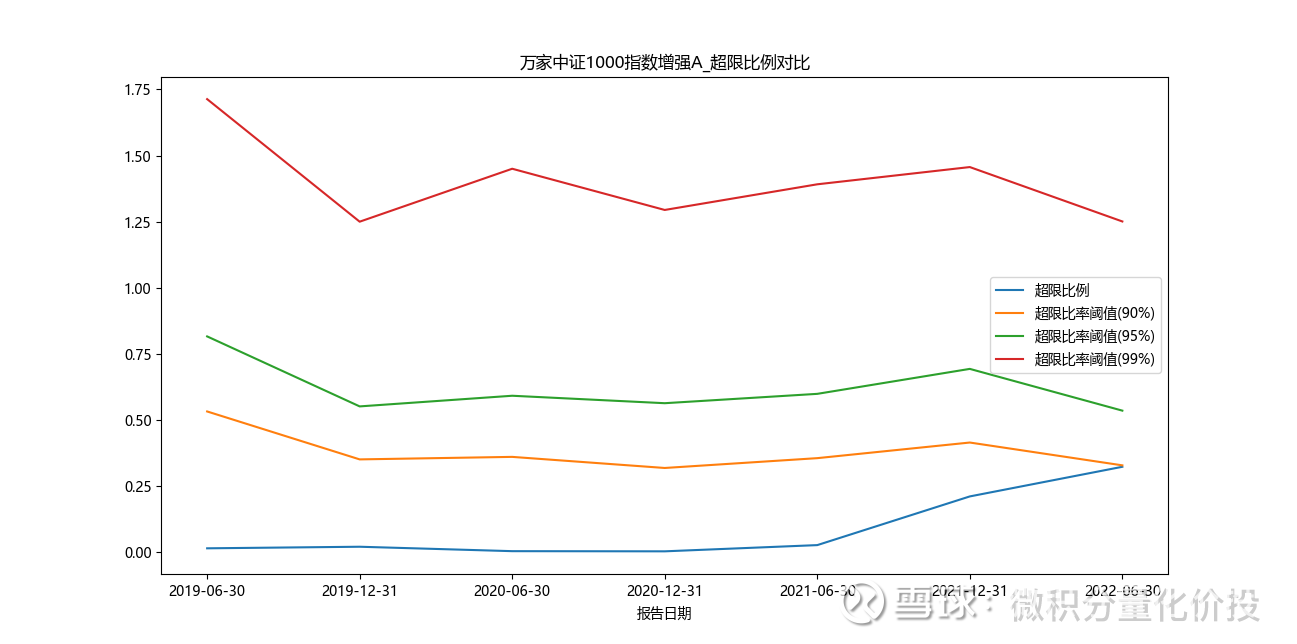
For example, for the Wanjia CSI 1000 Index Enhanced Fund, with the increase in scale, the excess ratio has increased rapidly, and it has now exceeded the 90% threshold.
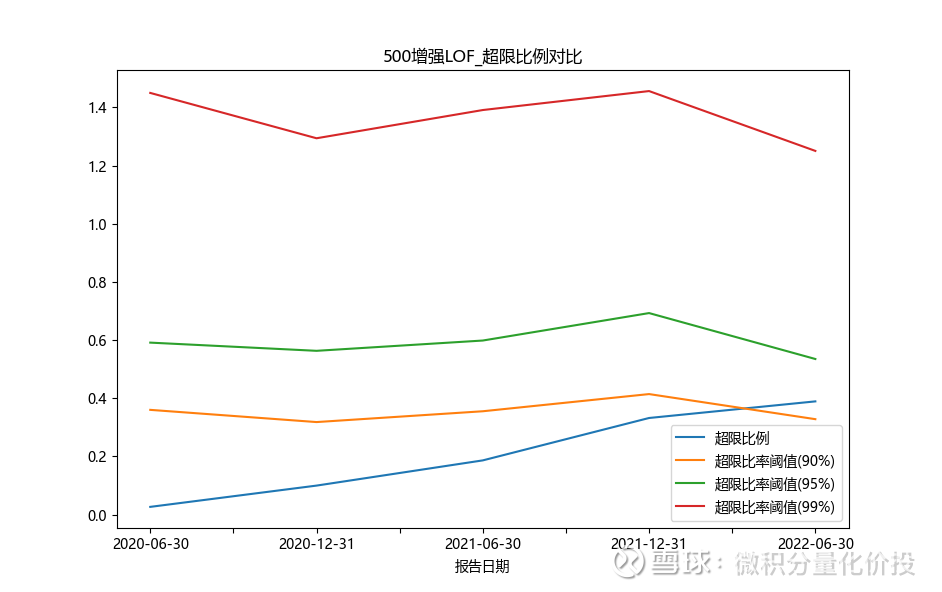
The Western Gains CSI 500 Index strengthened, and there was a similar phenomenon.
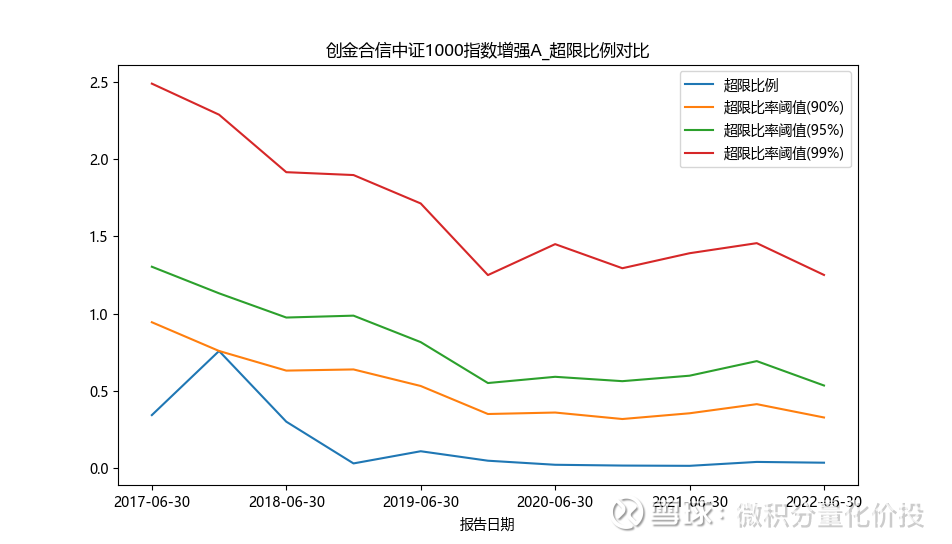
For Chuangjin Hexin CSI 1000 Index Enhanced A, this excess ratio is very low.
For the convenience of description, this excess ratio will be recorded as the scale excess ratio in the future, which is more convenient to understand. In addition to this ratio relationship, we also pay more attention to the value of the upper limit of the fund management scale, which is more convenient for comparison, especially when the fund manager manages multiple funds.
On the basis of the previous analysis, the upper limit of the size that is more comfortable for fund management can be simply reversed. Assuming that the size of a fund exceeds the limit ratio = the number of days of liquidation / the number of days of holding positions = 0.5, then the number of days of liquidation = the ratio of over-limit size * the number of days of holding positions. Assume that the turnover rate of the fund manager remains unchanged, that is, the number of days in which the position is held remains unchanged. Then, assuming that the 95% historical percentile of all scale overrun ratios in the same period is taken as a limit for the number of days to clear positions, then the threshold of days to clear positions/number of days to clear positions is multiplied by the fund’s original stock market value and net asset value, which is reflected in the In the case of the turnover rate of the day, it is assumed that the fund obtained by reverse inference under the 95% scale overrun ratio is a more suitable scale.
For example, for the quantitative growth of Shengfengyan’s western profits, the calculation results are as follows:
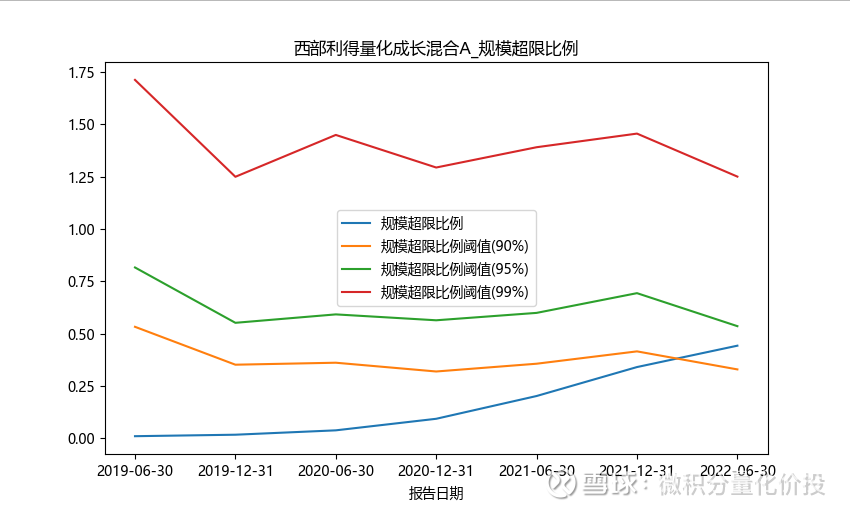
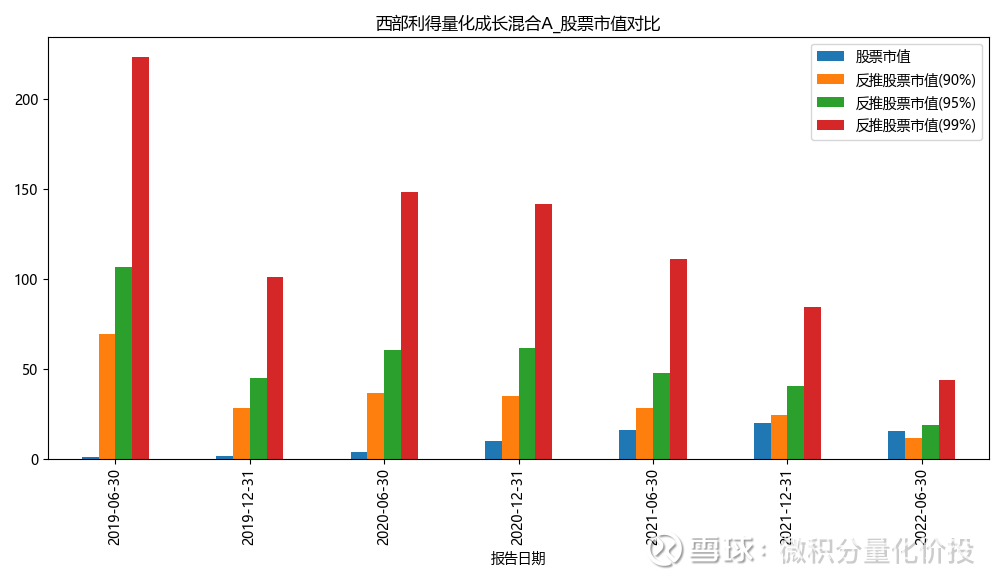
From the perspective of the proportion of scale exceeding the limit, the overall value of the market is in a downward trend, but the quantitative growth of Western profits is also increasing significantly with the scale of the scale exceeding the limit. The market value and net asset value of the stocks obtained by calculating the reverse push are as follows: The market value of the stocks reversed by the market as a whole is declining, especially the 2022 mid-year report, and its reverse push scale has dropped significantly compared to the previous one. This may be the recent decline in the overall market liquidity. , the overall market transaction is not active. The scale of the corresponding quantitative growth of Western Profits is growing rapidly, and has slowly caught up with the stock market value and net asset value pushed back by the 90% percentile.
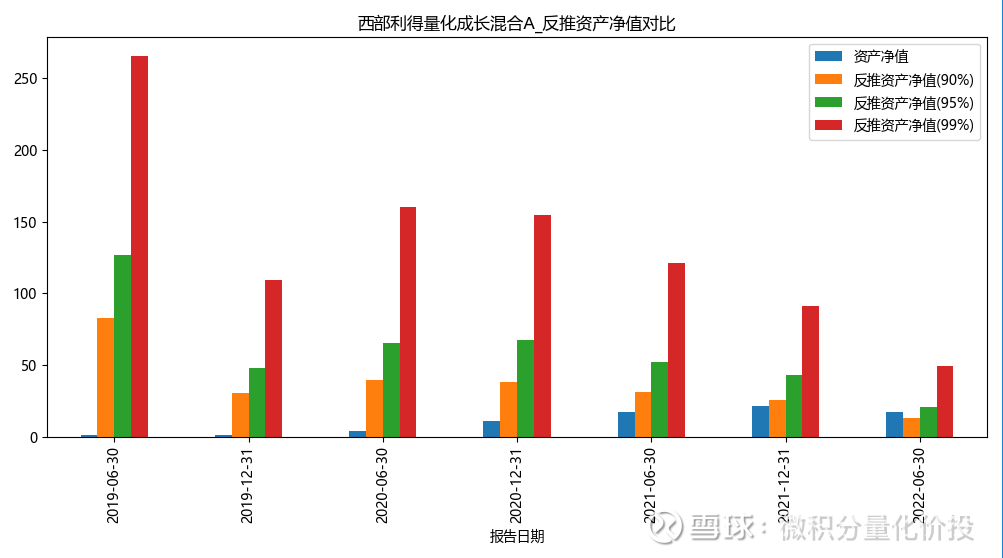
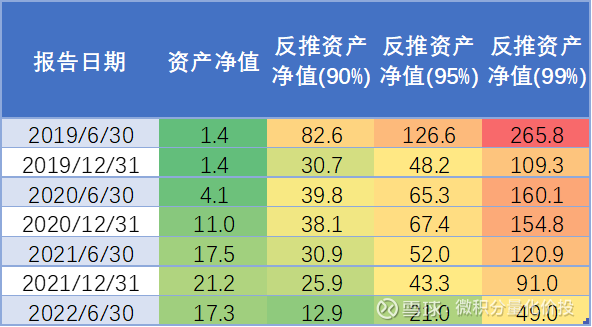
The following is the specific value of the reversed NAV. Although the net asset value of the reverse push in 2022 will be relatively low, which is almost halved compared to 2021, this may be an extreme situation, so I personally prefer to refer to the data in the 2021 annual report. I think the quantitative growth of Western Profits is more comfortable. The management scale is around 3-4 billion.
Of course, there will be some errors in this estimation process, but the “comfortable” management size of the fund itself is a relatively vague range, so more of the pursuit is vague and accurate.
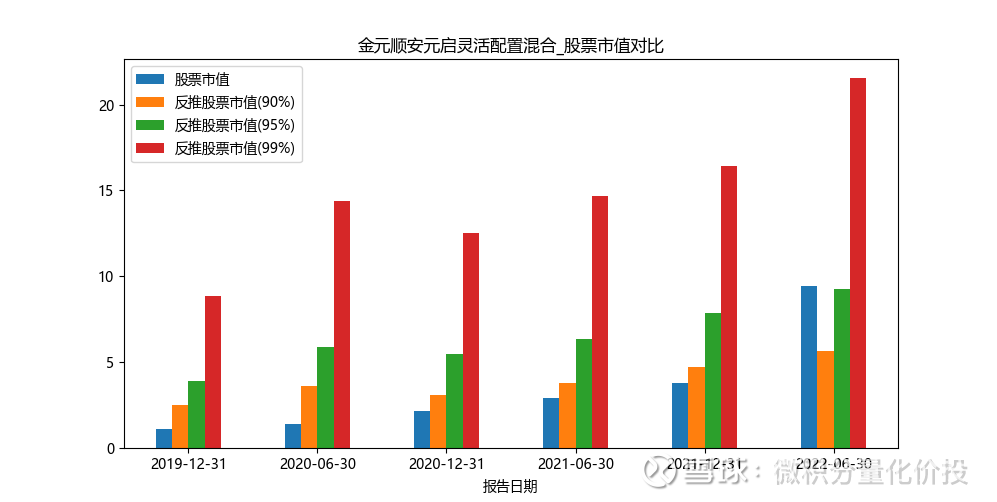
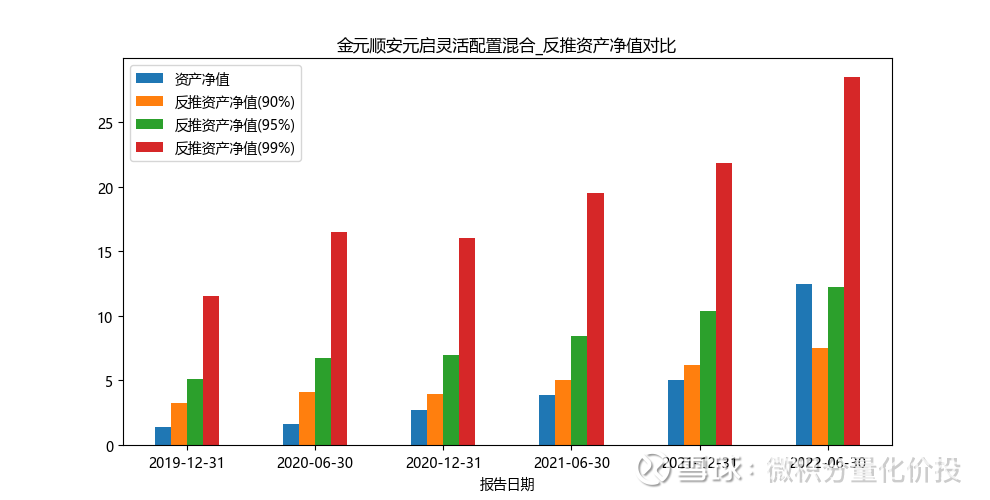
The following is the situation of the net red fund Jin Yuanshun An Yuanqi: so it is not difficult to understand the purchase restriction of this fund.
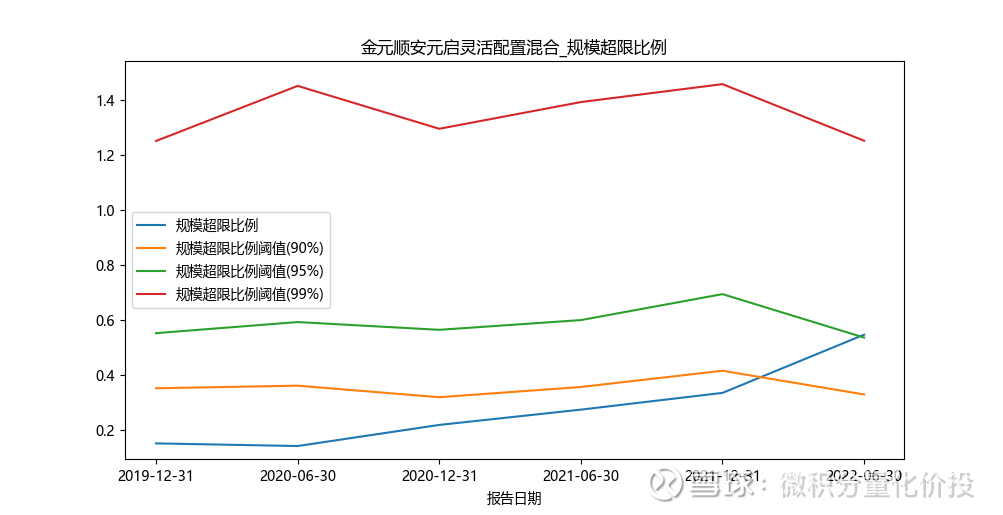
From the perspective of the reverse push scale, the current stock market value and net asset value have both exceeded the 95% threshold.
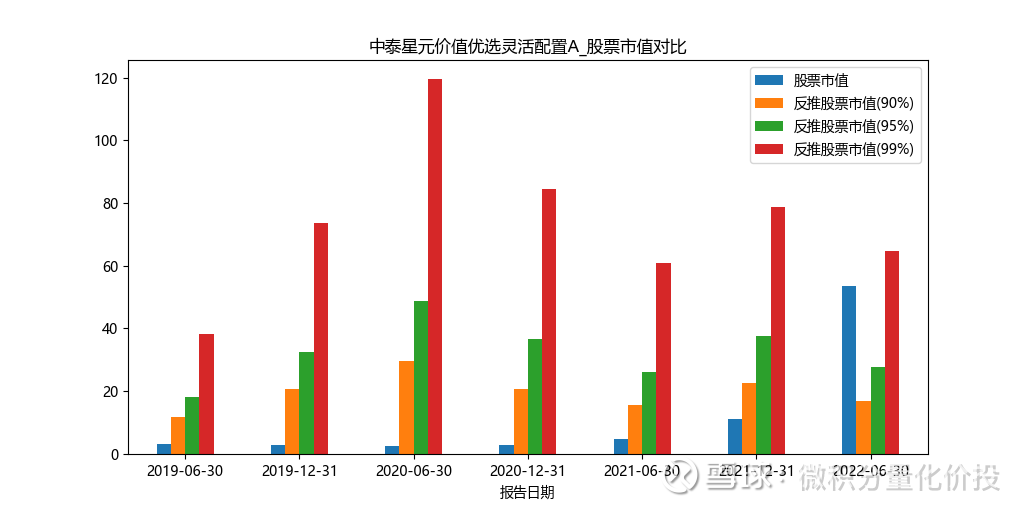
Let’s look at the situation of Zhongtai Xingyuan. Zhongtai Xingyuan is mainly in the style of small and medium-sized caps, and the stock holdings are not very liquid. With the rapid increase in scale, the corresponding scale exceeds the limit significantly.

Judging from the observed reverse push market value, the current scale has far exceeded the reverse push NAV under the 95% threshold.
Summarize
First of all, it needs to be stated that the relatively comfortable management scale of public equity funds is a relatively vague concept. It is not that the management scale of the fund manager cannot exceed this value, nor that the performance of the fund will definitely decline after it exceeds this scale.
Fund managers have more ways to deal with this problem, such as actively reducing the turnover rate, increasing the dispersion of stock positions, buying stocks of the same type, rather than increasing positions in a certain stock all the time.
From the perspective of the buyer, if I find that there is a relatively large difference between the size of a fund and the more comfortable size of the reverse push, I will think that the previous management method of the fund manager will definitely need to be changed. Accommodate gradually increasing size. I will focus on the next step of the fund manager, whether it reduces the turnover rate or increases the dispersion of positions. If the fund manager mainly contributed income based on the high turnover trading ability before, then the income contributed by this part of the subsequent contribution may be significantly reduced.
In addition, in the process of calculation, there may be some errors, such as drastic fluctuations in scale, resulting in an abnormal number of estimated holding days, resulting in abnormal calculation of the whole. Therefore, at this time, it is recommended to look at the data of multiple periods, and then take the average of the data of multiple periods. estimated in this way.
The conclusion is that we cannot accurately estimate a management scale, and then fund managers are not allowed to exceed this range. Just like Sun Wukong draws a circle with a golden hoop, we can only pursue a vague accuracy and have an anchor in our hearts.
At this point, the full text is over, thank you for reading.
If you find any mistakes or omissions in my analysis, please correct me and add them.
The above content is only used as a personal investment analysis record, and only represents personal opinions. The analysis content is based on historical data. Historical performance does not indicate its future performance, and does not serve as a basis for buying and selling, and does not constitute investment advice.

Like and watch, investment makes more ¥
#Calculus Quantitative Price Investment # #Snowball Star Project Public Offering Talent# #ETF Star Push Official#
@ Egg Roll Index Fund Research Institute @ Today’s topic @ Snow Ball Creator Center @ Egg Roll Fund @ golfer welfare @Ricky
Quickly retrieve historical articles
$Zhongtai Xingyuan Flexible Configuration Mix A (F006567)$ $ Western Profit Quantitative Growth Mix A (F000006)$ $ Jin Yuan Shun An Yuan Qi Mix (F004685)$
This topic has 11 discussions in Snowball, click to view.
Snowball is an investor’s social network, and smart investors are here.
Click to download Snowball mobile client http://xueqiu.com/xz ]]>
This article is reproduced from: http://xueqiu.com/4778574435/233745095
This site is for inclusion only, and the copyright belongs to the original author.