introduction
Debug is a programming ability, the sooner you learn the better. And Xdebug is the most powerful tool for debugging PHP, this article is to introduce how to use Xdebug .
Install
|
|
Modify the default configuration of xdebug (optional):
View the configuration file of php.ini :
|
|
View debug configuration
|
|
After getting the configuration file of php.ini , add the following code:
|
|
Configure Phpstorm
PhpStorm > Preferences configuration, find PHP > Servers , add a Server, the configuration is as follows:
- Name:
serverName - Host:
127.0.0.1 - Port:
8000 - Debugger:
Xdebug
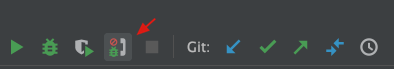
Switch xdebug place in the menu at the top of Phpstorm as shown above
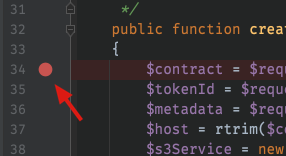
After enabling xdebug, just mark the place where you need to break the point.
trigger
The default is to not trigger the breakpoint function
browser
Installing the Chrome Xdebug Helper extension will automatically add parameters to each request.
Postman
Add parameter XDEBUG_SESSION_START=PHPSTORM to URL
- Configure Xdebug
- Configure Xdebug for Docker
- PhpStorm + Xdebug + Postman debugging environment configuration
This article is reprinted from: https://blog.forecho.com/use-xdebug.html
This site is for inclusion only, and the copyright belongs to the original author.