Brief description: Visual Studio breakpoint debugging arrow offset into the wrong function, catching the weird phenomenon  remember.
[TOC]
This article was originally published on ” Xie Zang’s Small Station “, and is reproduced here simultaneously.
background
I haven’t encountered such an interesting bug for a long time, let’s catch a debug pointer with an offset error  of .
of .
After the derived class implemented in C++ and the two virtual functions A and B rewritten in the class, the code is actually written to call the A function, but the breakpoint Debug debugging hits the B function. 
win10 21H2 
Visual Studio 2019
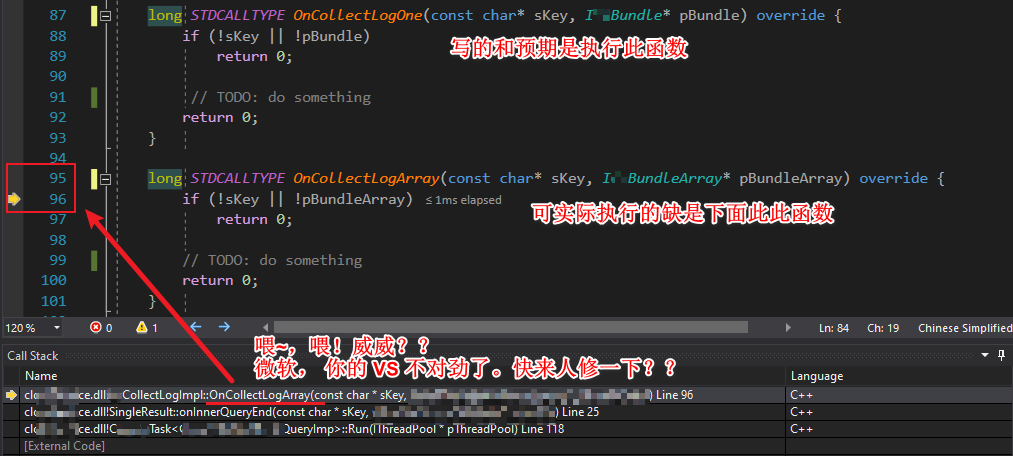
MyCollectLogImpl is a derived class of IMyCollectLog , and then the code calls the OnCollectLogOne function of the derived class, but the debugging arrow and breakpoint enter another OnCollectLogArray function; very weird.
class IMyCollectLog : IMyUnknown { public : virtual long STDCALLTYPE OnCollectLogOne ( const char * sKey , IMyBundle * ) = 0 ; virtual long STDCALLTYPE OnCollectLogArray ( const char * sKey , IMyBundleArray ) = 0 ; } ; class MyCollectLogImpl : public CloudService :: IMyCollectLog { public : long STDCALLTYPE OnCollectLogOne ( const char * sKey , IMyBundle * pBundle ) override { if ( ! sKey || ! pBundle ) return 0 ; // TODO: do something return 0 ; } long STDCALLTYPE OnCollectLogArray ( const char * sKey , IMyBundleArray * pBundleArray ) override { if ( ! sKey || ! pBundleArray ) return 0 ; // TODO: do something return 0 ; } // ... 定义其它成员函数和成员} ;
The function at the call site is
void onInnerQueryEnd(const char* sKey, IMyBundle* pBundle) { if (m_setCollLogPtr.empty()) return; for (auto it : m_setCollLogPtr) it->OnCollectLogOne(sKey, pBundle); // *** 写的是执行OnCollectLogOne, 而非是OnCollectLogArray, 虽然两者行参长得很像***}
To explain with a picture is:
question
- Breakpoint debugging arrows are offset to other functions. This encounter
- When debugging with breakpoints, neither breakpoints nor arrows can enter a function. met before
Both are actually the same root cause.
solve
- Turn off optimizations in Release compilation mode
- When a function is implemented, the details are not implemented for the time being (only if the pointer is judged to be empty and the return statement, the details are not written), when you just want to debug the framework, you can add an
int a = 0or例子打印语句to the function to avoid being Compiler optimizations. - First switch to Debug mode to compile, replace the file verification code, and switch back to Release mode to locate
Compiled in Release mode, even if optimization is turned off [1] , there are still optimizations. If an empty function is implemented, it will be optimized away, and no assembly statement corresponding to this function can be viewed in the disassembly window. “It’s a big hole.”
Note:
[1] Visual Studio 2019 project property page, “Configuration Properties – C/C++ – Optimization”, Optimization is set to Disabled (/Od) ; make the compilation in Release mode turn off all optimizations.
This article is reproduced from: https://ifmet.cn/posts/83002d8f/
This site is for inclusion only, and the copyright belongs to the original author.