Source: Zhitong Finance
Author: Ma Huomin
The S&P 500 is down nearly 14% this year. When is a good time to buy U.S. stocks? Doug Ramsey, chief information officer at The Leuthold Group, said focusing on the High-Low Logic Index can help spot market bottoms.
It is understood that the high-low logic index is defined as the percentage of stocks that have reached a new 52-week high or low relative to all stocks, whichever is the smaller of the two. The index measures the degree of divergence within the market, with a high index level indicating bearishness and a low index level indicating bullishness, because in a normal market, individual stocks tend to converge, and when the intramarket divergence increases, it is often a bear market warning Signal.
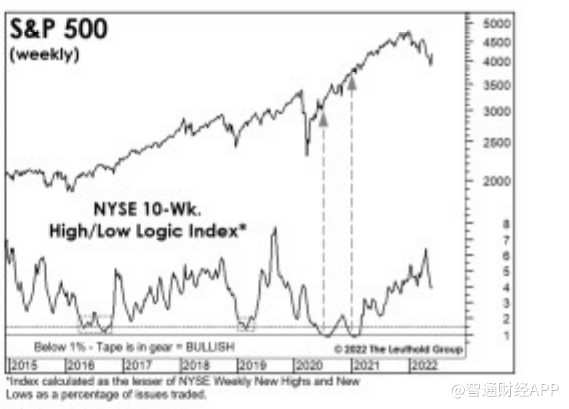
“To get a bullish signal on the high-low logic index, we would need to see the proportion of stocks with new 52-week highs or new 52-week lows (or both) falling consistently to extremely subdued levels,” Ramsey said. “We monitor 21 days simultaneously. and the 10-week version of the indicator. The latter signals less frequently, sometimes not appearing until weeks after the final low is formed. But they have been very reliable.”
“The S&P 500 is up 18.8% on a 12-month average following a 10-week high-low logic index giving a buy signal, with a forecast win rate of 16-0,” Ramsey said.
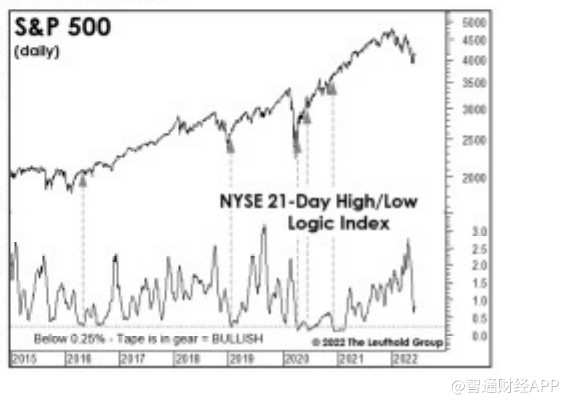
Ramsey said: “The recent 21-day high-low logic index has also been very accurate in buying signals, especially in 2020, when the index predicted that the sell-off will end only nine days after the market bottomed due to the new crown epidemic.”
The index “confirmed the market lows of February 2016 and December 2018 were also fairly timely, while the only truly embarrassing buy signal occurred midway through the 2000-2002 tech crash.”
Ramsey said it’s too early to look for a “major bottom in stock prices,” but he’ll be keeping a close eye on the high-low logic index.
10-week version of high-low logic index trend
21-day version of the high-low logic index trend
Editor/Jeffrey
This article is reprinted from: https://news.futunn.com/post/16297640?src=3&report_type=market&report_id=207785&futusource=news_headline_list
This site is for inclusion only, and the copyright belongs to the original author.