Because our estimation method uses three data parameters of voltage, current and temperature to estimate the SOC of the battery, the battery itself has decay all the way, and the main problem of the algorithm for estimating the remaining capacity SOC is that the SOC algorithm needs to know the initial SOC , It is necessary to know the capacity of the battery. During the calculation process, due to the accumulation of measurement errors (errors of V, I and T acquisition parameters), it is difficult to regress from a wrong value. Another interesting thing is the charging and discharging of the vehicle during operation. The behavior will jump around. Let’s expand here:
1) Initial SOC: Due to the self-discharge and leakage current of the entire battery pack, single cell, module and even the entire pack, the real SOC will drift when parked for a long time in this mode.
2) Capacity: In fact, according to the concept we know now, if it comes out directly like the one in South Korea, the capacity of the battery will be offset from the factory to the vehicle. Even if the capacity is divided, it will change after a while.
3) Accumulation of errors and sudden errors: Senior Lin showed me a picture. It was a problem in the actual operation of a certain car. The SOC of the whole package was working at about 20%. gone back. If the accumulation of errors cannot be corrected in time, you will be faced with a dilemma, overdraft the monomer and go home with Limp home, or directly tow the car home/
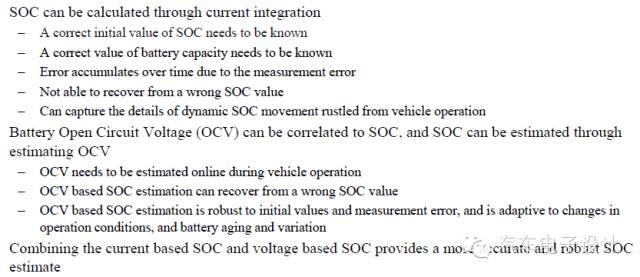
Operates in OCV corrected mode. The basic concept here is that OCV corresponds to the calculation of SOC, which can be separated from the initial value and the accumulated error of the measurement, so their core idea is to set the ratio to fuse the two reference values.
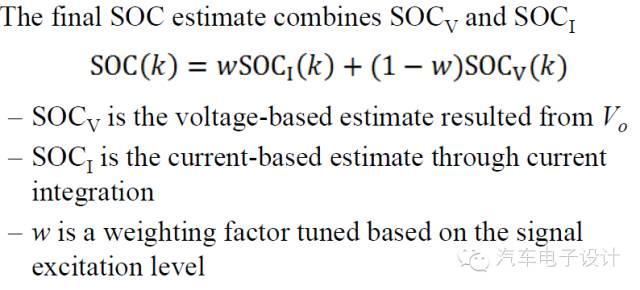
Of course, it can also be said that OCV is used to correct, no matter who it is, the overall approach is similar.
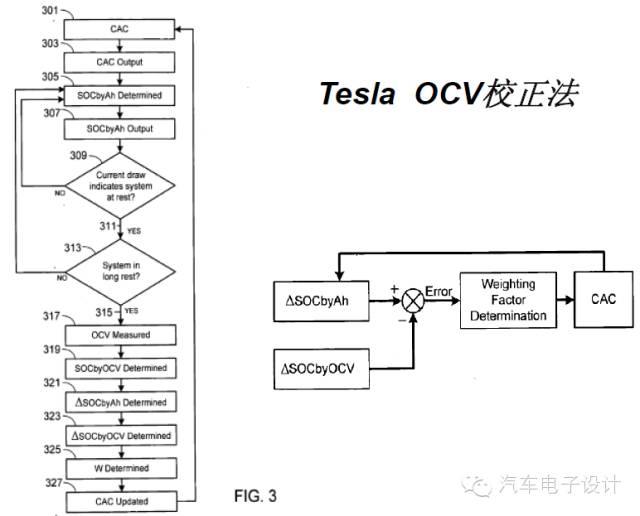
The difference in the overall steps is not much, lies in the correction method of OCV
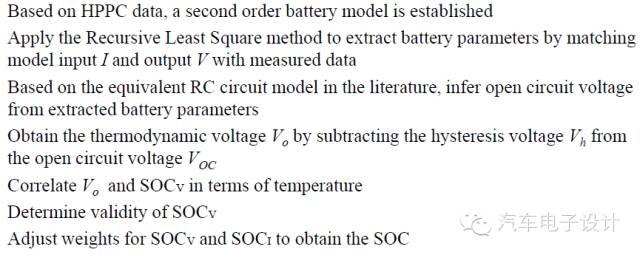
1) Based on HPPC data, build a second-order model
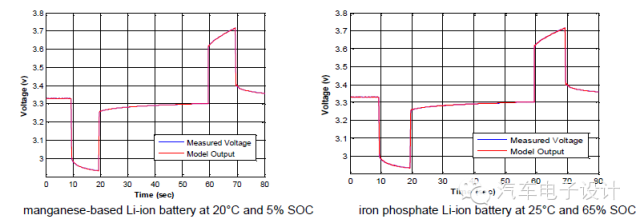
2) Adjust the model parameters through the recursive least square method, by comparing the input and output of the model with the actual result value of the measurement
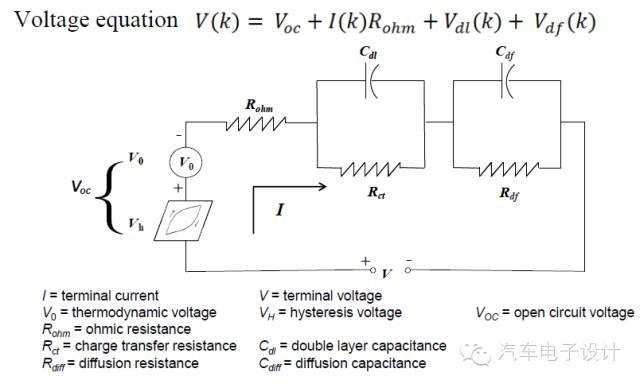
3) Obtain OCV through the equivalent RC model
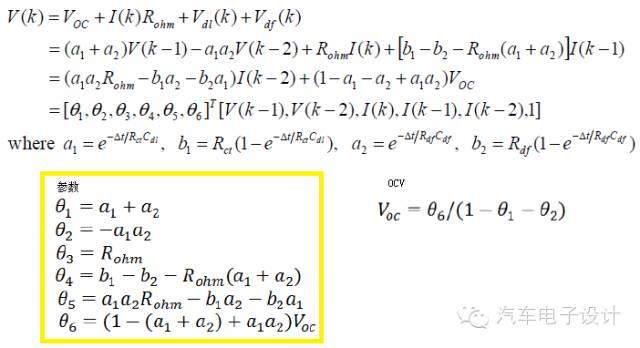
4) Separate the temperature dynamic voltage (Vo) of the battery from Voc, where the hysteresis voltage (Vh) needs to be removed
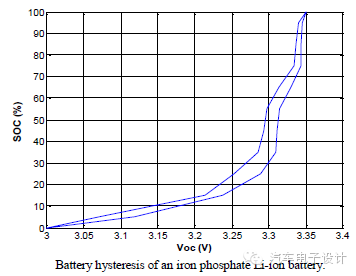
5) Correct the temperature corresponding to Vo and SocV
6) Finally decide on the weights

Reference is as follows
- Online real-time estimation of the battery parameters of the battery pack to accurately estimate the SOC of the battery pack,
- It can correct the error of more than 10% of the initial SOC and the error of more than 20% of the ampere-hour capacity in a short time
- Current measurement errors of several percent can be corrected.
Algorithms maintain estimation accuracy over the life of the battery
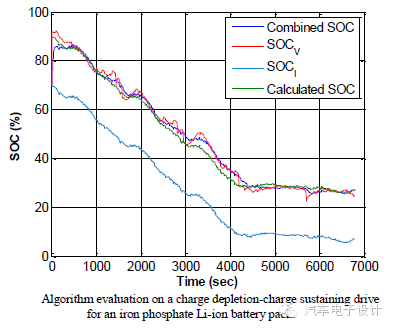
Model-based considerations are definitely necessary. For Kalman filtering, there are still requirements for the operation speed of the MCU.
If the OCV-SOC curve is to be used for correction, the static specification between the entire test needs to be matched with the clock of the following BMS
As Xiaoyu said before:
The SOC-OCV curve is a very important curve for our battery in the SOC calibration process. Usually, after the electric vehicle has been running for a period of time, before the vehicle is stationary and restarted, the BMS will call this curve to correct the SOC value once, and An SOC value update is obtained through a certain algorithm and other correction coefficients, so the accuracy of this curve is particularly important, which may be directly related to the SOC accuracy. Under the severe polarization of the battery, it is obvious that the battery has not reached an absolute steady state, that is to say, the first standing time is not long enough, and the second current between each SOC range adjustment is not small enough. But will there be an absolutely long standing time in the actual working condition, so this actually leads to another question, what kind of SOC-OCV curve do we want, combined with the actual working condition?
A current of 0.05C per 5% SOC, 12 hours of rest time, is considered a very close to steady state test method
In the latest one, if we use the K value to estimate the steady state, it will take about 20 hours for the K value to stop going up, and it will enter the steady state after 40 hours.
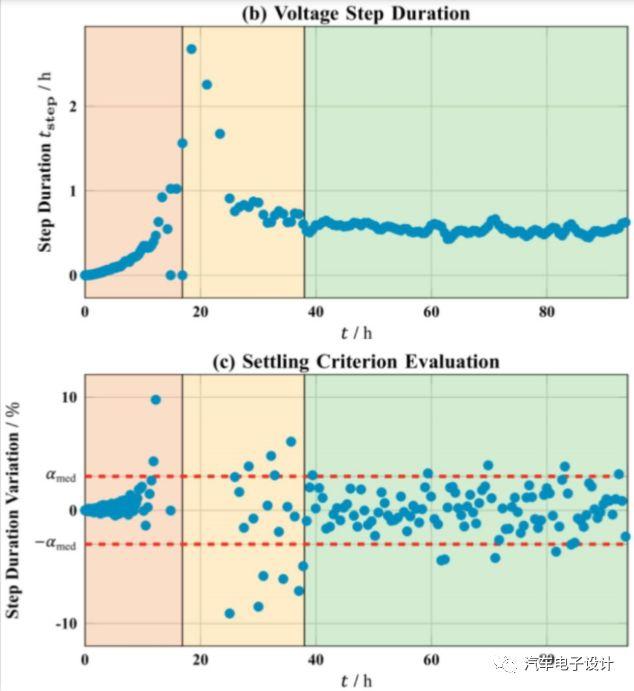
The timing of the second part of the correction (should wait for enough rest time to confirm the temperature)
The main problem of the SOC algorithm is that the SOC algorithm needs to know the initial SOC and the capacity of the battery. During the calculation process, due to the measurement error (the error of the V, I and T acquisition parameters) will accumulate, from a wrong value above. It’s hard to get back:
1) Initial SOC: Due to the self-discharge and leakage current of the entire battery pack, single cell, module and even the entire pack, the real SOC will drift when parked for a long time in this mode.
2) Capacity: The capacity of the battery cell is currently not measured, and it is controlled by sampling. The consistency of the capacity is completely handed over to the consistency of the previous raw materials and the production process.
3) Accumulation of errors and sudden errors: After working for a period of time, the benchmark may cause a large deviation due to the load of the algorithm.
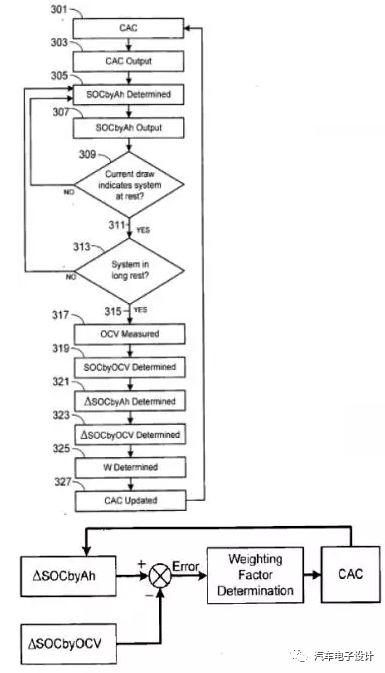
The temperature and time span we use need to match the above, otherwise the resting time is wrong and the voltage will change. At the same time, this data needs to be adjusted according to the minimum and maximum SOC at the time, as well as the correction situation.
Part III Drift of OCV-SOC curve after capacity change
The calibration data of fast charging conditions under certain harsh conditions, the battery is a certain energy-type battery, it can be seen that the data of BOL, about 500 large circles and about 1000 large circles were intercepted in the period of the test span of about one year:
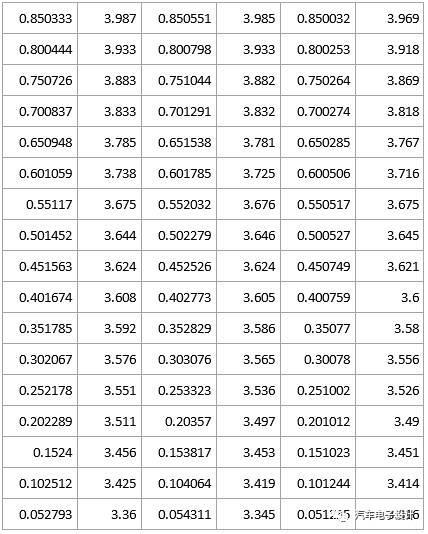
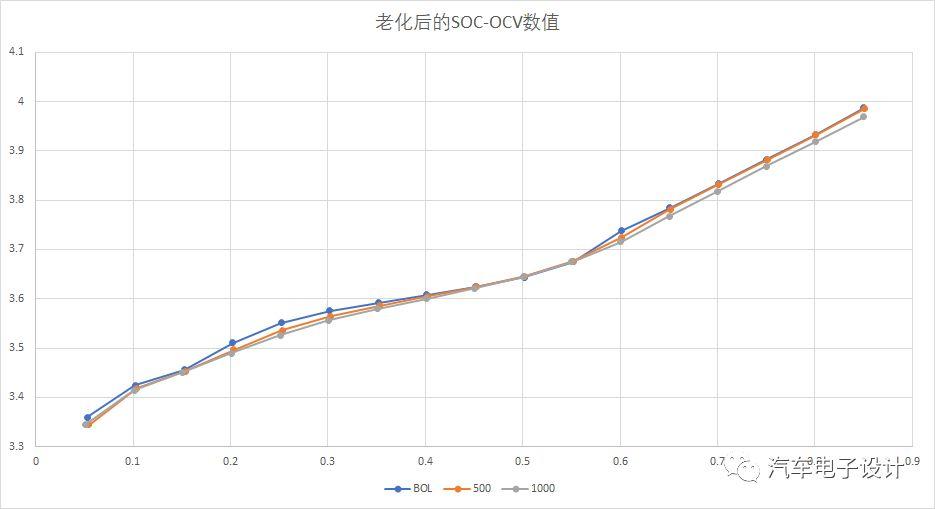
From the above table, we can clearly see the trend of change,
- At the same SOC point, the OCV value tends to decrease gradually.
- From BOL to 1000 laps, each SOC calibration point is reduced by about 10-30mv, and even some SOC points are reduced by nearly 40mv
What is the cause of the OCV drift of some batteries? In fact, these drifts are often accompanied by the capacity attenuation of the battery itself, and the capacity attenuation actually reflects that the positive electrode material of the battery itself may have been partially deactivated, and this This situation may be more pronounced in Li-rich manganese-based cathode materials, because this material may change from a layered structure to a spinel-like structure at the later stage of cycling due to its own poor stability, eventually leading to a voltage plateau. The change. This trend may not be so obvious for other more stable cathode materials.
If we pursue a high-capacity structure later, most of the material changes will cause a drift in the OCV curve after 10% and 20% decay. Different from the experiment done by Xiaoyu above, we need to compare the attenuation according to different attenuation, that is, the attenuation of Fast charging or DST depletion mode, and then compare the difference in OCV.
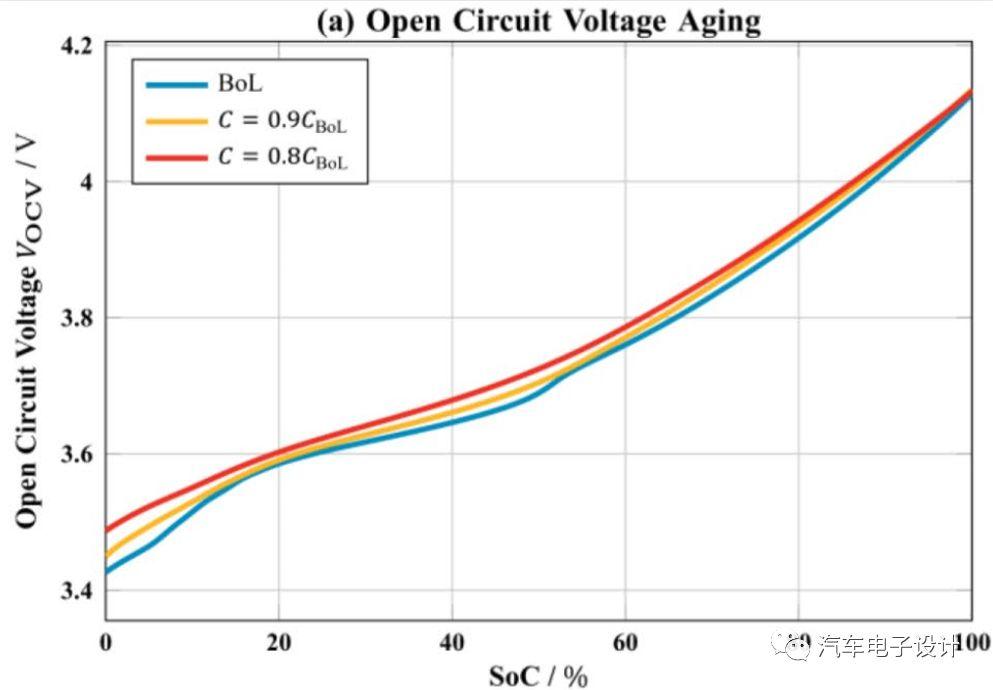
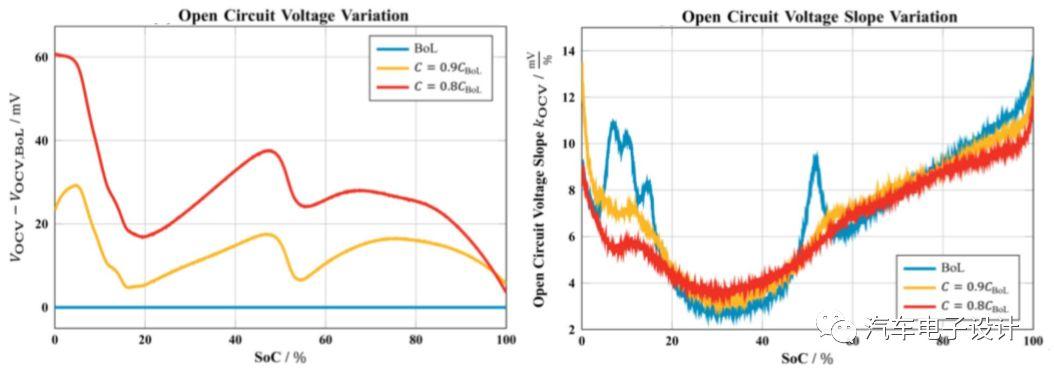
Summary: If you want to get through the data testing, verification and algorithm modeling and use of the entire link, there is a long way to go. To ensure that the characteristics of the entire life cycle are good, it takes a lot of effort.
reference document:
1) “Li-Ion Battery State Estimation and Prognosis” MutasimSalman, XidongTang and Xiaofeng. Mao
2) “Li-ion Battery Parameter Estimation for State of Charge” by Xidong Tang, Xiaofeng Mao, Jian Lin, and Brian Koch
3) US20110309838 “APTIVE BATTERY PARAMETER PXTRACTION AND SOC ESTIMATION FOR ITHIUM’ION BATTERY”
4) US20090091299 “DYNAMICALLY ADAPTIVE METHOD FOR DETERMINING THE sTATE OF CHARGE OF A BATTERY”
Source: Zhihu www.zhihu.com
Author: Zhu Yulong
[Zhihu Daily] The choice of tens of millions of users, to be a big cow to share new things in the circle of friends.
click to download
There are 47 more answers to this question, see all.
Further reading:
How many kilometers will the final range of electric vehicles used by families be more appropriate?
This article is reproduced from: http://www.zhihu.com/question/24778938/answer/2525327698?utm_campaign=rss&utm_medium=rss&utm_source=rss&utm_content=title
This site is for inclusion only, and the copyright belongs to the original author.