#Zhu Shaoxing: There is no point in being overly pessimistic about the market.# #雪ball star plan public offering talent#
Q: The stock market is turbulent, how to choose a bond fund?
Facts, a book on how to avoid emotional decision-making, written by Swede Hans Rosling, has since sold in 20 countries. The author believes that only by recognizing emotional instincts can we get rid of irrational troubles. In work and life, we should use as effective data as possible to approach the truth and let the data speak for itself.
The commander felt that investment should be even more so. Whether it is a bear market in the “bottom-seeking” or a bull market in the “flying” period, we should not play the game with emotions, but should pay attention to the combination of two types of assets, stocks and bonds, and flexibly adjust the positions of the two Proportion. In this way, investment can attack and defend freely.
Among several types of pure debt funds, medium and long- term pure debt funds have the distinctive features of “lower risk and stable income”, and are an important variety for allocating low-risk assets. Wind data shows that as of April 16, 2022, the average annualized rate of return of the medium and long-term pure debt fund index (885008.WI) since 2013 was 4.9%, and the annualized Sharpe ratio was 2.1. Among various funds, Sharpe The ratio is much higher than other types of funds (except currency funds); the cumulative return in the past three years is 11.3%, the maximum drawdown is 1.7%, and the risk-return ratio indicator is also better.
So, when we usually choose medium and long-term pure debt funds, what effective historical data should we focus on? Today, the commander will teach you how to quickly select excellent medium and long-term pure debt funds from 4 simple and easy-to-understand indicators.
Indicator 1: High annual win rate
Judging from the historical performance of the bond market, in the past ten years, there have been three times of poor annual yield performance. In mid-2013, due to the unexpected tightening of the central bank, the yield of government bonds continued to rise, resulting in a general decline in bond prices. The yield of bond fund index was only 0.97% that year; Affected by events such as holding default and other events, the overall performance of bond funds was also poor, up 0.39% and 2.01% respectively. As a stable medium-to-long-term pure bond fund, it should at least be able to achieve positive returns regardless of whether the bond market is in a bull market or a bear market.
Indicator 2: Controlled retracement is excellent
Why should investors allocate bond assets? Mainly feel that the risk is low, but also hope that the long-term yield can outperform CPI inflation. Therefore, when most investors choose bond funds, in addition to the pursuit of performance yield, they actually pay more attention to the performance of drawdown control. If there are two bond funds, one with a historical annualized rate of return of 10% and a maximum drawdown of 3%; the other with a historical annualized rate of return of 8% and a maximum drawdown of 1.5%, I believe most people will prefer the latter.
Indicator 3: Average annualized high
After comparing the above two indicators, let’s compare the historical annualized rate of return. It should be noted that when comparing the average annualized rate of return, try to place the same time dimension as much as possible, rather than making a comparison based on the product’s inception. Commander also analyzed it just now. The bond market in 2013, 2016, and 2017 was generally poor. If bond fund A was established on February 14, 2013, and bond fund B was established on June 14, 2016, it would be compared to 2017. Average annualized rate of return over the five-year period from 2021.
Indicator 4: Proportion of high volatility assets
Finally, let’s compare the proportion of high-band assets. Senior Christians know that, in addition to bond duration, credit risk level, bond leverage and other factors, convertible bonds and even a small amount of stocks (such as secondary bond bases/hybrid bond bases) can also be configured to affect the yield performance of bond funds. Generally speaking, if the total allocation of stocks and convertible bonds is less than 5%, it can also be regarded as a broad-based pure bond fund. Therefore, when choosing a medium and long-term pure debt fund, you may wish to compare the proportion of high-volatility assets to better match your risk-return ratio.
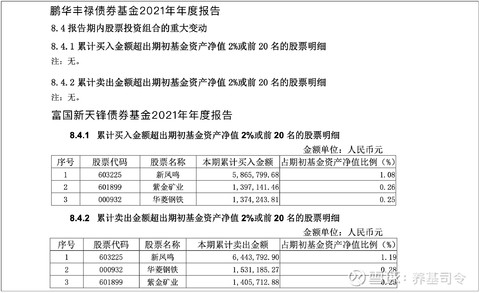
For example, in the figure below, the 2021 annual report of Penghua Fenglu Bond Fund shows that the stock investment portfolio accounted for 0% during the reporting period; while the Fuguo Xintianfeng Bond Fund, the cumulative purchase amount in 2021 exceeded the initial fund NAV by 2% or The top 20 stocks, including Xinfengming, Zijin Mining, and Valin Steel, accounted for 1.59% of the fund’s net asset value at the beginning of the period, and the cumulative sold or top 20 stocks accounted for 1.73% of the net value at the beginning of the period. It is also a medium and long-term debt base, and the proportion of high-volatility assets of Wells Fargo Xintianfeng is slightly higher.
Small Tips: Allocating a very small amount of high volatility assets does not mean that the drawdown control is necessarily bad, but it will increase the yield elasticity of bond funds.
In addition to the above two excellent pure debt funds, Commander then selects several high-quality medium and long-term pure debt funds for reference based on the above four simple and easy-to-understand indicators, and let’s take a look at their historical risk-return characteristics. The following data sources: Choice, Fund Annual Report; if there are multiple types of shares, take Class A as an example, data as of: April 21, 2022.
Penghuafeng Rong Debt (000345)
Established on November 19, 2013, it is a one-year regular open fund, and the next open period is from April 25 to April 29, 2022. The 8 full years since its establishment have been positive returns. The annual returns from 2014 to 2021 are: 10.54%, 9.37%, 2.92%, 4.81%, 16.79%, 11.29%, 5.80%, 4.91%, and the average return rate is 8.30%. The largest drawdown in the past five years is 0.71%, and the return ratio in the past year is 14.72. 2021: Convertible bonds account for 1.51% of the fund’s net asset value, and stock portfolio accounts for 0%.
China Merchants Industrial Bond A (217022)
Founded on March 21, 2012, it has had positive returns for 9 full years since its establishment, of which the annual returns from 2014 to 2021 are: 21.42%, 11.85%, 4.17%, 3.02%, 8.64%, 6.71%, 4.17% , 6.50%, and the average yield is 8.31%. The largest drawdown in the past five years is 1.39%, and the return ratio in the past year is 15.07. 2021: Convertible bonds account for 0.35% of the fund’s net asset value, and stock portfolio accounts for 0%.
GF Pure Debt Bond A (270048)
Established on December 12, 2012, it has had positive returns for 9 full years since its establishment, of which the annual returns from 2014 to 2021 are: 19.24%, 15.32%, 0.88%, 1.79%, 6.57%, 2.63%, 4.46% , 5.72%, with an average yield of 7.08%. The largest drawdown in the past five years is 1.87%, and the return ratio in the past year is 8.22. 2021: Convertible bonds account for 0% of the fund’s net asset value, and stock portfolio accounts for 0%.
Morgan Stanley Enhanced Bond A (000024)
Founded on March 26, 2013, it has had positive returns for 8 full years since its establishment. The annual returns from 2014 to 2021 are: 14.53%, 11.54%, 3.95%, 2.01%, 6.32%, 5.94%, 6.33%, 3.82%, with an average yield of 6.80%. The largest drawdown in the past five years is 0.77%, and the return ratio in the past year is 5.43. In 2021: convertible bonds account for 1.42% of the fund’s net asset value, and the stock portfolio accounts for 0%.
Galaxy Leading Bond (519669)
Founded on November 29, 2012, it has had positive returns for 9 full years since its establishment, of which the annual returns from 2014 to 2021 are: 14.25%, 12.41%, 3.16%, 4.55%, 6.82%, 4.16%, 3.85% , 4.55%, and the average yield is 6.72%. The largest drawdown in the past five years is 1.22%, and the return ratio in the past year is 8.36. 2021: Convertible bonds account for 1.29% of the fund’s net asset value, and stock portfolio accounts for 0%.
Well, combining the above 4 simple and easy-to-understand indicators, you can choose a high-quality pure debt fund. Have you learned it? Given enough time, every little grass can grow into a towering tree. The same is true for the road to wealth. Don’t be in a hurry for quick success. When the stock market is not good, you will develop vulgarly.
Welcome to pay attention to “Chief Commander”, fund investment is no longer confused! Always insist on speaking with data, and explain in simple terms the investment skills of various funds. Still water flows deep, not fast and fast! @Today’s topic @snowball creator center @snowball fund $ China Merchants Bank (SH600036)$ $ Ningde Times (SZ300750)$ $ Sunshine Power (SZ300274)$
It is not easy to organize data, please remember to like and support. Fund investment needs to be cautious, and the content and opinions are for reference only. The past performance of the fund does not represent the future. Please read the legal documents of the fund carefully before purchasing and choose the product that suits you. If you have any questions, the microphone will be handed over to you to get high~~
This topic has 1 discussion in Snowball, click to view.
Snowball is an investor’s social network, and smart investors are here.
Click to download Snowball mobile client http://xueqiu.com/xz ]]>
This article is reproduced from: http://xueqiu.com/8092949786/217833341
This site is for inclusion only, and the copyright belongs to the original author.