Original link: https://leovan.me/cn/2023/07/what-i-talk-about-when-i-talk-about-photography-colors-part-1/
color gamut
When I talk about retouching, what do I talk about – Color Part 1 has already introduced what is a color space . In the field of display , the RGB color model is usually used, and in the printing field , the CMYK color model is usually used. In the field of color perception , the CIE 1931 color space is a standard color space that is required to include all colors visible to the ordinary human eye from the beginning of design.
Human eyes have photoreceptor cells for short, medium, and long wavelengths. When describing colors, color space can define three stimulus values, and then use the superposition of values to represent various colors. In the CIE 1931 color space, these three stimulus values do not refer to responses to short, medium, and long waves, but rather a set of X, Y, and Z values that roughly correspond to red, green, and blue. The X, Y, and Z values don’t really look like red, green, and blue, but are calculated using the CIE XYZ color matching function.
In the color matching experiment , as shown in Figure 1 below:
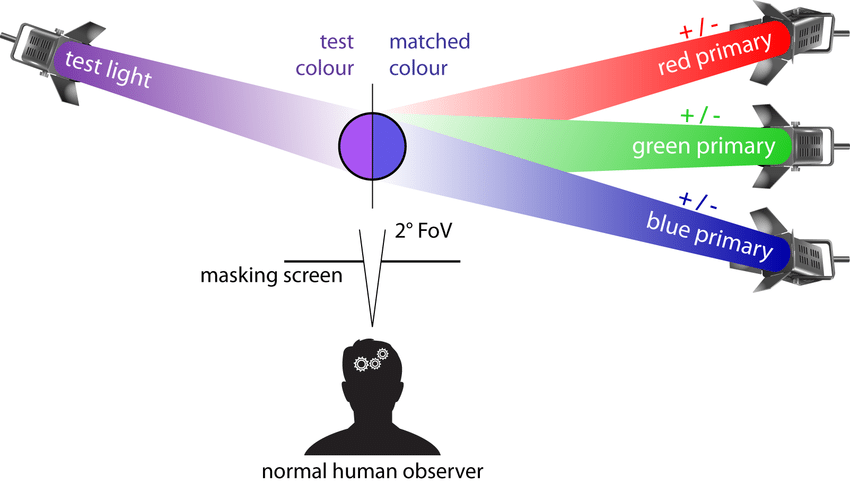
By observing whether the color of the single light source and the mixed color of the three primary color light sources are the same, the subjects obtained the spectral tristimulus value curve as shown in the left of Figure 2 below. In order to eliminate the inconvenience of data processing caused by negative values, the curves of three new values $X$, $Y$ and $Z$ are obtained through conversion, as shown in the right of Figure 2 below.
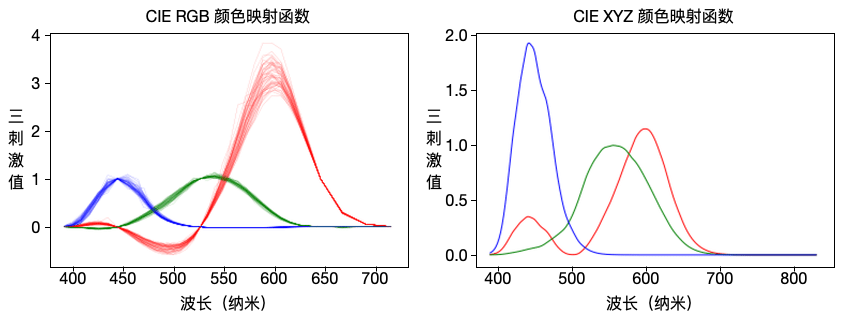
In the CIE 1931 color space, the full map of all visible colors is three-dimensional, and $Y$ can represent the lightness of a color3 . The advantage of $Y$ representing lightness is that when a value of $Y$ is given, the XZ plane will contain all the chromaticities under this lightness. By normalizing the values of $X$, $Y$ and $Z$:
$$ \begin{aligned} x &= \dfrac{X}{X + Y + Z} \\ y &= \dfrac{Y}{X + Y + Z} \\ z &= \dfrac{Z}{X + Y + Z} = 1 - x - y \end{aligned} $$
Chromaticity can be expressed using $x$ and $y$. The relative chromaticity diagram 4 of CIE 1931 is shown below:
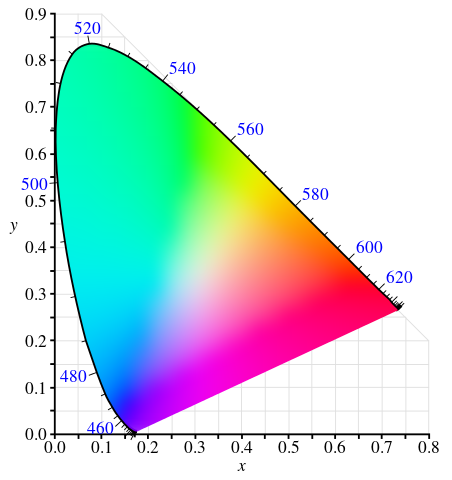
The outer curved borders are spectral traces, with wavelengths labeled in nanometers. The comparison between different color gamut (Color Gamut) standards is shown in Figure 5 below:
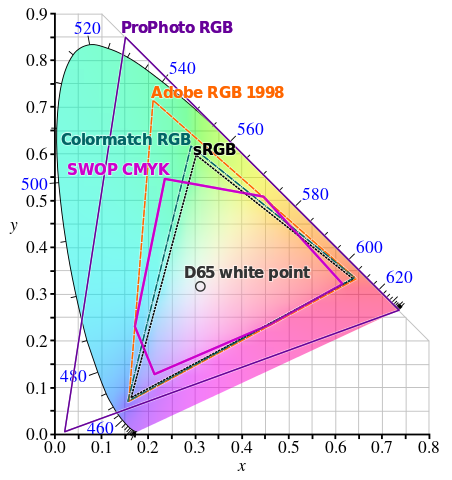
It is impossible for a display device to produce colors beyond its gamut. Usually, it doesn’t make sense to discuss the color gamut of a photographic device, but what kind of color space is used for encoding needs to be focused.
color depth
Color depth , referred to as color depth (Color Depth), is the number of bits required to store the color of a pixel. If the color depth is $n$ bits, it means that there are $2^n$ colors in total. For example, the true color we often say is 24 bits, corresponding to three channels of RGB, each channel has 8 bits (ie 0-255), and can represent 16,777,216 colors in total.
24bit (98KB)
8bit (37KB -62%)
4bit (13KB -87%)
2bit (6KB -94%)
It is not difficult to see from the comparison in Figure 6 above that the greater the color depth, the better the effect of the image, the more natural the transition between image contents, and the more storage it takes up.
In video shooting, what we usually say 8bit and 10bit refers to bit depth (Bit Depth), that is, the number of bits per channel. When the device is shooting material, recording information with a larger number of bits will be more conducive to post-processing such as color correction.
In the characteristics of the display, we often encounter 8bit and 10bit, as well as the concept of 8bit FRC. FRC is the abbreviation of Frame Rate Control , that is, frame rate control , which is a pixel dithering algorithm in the time dimension. Take a grayscale image as an example, as shown in the figure below, when rendering an image that contains multiple frames, the frames can be switched between light and dark to produce an intermediate grayscale.
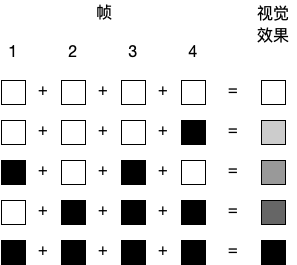
The pixel dithering algorithm ( Dither ) of the corresponding spatial dimension is shown in the following figure:
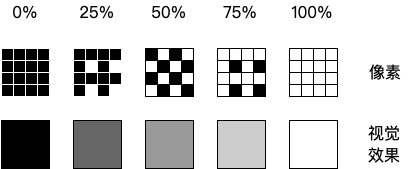
So, a native 10bit screen is better than 8bit FRC 10bit screen is better than native 8bit screen.
Chroma Sampling
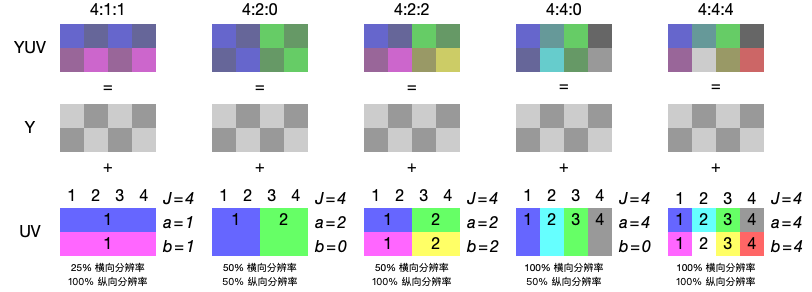
When shooting video, in addition to the difference between 8bit and 10bit bit depth, we often hear the ratio values of 4:2:2 and 4:2:0, which means chroma subsampling . Since the human eye is not as sensitive to chroma as it is to luminance, the chrominance component of an image does not need to have the same clarity as the luminance component. Sampling on chrominance can reduce the image signal without significantly reducing the picture quality. total bandwidth.
Sampling systems are usually represented by a three-point ratio: $J : a : b$, where:
- $J$ is the horizontal sampling width
- $a$ is the number of chrominance samples in the first row of $J$ pixels
- $b$ is the sampling number of chroma in the second line $J$ pixels
Different ratio chroma sampling comparisons are shown in Figure 7 as follows:
Dynamic Range
Dynamic Range ( Dynamic Range ) is the ratio of the maximum and minimum values of a variable signal (such as sound or light). In a camera, setting different ISOs will affect the noise performance of the dynamic range when recording highlights and shadows.
High Dynamic Range ( High Dynamic Range , HDR ) has a larger dynamic range than Standard Dynamic Range ( Standard Dynamic Range , SDR ). In short, HDR can make the bright places in the picture bright enough and the dark places dark enough . HDR needs to be supported by the acquisition device and the display device at the same time to be able to display normally. Figure 8 below shows the process of HDR and SDR from scene acquisition to display restoration:
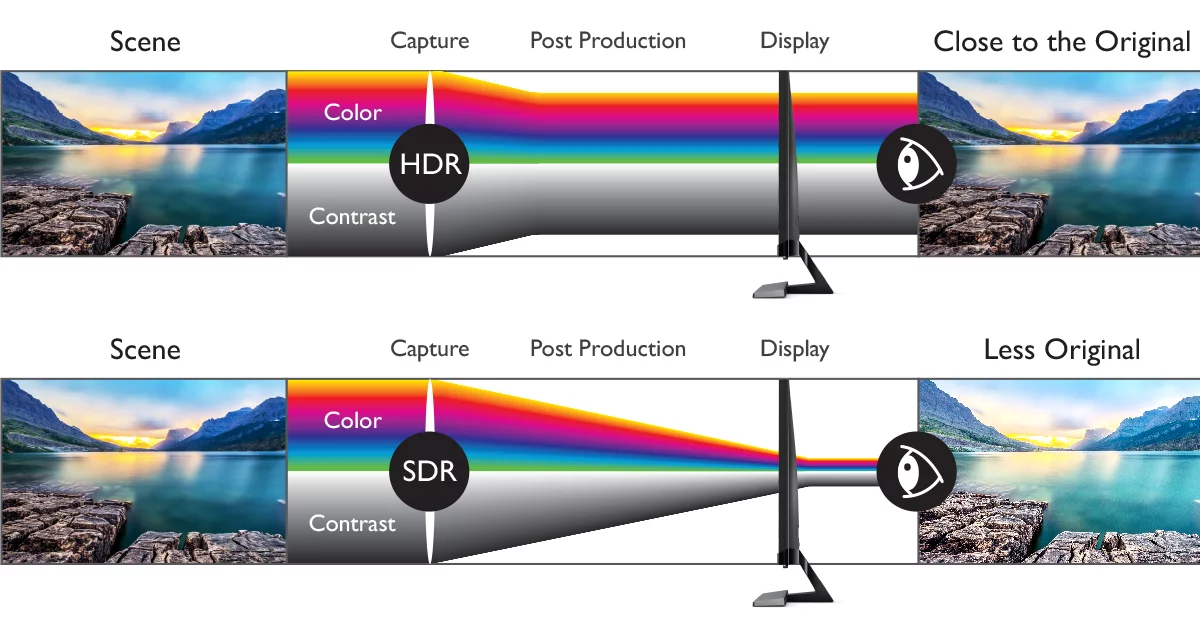
The difference between the final SDR and HDR imaging is shown in Figure 9 below (simulation effect):


During the photography process, there are two ways to get good HDR photos:
- For RAW format photos, there are enough different light and shade data stored in it. For high light, reduce some exposure and increase some exposure for dark parts to obtain HDR photos.
- Exposure bracketing is performed in the early stage, that is, multiple photos with different exposure compensations are taken at the same time when shooting, and an HDR photo is obtained by exposure synthesis technology in the later stage.
During the shooting process, the above two solutions become infeasible. If the RAW information is saved for each frame of the video, the size of the video material will be too large. At this point, we will use a method called Log curve to process each frame of the video.
First of all, we need to understand what is exposure ( Photometric Exposure ) and exposure value ( Exposure Value , EV ). Exposure refers to the amount of light entering the lens on the photosensitive medium, which is controlled by the combination of aperture, shutter and sensitivity, defined as:
$$ H = Et $$
Among them, $E$ is the illuminance of the image plane, and $t$ is the exposure time of the shutter. The image plane illuminance is proportional to the aperture area of the aperture, so it is inversely proportional to the square of the aperture $f$ value, then:
$$ H \propto \dfrac{t}{N^2} $$
Among them, $N$ is the $f$ value of the aperture. $\dfrac{t}{N^2}$ This ratio value can be used to represent multiple equivalent exposure time and aperture $f$ value combinations. This ratio has a larger denominator, and for convenience inverting the ratio and taking the logarithm to the base $2$ gives the definition of the exposure value :
$$ EV = \log_2{\dfrac{N^2}{t}} = 2 \log_2{\left(N\right)} - \log_2{\left(t\right)} $$
In reality, as the light intensity (analog exposure) doubles , the human eye ‘s sensitivity to light (analog exposure) increases roughly linearly . At the same time, the recording of the light intensity by the camera is linear, that is to say, when the light intensity doubles, the value stored after conversion will also double.
Taking 8bit as an example, 128 bits are used to store relevant information for the highlight part (7-8 exposure values), while only 8 bits are used to store relevant information for the dark part (0-1 exposure value), as shown on the left of the figure below. At this time, because the brightness of the highlight part does not seem to change much, the number of storage bits used is much more than that of the dark part. This kind of unbalanced storage is easy to lose the details of the dark part of the image. By performing Log processing on the exposure, a balanced corresponding relationship can be obtained, as shown on the right of the figure below.
EV and Exposure Level Relationship
EV and exposure $\log$ value relationship
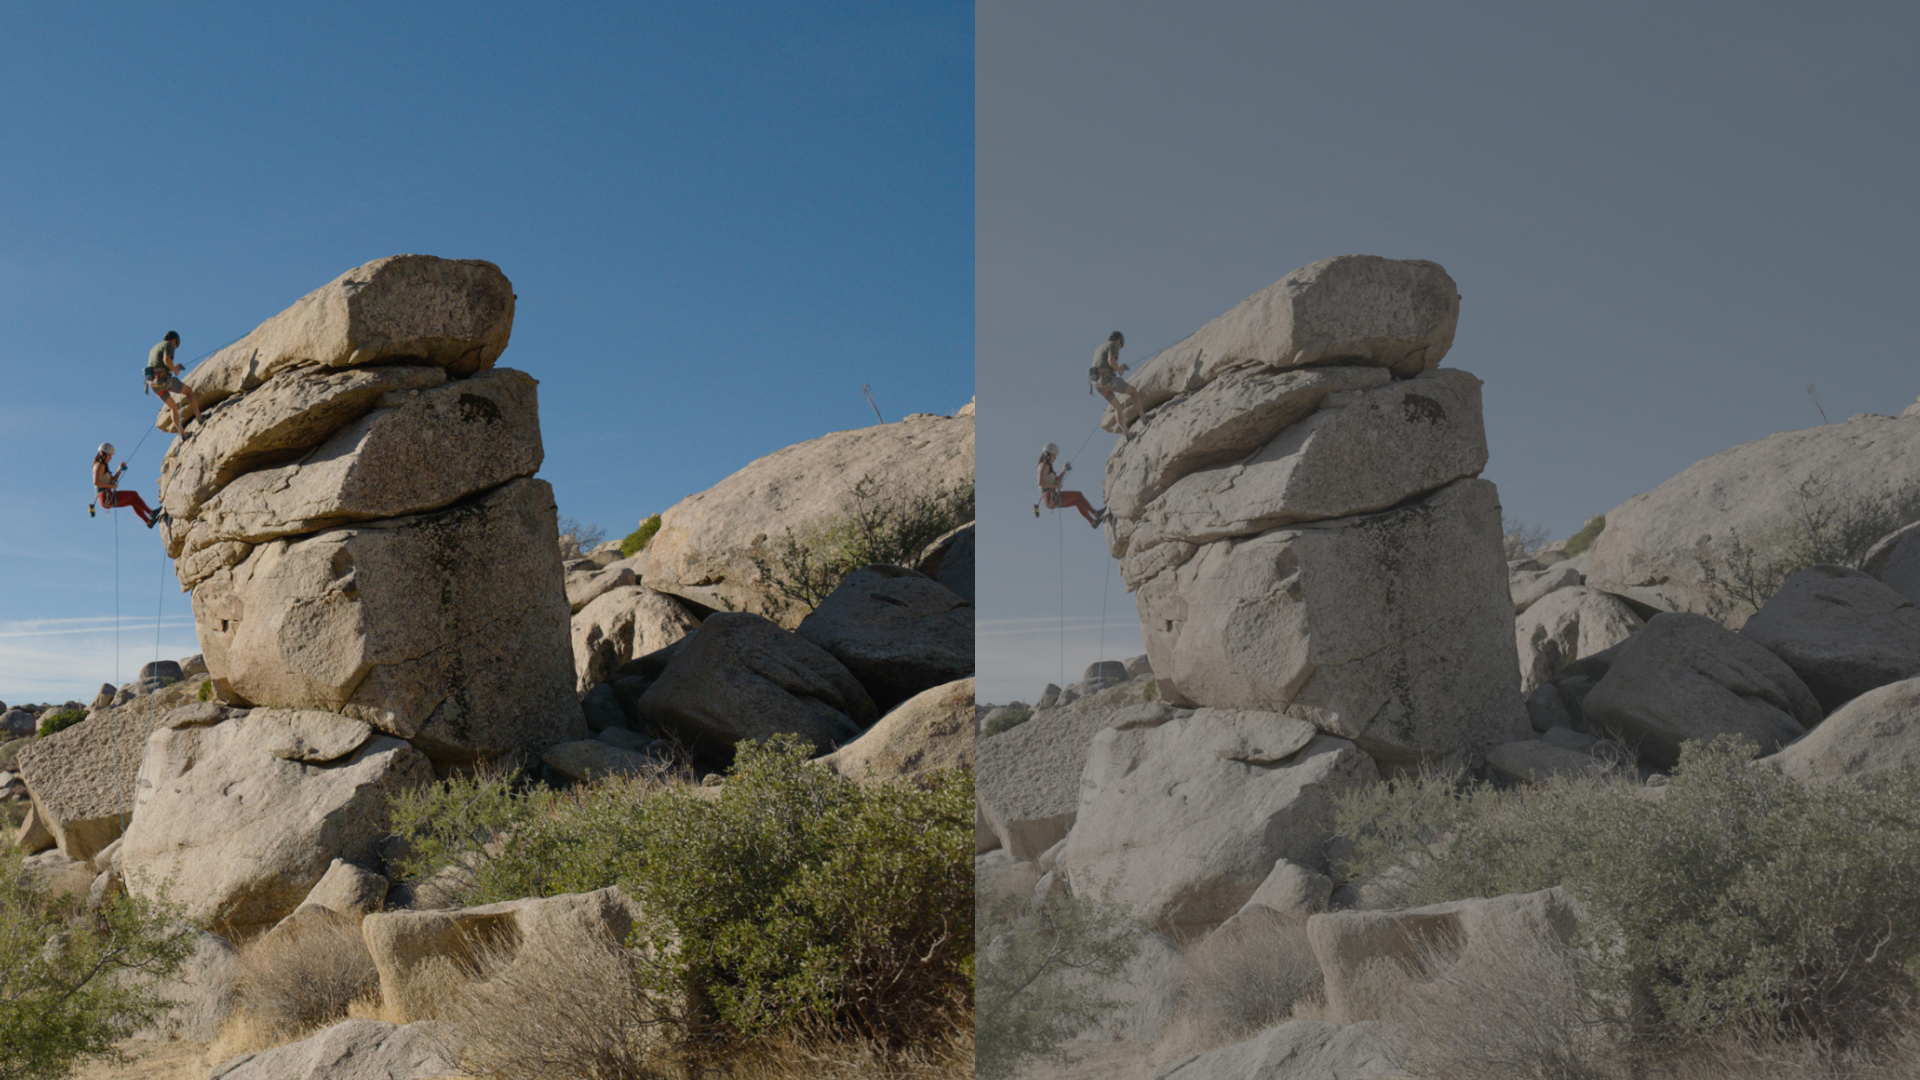
In real scenes, the Log curves carried by various camera manufacturers are not exactly the same, and they will be adjusted and modified to achieve a certain effect. But generally speaking, the purpose is to make the amount of information stored between each exposure value roughly the same. The comparison image 10 after color correction and the original applied Log curve is shown below:
-
Verhoeven, G. (2016). Basics of photography for cultural heritage imaging. In E. Stylanidis & F. Remondino (Eds.), 3D recording, documentation and management of cultural heritage (pp. 127–251). Caithness: Whittles Publishing .
 ︎
︎ -
Patrangenaru, V., & Deng, Y. (2020). Nonparametric data analysis on the space of perceived colors. arXiv preprint arXiv:2004.03402.
 ︎
︎  ︎
︎ -
https://en.wikipedia.org/wiki/CIE_1931_color_space#Meaning_of_X,_Y_and_Z
 ︎
︎ -
https://commons.wikimedia.org/wiki/File:CIE1931xy_blank.svg
 ︎
︎ -
https://commons.wikimedia.org/wiki/File:CIE1931xy_gamut_comparison.svg
 ︎
︎ -
https://www.benq.com/en-my/knowledge-center/knowledge/what-is-hdr.html
 ︎
︎ -
https://kmbcomm.com/demystifying-high-dynamic-range-hdr-wide-color-gamut-wcg/
 ︎
︎ -
https://postpace.io/blog/difference-between-raw-log-and-rec-709-camera-footage/
 ︎
︎
This article is transferred from: https://leovan.me/cn/2023/07/what-i-talk-about-when-i-talk-about-photography-colors-part-1/
This site is only for collection, and the copyright belongs to the original author.