introduction
Japanese candlestick chart is a kind of chart that can clearly describe the price of the stock in each period of time, and it is often used to analyze the trend of the stock.
In today’s article, I mainly introduce the basic knowledge of Japanese candlestick charts. After understanding these, you can quickly understand the trend of stock prices.
basic introduction
- Use
>for higher than and<for lower than
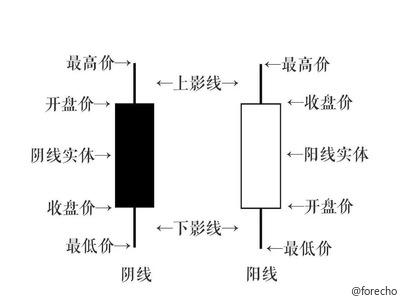
Solid candle (falling)
Features of candles:
- solid entity
- The opening and closing price of the physical section at a specific time, with the opening price on the top and the closing price on the bottom
- When the opening price
>the closing price, the stock falls.
hollow candle (up)
Features of candles:
- hollow solid
- The closing and opening prices of the physical section at a specific time, with the closing price on the top and the opening price on the bottom
- The closing price
>the opening price, i.e. the stock goes up.
special candle chart
Shadowless Candle
Features:
- The highest price is close to the opening or closing price
- The lowest price is close to the opening or closing price
Doji candle
definition:
- The distance between the opening and closing prices is only 20% of the overall candlestick, and we can define it as a Doji candle.
Features:
- The opening and closing prices are very close
This kind of trend generally represents a kind of uncertainty in the market, indicating that the trend of the market may change. The closer the distance between the closing price and the opening price, the stronger the reversal significance.
hammer candle
Features:
- Similar to Doji
- The opening and closing prices are relatively close
If there is an all-time high or all-time low in the Doji and Hammer candles, it is a sign of a very strong reversal.
Summarize
There are generally three ways to analyze stock price patterns:
- Simple Line Chart
- bar chart
- Japanese candlestick chart
There is no doubt that Japanese candlesticks are the most commonly used stock analysis charts today. Because it can reflect the trend of the stock more, and it is more intuitive.
After understanding the basic usage of candlestick charts, we can analyze the trend of the stock through a combination of multiple candlestick charts.
Also, we need to understand that Japanese candlestick charts are an art, not a science.
This article is reprinted from: https://blog.forecho.com/japanese-candlestick-summary.html
For personal collection only, the copyright belongs to the original author
Introduction to Japanese Candlesticks appeared first on Haowen Collection .
This article is reproduced from: https://shoucang.zyzhang.com/%E6%97%A5%E6%9C%AC%E8%9C%A1%E7%83%9B%E5%9B%BE%E7%AE%80% E4%BB%8B/
This site is for inclusion only, and the copyright belongs to the original author.