On August 19, I was honored to follow the Snowball research team to participate in the research of Qiao Liang, the manager of Wanjia Fund. The Wanjia CSI 1000 Index Enhancement (005313) managed by Qiao Liang has ranked first in the performance of the CSI 1000 Index Enhanced Fund in the past 1 or 2 years, and has performed very well.
Recently, CSI 1000 Index futures and options have been listed, and there has been a boom in the issuance of CSI 1000 Index products. Investors are paying more attention to CSI 1000 Index products. Now let me share the research content of Qiao Liang, manager of Wanjia Fund, who followed the Snowball research team. Manager Qiao Liang is the fund manager of Wanjia CSI 1000 Index Enhancement (005313) and Wanjia Quantitative Smart Selection, as well as the quantitative person in charge of Wanjia.
This article is long and mainly includes the in-depth evaluation of the enhancement of Wanjia CSI 1000 Index, the views on the development prospects of CSI 1000 Index products, the introduction of Wanjia Quantitative Smart Selection, the information sharing of this survey, etc. The focus is the enhanced in-depth evaluation of the Wanjia CSI 1000 Index.
In the analysis of index-enhanced funds, I refer to the research methods of securities companies to analyze index-enhanced funds mainly into four aspects: basic characteristics, income characteristics, position characteristics and performance attribution. Below I will mainly analyze the Wanjia CSI 1000 Index Enhanced Fund from these four aspects.
1. Basic features:
1. Fund manager background: Fund manager Qiao Liang has 15 years of experience in securities investment, a Ph.D. in business administration from Stanford University, and a master’s degree in statistics. He is currently the assistant to the general manager of Wanjia Fund Management Co., Ltd. He has served as investment director and general manager of Shanghai Xunqian Asset Management Co., Ltd., co-founder and chief investment officer of Tonglian Data Co., Ltd., fund manager of Southern Asset Management Co., Ltd., fund manager of Canadian Pension Fund International Investment Management (CPPIB), and Barclays International Investment management company (BGI) investment department fund manager and other positions.
Investment philosophy: scientific investment, cutting-edge quantification. Through scientific investment methods, use “discipline” to overcome the weaknesses of human nature, use models as a tool to explore investment opportunities, combine the specific evolution of the market, pursue long-term and stable excess returns, and provide customers with real long-term investment value.
Manager Qiao manages a variety of index-enhanced funds and quantitative funds of Wanjia Fund, with rich experience and outstanding performance.
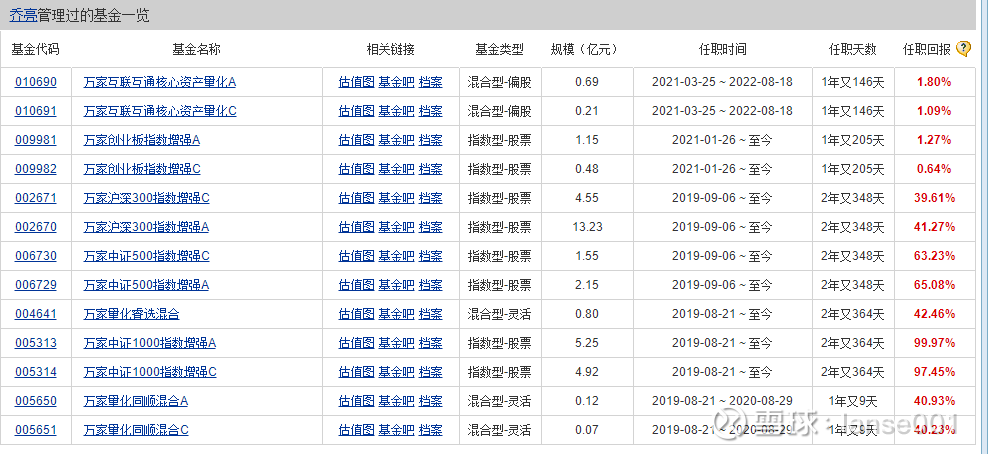
Manager Joe started to manage this fund on August 21, 2019.
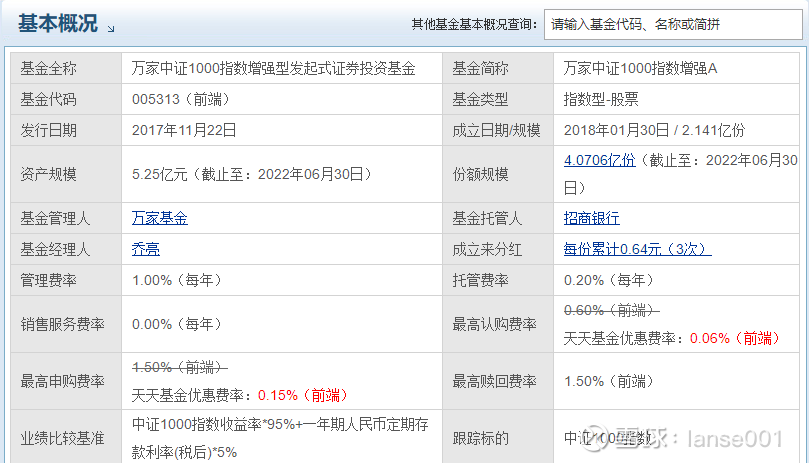
2. Tracking Index: CSI 1000 Index.
3. Historical transformation and investment strategy of the fund: Wanjia CSI 1000 was established on 2018.1.30 (2018.12.3 was transformed from Wanjiayu Bond Securities Investment Fund to this fund).
Investment strategy: The Fund is an enhanced index product. On the basis of the weight of the constituent stocks of the underlying index, it actively adjusts the industry allocation and the weight of individual stocks according to the quantitative model, and strives to obtain investment returns that exceed the underlying index on the basis of controlling the tracking error.
4. Fund fee rate: management fee rate 1.00% (annual), custody fee rate 0.20% (annual)
5. Tracking error requirements: Strive to control the absolute value of the daily average tracking deviation between the growth rate of the fund’s net value and the performance comparison benchmark to not exceed 0.5%, and the annual tracking error to not exceed 7.75%.
6. Proportion of investment in index constituent stocks: The fund’s stock assets account for no less than 80% of the fund’s assets, and the proportion of investment in the underlying index constituent stocks and its alternative constituent stocks is no less than 80% of the non-cash fund assets;
7. Performance benchmark and investment portfolio ratio: Performance benchmark: CSI 1000 Index yield * 95% + one-year RMB time deposit interest rate (after tax) * 5%.
The fund’s stock assets account for no less than 80% of the fund’s assets, and the proportion of investment in the underlying index constituent stocks and their alternative constituent stocks is no less than 80% of the non-cash fund assets;
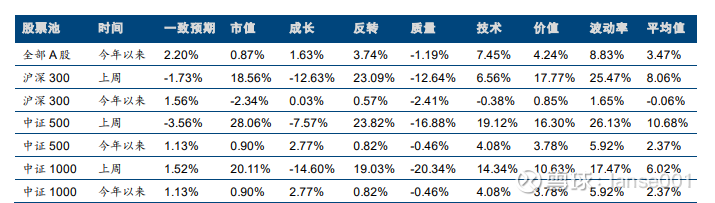
7. See the figure below for other basic information;
Second, income characteristics (that is, the performance that investors are most concerned about):
1. Excessive income:
a. Compared with the performance benchmark:
The performance benchmark is CSI 1000 Index yield * 95% + one-year RMB time deposit interest rate (after tax) * 5%.
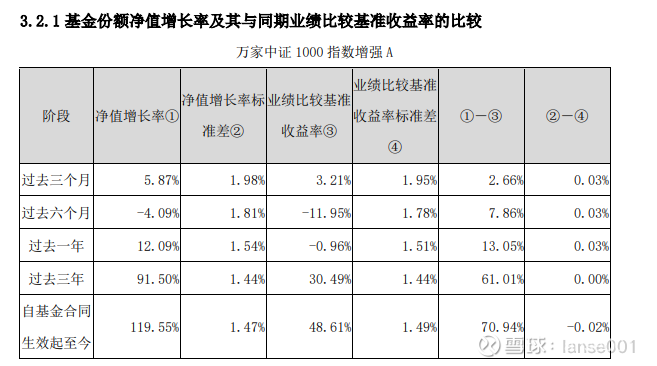
Since the fund took effect to 2022.6.30, it has increased by 119.55%, significantly outperforming the performance benchmark by 70.94%.
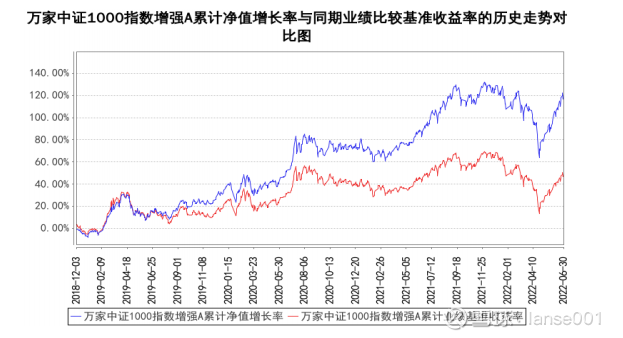
b. Compared with the tracking index (I use the CSI 1000 Total Return Index):

Since the fund took effect to 2022.6.30, the increase has reached 130.56%, which greatly outperformed the CSI 1000 Total Income Index by 68.88%. (China Securities 1000 Total Income Index rose 61.68%)
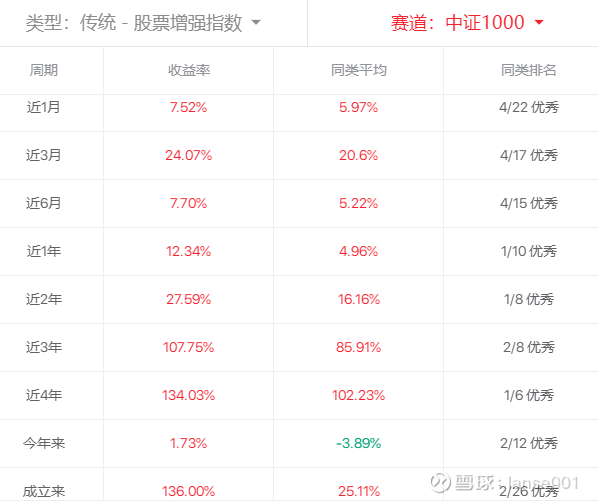
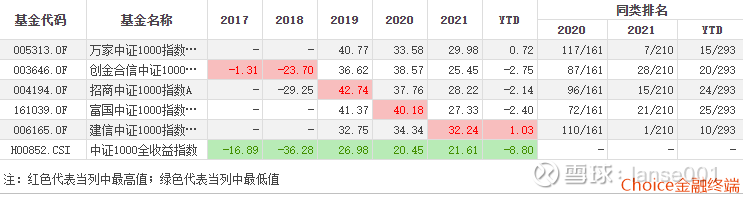
c. Comparison of similar funds: In the past 1 or 2 years, it has ranked first in the performance of CSI 1000 Index Enhanced Funds, and has performed very well.
2. Tracking error: The prospectus stipulates that the absolute value of the daily average tracking deviation between the growth rate of the fund’s net value and the performance comparison benchmark shall not exceed 0.5%, and the annual tracking error shall not exceed 7.75%.
According to the data reported in the second quarter of 2022, the average daily tracking deviation of A shares and C shares at the end of the reporting period of the fund are 0.2188% and 0.2188%, respectively, and the annual tracking errors are 4.5515% and 4.5423%, respectively, which are in line with the average daily tracking deviation in the fund contract. The absolute value does not exceed 0.5%, and the annual tracking error does not exceed 7.75%.
3. Information ratio:
Information ratios measure a fund’s risk-adjusted excess return over a particular index.
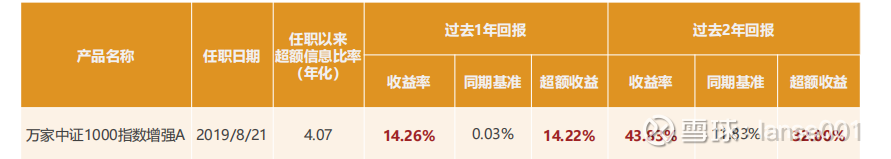
According to the data provided by Wanjia Fund in this survey, since Manager Qiao took office, the excess information ratio of Wanjia CSI 1000 Index Enhanced Fund a is 4.07. This data is very good, indicating that the risk-adjusted excess return of the fund is very good.
4. New income:
New returns are an important source of excess returns for index-enhanced funds. According to the data provided by Wanjia Fund in this survey, since Manager Qiao took office, the new income of Wanjia CSI 1000 Index Enhancement Fund A contributed 4.38% of the excess return, accounting for 7.64% of the total excess return.
This is close to the new contribution rate (7.3%) provided by choice in the past 1 year.
5. Quarterly win rate: 66.67%. The winning rate is relatively high. It shows that the excess return is stable.
6. Internal and external ratio of index constituent stocks: According to the investment strategy and operation analysis of the fund during the reporting period, the fund has more than 80% weight in the fund’s stock portfolio as CSI 1000 constituent stocks as stipulated in the prospectus, maintaining the style of following the underlying index Basically the same.
7. Retracement control analysis:
The retracement trend is more consistent with that of the CSI 1000 Index, but the retracement is small. At present, the largest retracement has been recovered, and the longest recovery time is 299 days.
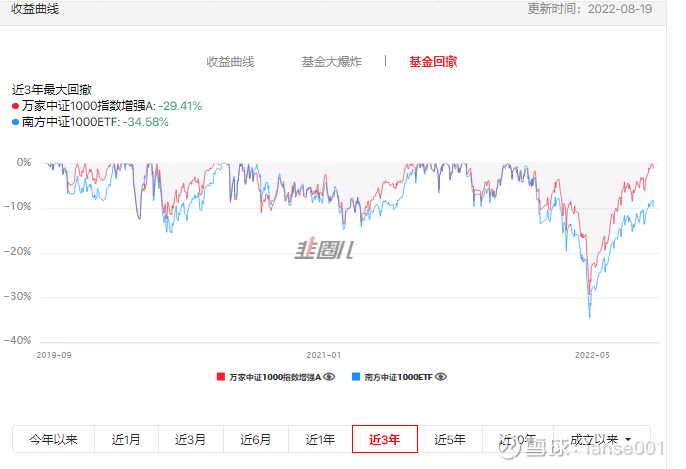
Judging from the risk-return performance ratio of the same type of fund (CSI 1000 Index Enhanced Fund), the yield rate in the past 3 years ranked 2/8 excellent, the maximum drawdown ranked 1/8 excellent, and it performed well in the same type of funds.
The enhanced advantage of the Wanjia CSI 1000 Index is that it has higher returns under the same volatility and maximum drawdown. (Compared with the 5 CSI 1000 Index Enhanced Funds that were also established before 2019, the return ranked second only to CCB CSI 1000 Enhanced, and the standard deviation ranked fourth,)
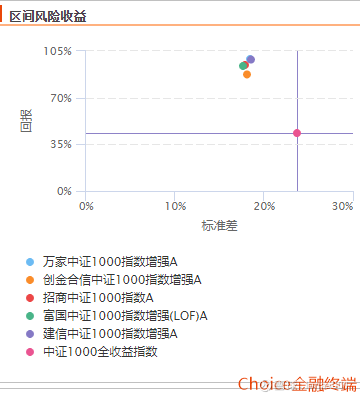
In terms of annual returns, all are positive and perform well. (The transition time is short, and it has not experienced a bear market)
3. Position characteristics.
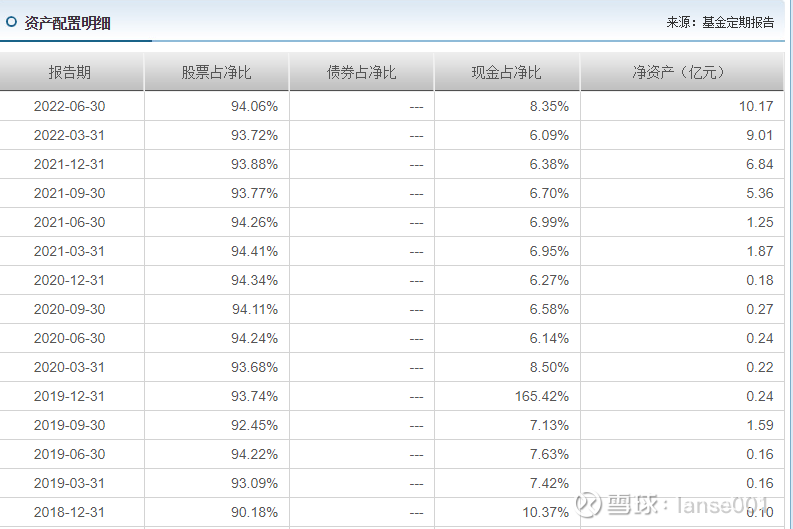
1. Major asset allocation: Manager Qiao’s stock position has been at 90% since he took office, and he does not hold bonds.
2. Number of shares held:
The CSI 1000 Index has 1,000 constituent stocks. The Wanjia CSI 1000 Index has enhanced the use of quantitative methods for stock selection. According to the 2021 annual report, there are 220 stocks in the index investment section and 156 stocks in the active investment section, totaling 376 stocks, of which the proportion of There are 61 stocks in the 0.5% index investment section, and 16 stocks in the active investment section, totaling 77 stocks. The number of shares held is far less than the number of constituent stocks in the CSI 1000 Index.
3. Shareholding concentration:
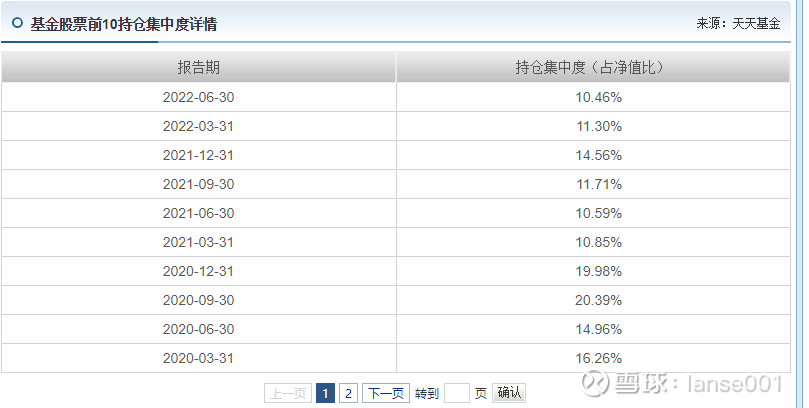
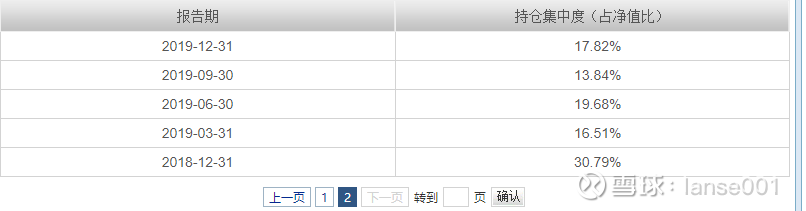
Since Manager Qiao took office, the shareholding concentration of Wanjia CSI 1000 Index has increased from 10.46% to 20.39%, which is relatively scattered, which is in line with the characteristics of CSI 1000 Index and quantitative methods. (Wanjia CSI 1000 was established on 2018.1.30 (2018.12.3 was transformed from Wanjiajiayu Bond Securities Investment Fund to this fund).)
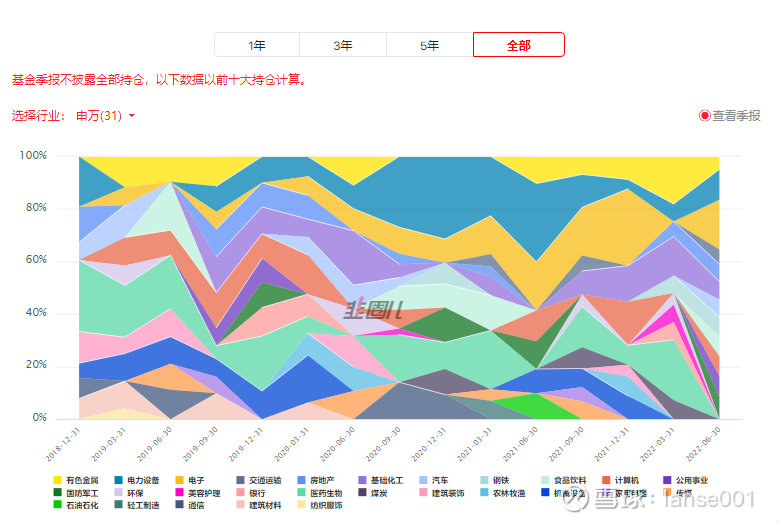
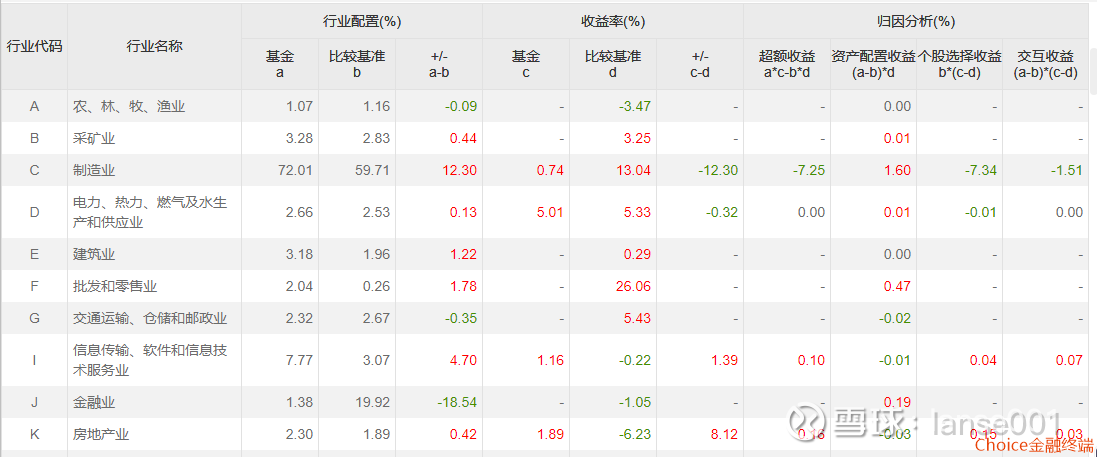
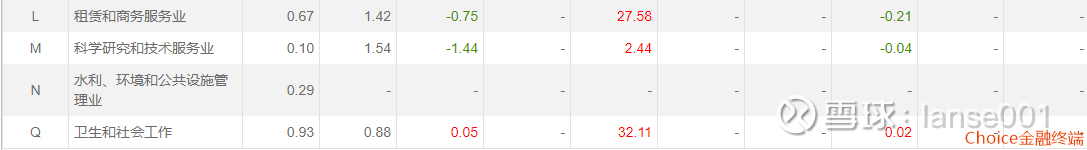
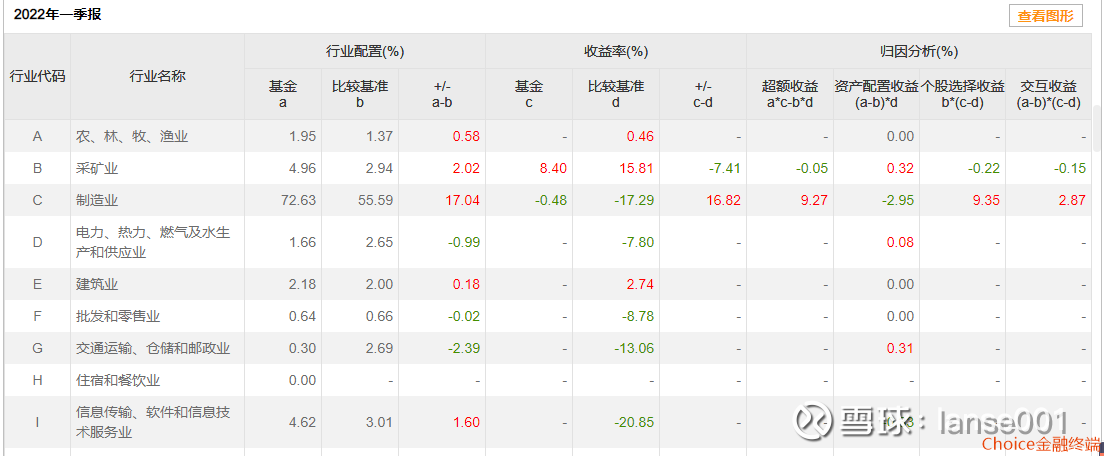
3. Industry configuration:
In the introduction of the fund prospectus and quarterly report, the fund adopts a quantitative multi-factor stock selection strategy, controls the deviation of industry weights and the concentration of individual stocks, and selects a basket of stock portfolios through quantitative multi-factor stock selection. The industry and style allocation is relatively balanced relative to the performance benchmark index. There is no heavy-holding industry or specific style. In terms of quantitative stock selection, a portfolio of high-quality stocks in the industry is selected, and the holdings are relatively scattered.
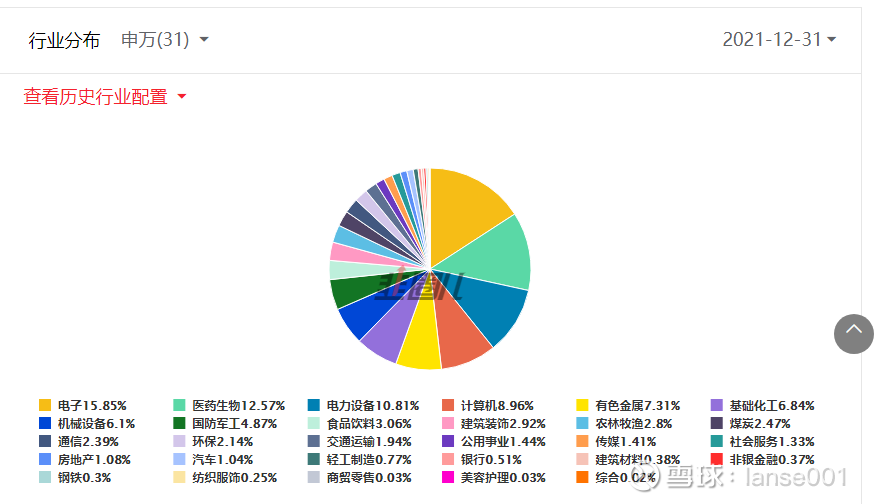
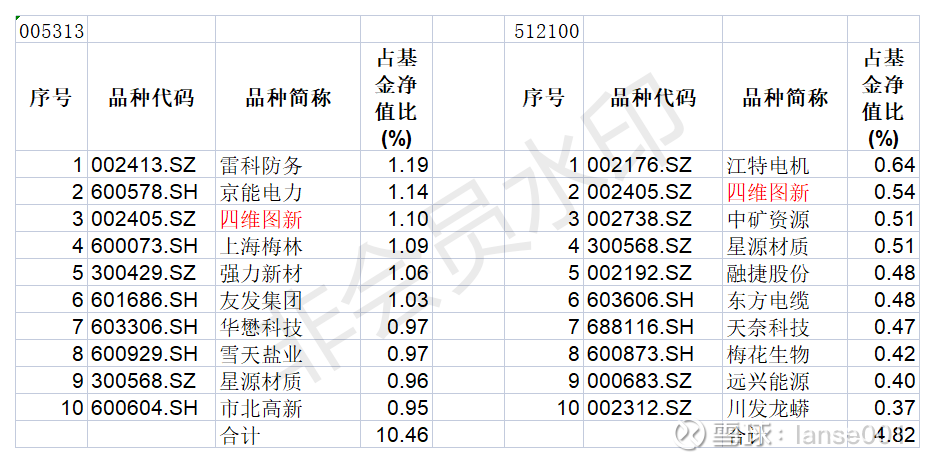
In this survey, Manager Qiao also introduced that the enhanced industry deviation of the Wanjia CSI 1000 Index is limited and will not deviate significantly from the index. Comparing the 2021 annual report that has disclosed all positions with the Southern China Securities 1000ETF,
Wanjia CSI 1000 Index enhanced:
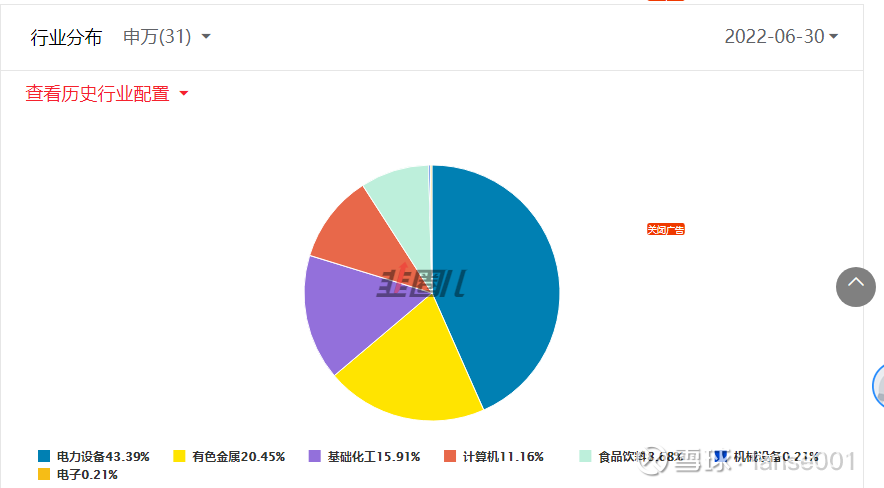
South China Securities 1000etf:
The top three industries of electronics, medicine and biology, and power equipment are in the same order. The deviations are: 4.63%, 2%, 0.5%, and the deviations of other industries are also within 2%. It can be seen that the fund controls the deviation of industry weights and keeps the industry neutral.
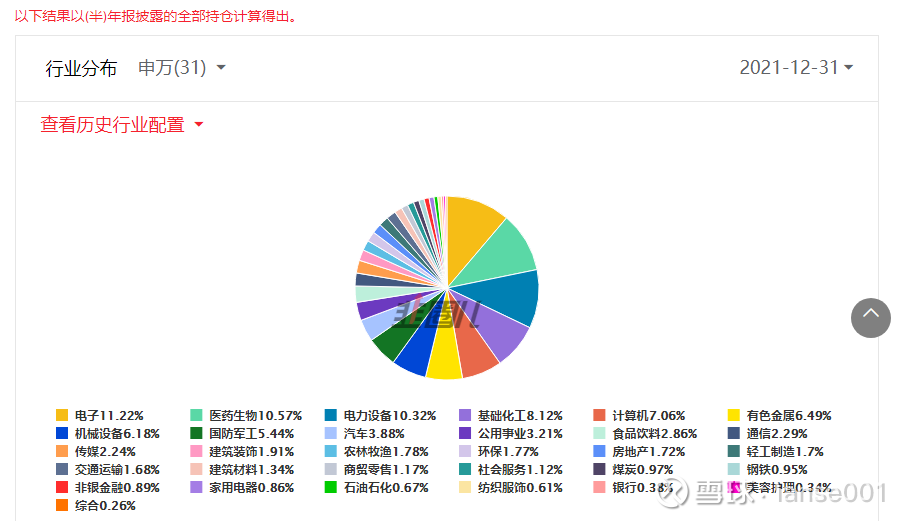
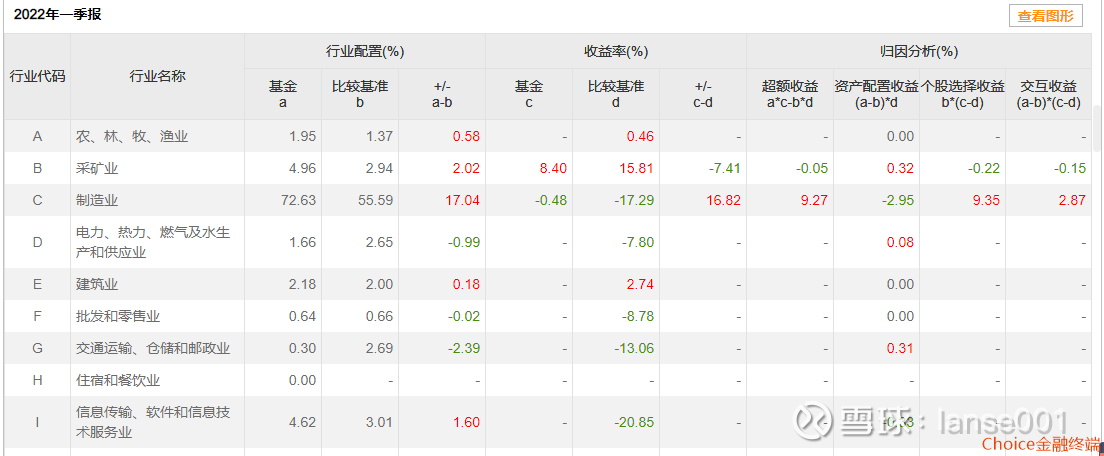
The historical industry allocation is close to that of the CSI 1000 Index:
The latest industry configuration is shown below:
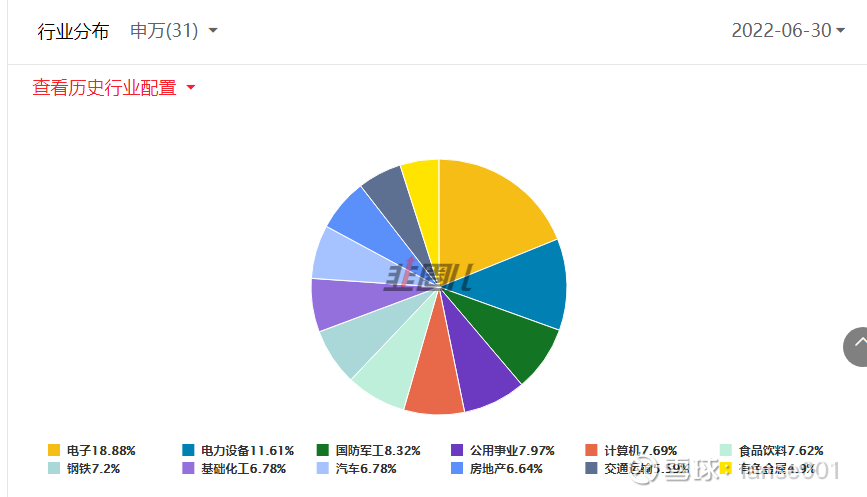
Electronics, power equipment, and defense industry are the top three industries. (The mid-term report has not disclosed, the above is calculated based on the top 10 heavyweight stocks) Compared with the Southern China Securities 1000etf,
Low-profile power equipment, non-ferrous metals, high-profile electronics, national defense and military industries, etc.
According to brokerage data, as of 2021, the enhanced industry deviation of Wanjia CSI 1000 in the annual report is 0.94.

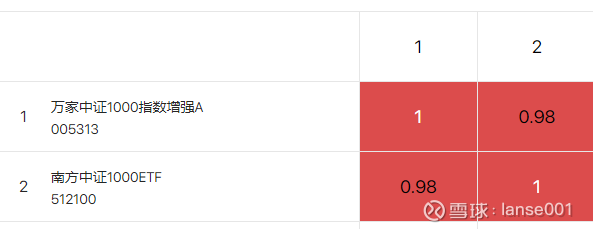
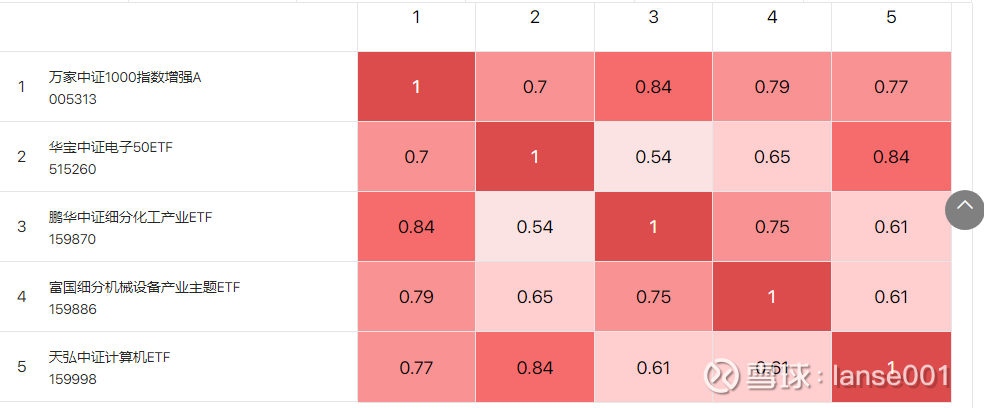
From the perspective of scale index and industry index correlation: the correlation with the CSI 1000 index is 0.98. The correlation with chemical industry and machinery is relatively high.
4. Fund turnover rate:
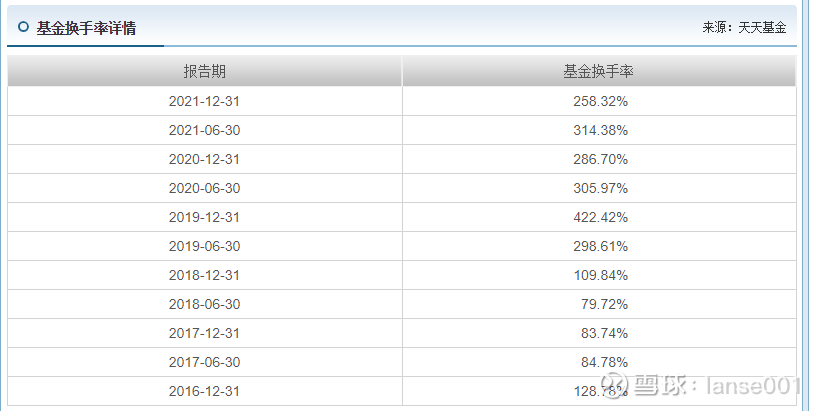
Manager Qiao has had a high turnover rate since his tenure, but this is due to the quantitative method. (The turnover rate before the transformation on December 3, 2018 cannot be directly compared, it was a bond fund before the transformation)
5. Ratio of index investment to active investment: According to the 2nd quarter report of 2022, the ratio of index investment to active investment in the domestic stock portfolio is 77.52% and 16.54% respectively. (as a percentage of the fund’s net asset value)
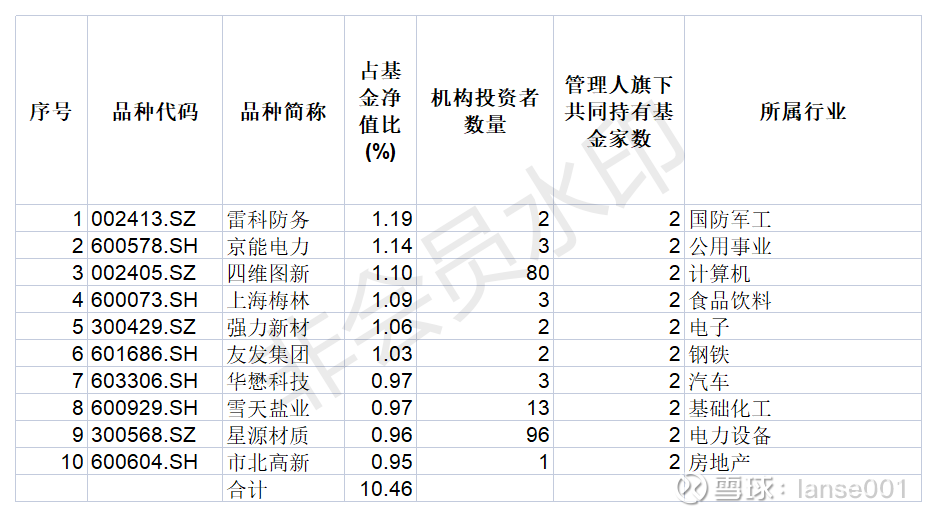
6. The latest top 10 stocks:
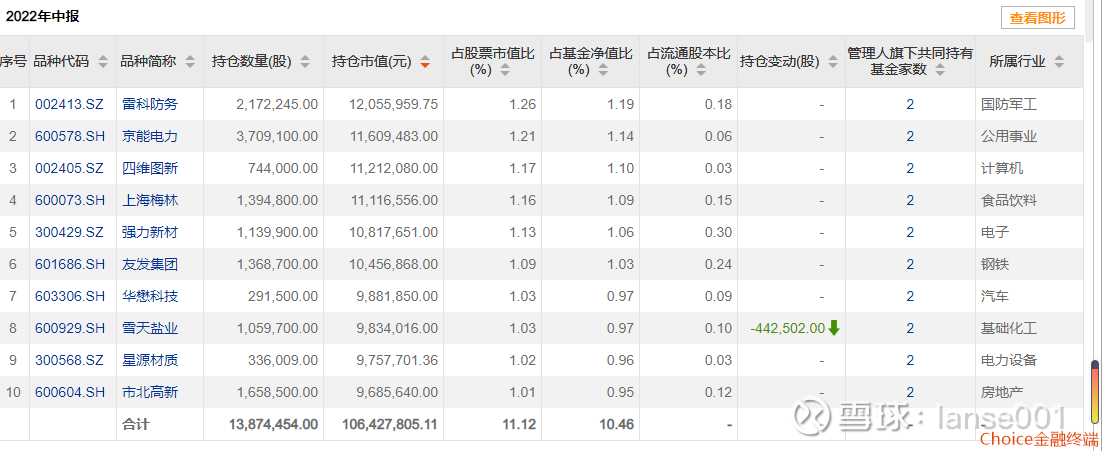
Compared with the CSI 1000 Index, the top 10 heavyweight stocks only have a new overlap in the 4D chart. At the same time, the holding ratio of the top 10 stocks is higher than that of the top 10 stocks in the CSI 1000 Index. Ten thousand CSI 1000 Index strengthens the top 10 stocks. At 0.95%, the CSI 1000 Index has a minimum of 0.37%. It can be seen that the enhancement concentration of the 1000 CSI 1000 Index is slightly higher, and the stock selection difference is large. (The top 10 stocks are all constituents of the CSI 1000 Index, but the ratio is different from that of the index.)
The deviation of individual stocks does not exceed 1%.
The top 10 heavyweight stocks contain 0 grains and 9.17% of electricity. Most of the top 10 heavyweight stocks are unpopular stocks. Except for NavInfo and Xingyuan, there are many institutional investors, and other funds of Wanjia Fund also hold these 10 stocks. only stocks.
Financial data characteristics of the top 10 heavyweight stocks: Average: PE: 325.6, PB: 1.9, ROE: 0.6%, market value: 15.36 billion. PE is high, PB is medium, ROE is very low, and the market value is relatively small. (The price-earnings ratio is very high. As long as it is affected by the meager profit stocks, it will not deviate much from the valuation of the CSI 1000 Index after excluding it.)
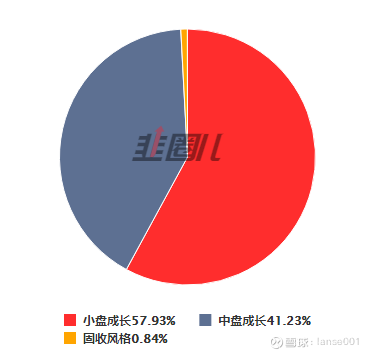
10 styles of heavy holding stocks: mid-cap growth, small-cap growth mainly
4. Performance Attribution:
1. Composition:
According to the data provided by Wanjia Fund in this survey, since Manager Qiao took office, the excess returns of Wanjia CSI 1000 Index Enhancement Fund a are:
Total excess return 57.35% = portfolio investment income 58.83% + new 4.38% – 5.86% such as swap.
According to choice data:
From the attribution analysis, industry allocation, stock selection ability, and trading ability contributed more excess returns. (I choose the first and second quarters of 2022 as an example), the industry configuration is concentrated in the manufacturing industry.
From the financial data:
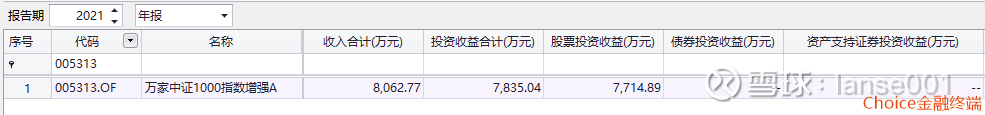
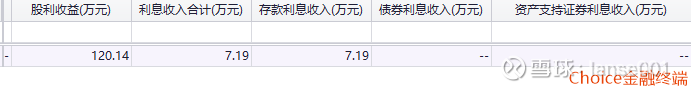
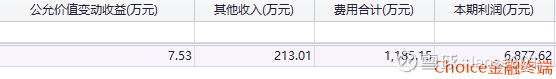
From the perspective of income split, the main income comes from stock investment income. The data provided by choice shows that the new contribution rate (7.3%) in the past 1 year.
2. Stock selection ability:
According to the performance of choice, the ability to select stocks is strong, mainly from individual stocks in the manufacturing industry.
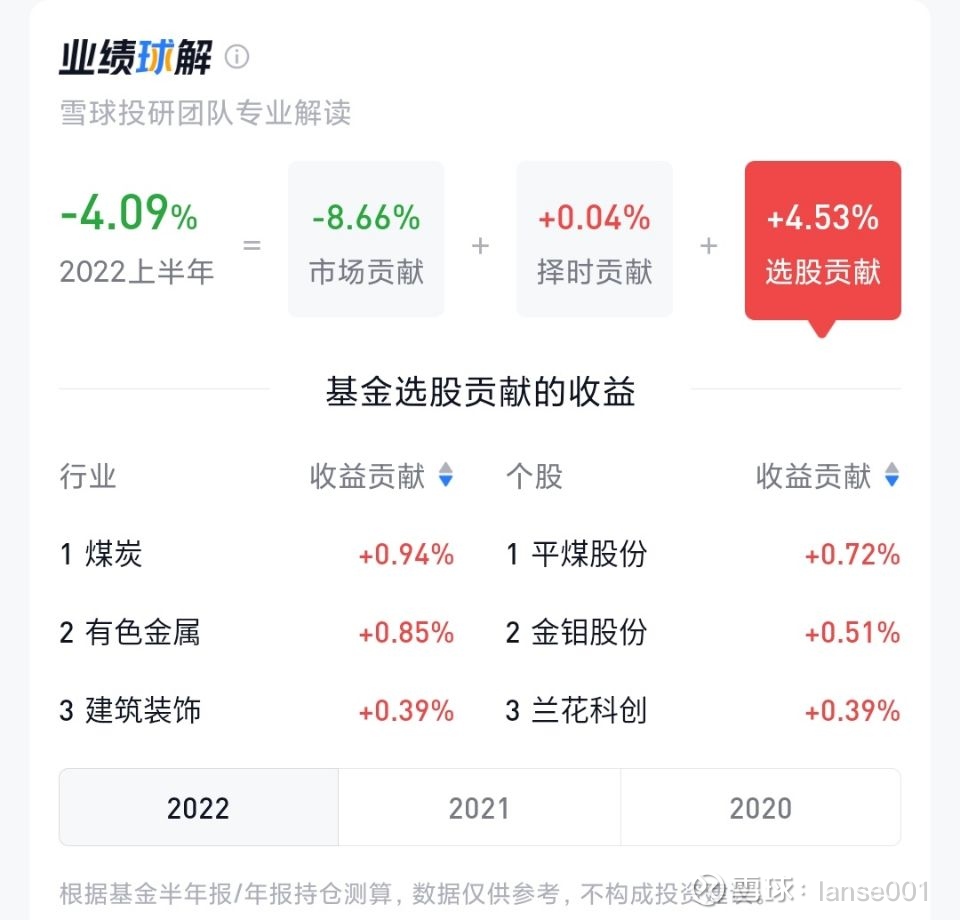
According to Snowball’s performance attribution, stock picking contributed the vast majority of results in the first half of 2022.
The top ten stocks with heavy holdings changed a lot quarterly, with an average of 5.4 changes per quarter, indicating that fund managers exchange shares more frequently. Based on the performance of the fund, the fund manager’s trading ability is strong, and it also meets the characteristics of frequent quantitative share swaps. (In some quarters, 9 or 10 of the top 10 heavyweight stocks were exchanged. Of course, this is also related to the dispersion of the constituent stocks of the CSI 1000 Index)
Successful cases of historical heavy holding stocks:
Xuetian Salt Industry: 2022Q1 is the 4th largest holding stock, accounting for 1.21%, by 2022 Q2 is the 8th largest holding stock, accounting for 0.97%, 442,500 shares have been reduced, and 2022.4.1 to 2022.6.30.31, an increase of 31.11%, Significantly outperformed the CSI 300 Index by 6.21%.
Because of the use of quantitative methods, the top 10 heavyweight stocks change frequently and their proportions are relatively low. The reference value of the top 10 heavyweight stocks is not as high as that of ordinary active funds, and more importantly, the framework for quantitative stock selection.
3. Timing ability: Because it has always maintained a high position of 90%, it basically does not choose the timing. According to the performance of Snowball, the timing contribution is small (0.04%).
4. Style factor exposure and income contribution:
Regarding the selection and ratio of quantitative factors enhanced by Wanjia CSI 1000, I specifically asked Manager Qiao a question during the investigation. The answer I got was that most public funds have more effects and applications of fundamental factors in the CSI 300 index enhanced fund. , In the CSI 1000 Index Enhancement Fund, there are many effects and applications of volume and price and sentiment factors, and the CSI 500 Index Enhancement Fund is in between.
Judging from the position style data provided by Jiuquan, Wanjia CSI 1000 is mainly based on mid-cap and small-cap growth, which is related to the characteristics of the CSI 1000 Index.
From the introduction of Wanjia Fund in the survey, the quantitative framework of Wanjia is as follows:
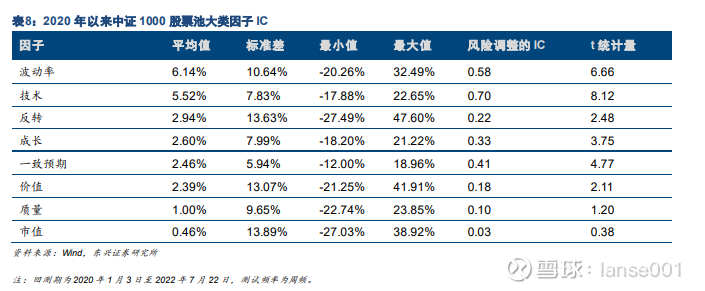
Factors with better performance: The IC average value of the major factors shows that the factors that have performed well in the CSI 1000 Index this year are volatility, technology, and value factors. Due to the outstanding performance of Wanjia CSI 1000, it should also allocate more of these good performance factors.
Since factor allocation is the core data of the fund, fund managers will not disclose it in detail, and ordinary investors also lack access to it. We still focus on the past performance and quantitative framework of fund managers.
5. Analysis of holder structure:
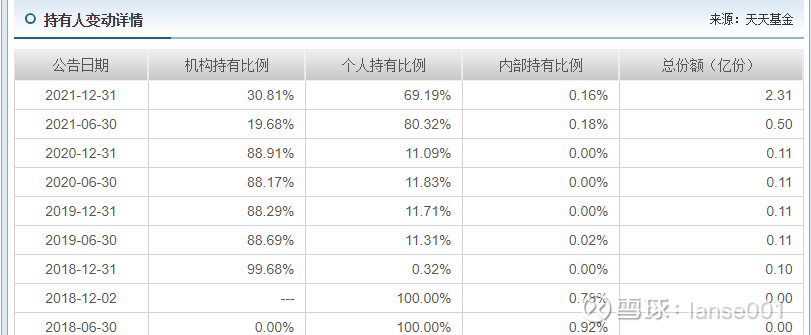
The latest report shows that the proportion of institutional holdings is relatively large, at 30.81%, a significant increase from 19.68% in the mid-year report in 2021, indicating that institutions are optimistic about this fund. The latest internal holding ratio is 0.16%, which remains stable. As a start-up fund, the start-up share remains stable.
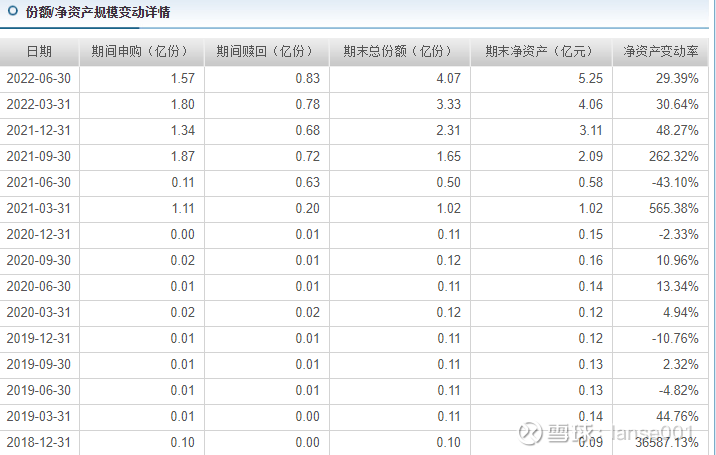
Fund size: The size is highly volatile, with substantial growth in the third quarter of 2021. The latest is 525 million yuan, and the scale is medium. The latest share is net subscription. The growth of the scale comes from the contribution of the growth of the fund’s net value and the net subscription of shares.
6. The development prospects of the CSI 1000 Index Enhanced Products introduced by the fund managers in this survey:
1. CSI 1000 Derivatives enriched hedging tools and filled the hedging gap of small-cap stocks.
2. The launch of CSI 1000 index derivatives has opened up the scale of index products and boosted the performance of the index.
3. The number of ETFs has grown rapidly after the draft or the official release.
4. The current CSI 1000 is at a low allocation level. With the entry of incremental funds, it will boost the performance of the index.
5. The content of “specialized, refined and new” is high, and it is highly consistent with the CSI 1000, which is expected to benefit from policy dividends.
6. High historical returns, with a cumulative return of 595%. The CSI 1000 Index is an investment depression with a low valuation and a high margin of safety.
7. CSI 1000 is the most suitable index for enhancement. The industry distribution of the CSI 1000 index is balanced, the weight dispersion is high and the individual stocks are highly differentiated, and the trend will not be dominated by a few stocks. At the same time, the CSI 1000 index enhancement track is not crowded, making it easier to implement multi-factor enhancement strategies on the CSI 1000. higher excess returns.
7. The development prospects of Wanjia quantitative products introduced by fund managers in this survey:
1. Advantages of Wanjia: Steady growth in scale and balanced structure, four major businesses go hand in hand, winning three major awards in the fund industry, first-class talent allocation, diverse quantitative strategies, and experienced leaders.
2. Wanjia’s quantitative framework:
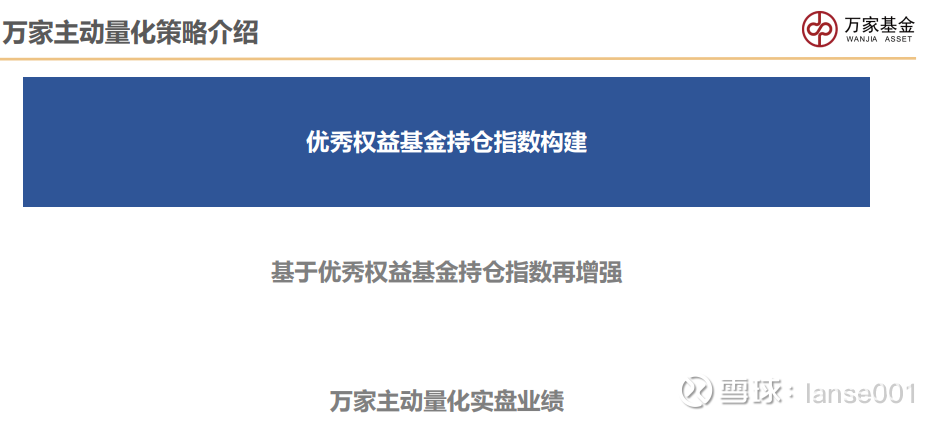
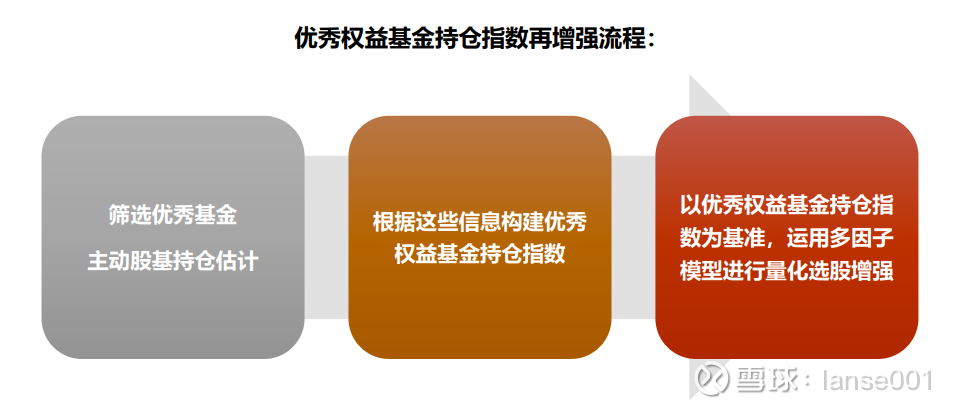
The quantification method of Wanjia Quantitative and Smart Selection is similar to that of Wells Fargo Tianhe by selecting funds, (constructing) selecting indexes, and selecting individual stocks. The quantitative color of Wanjia Quantitative Smart Selection is more important.
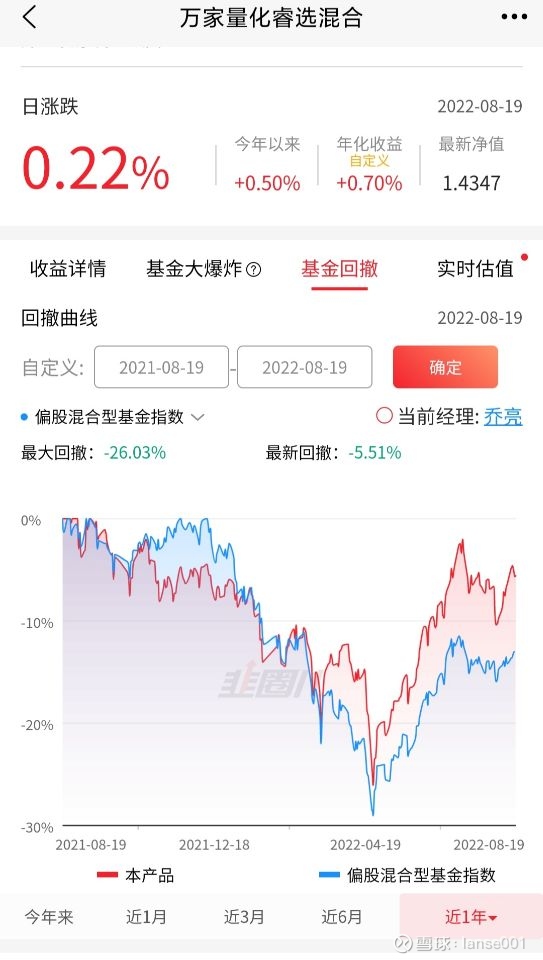
3. Wanjia quantified the performance of Ruixuan from the (excess income is very good):
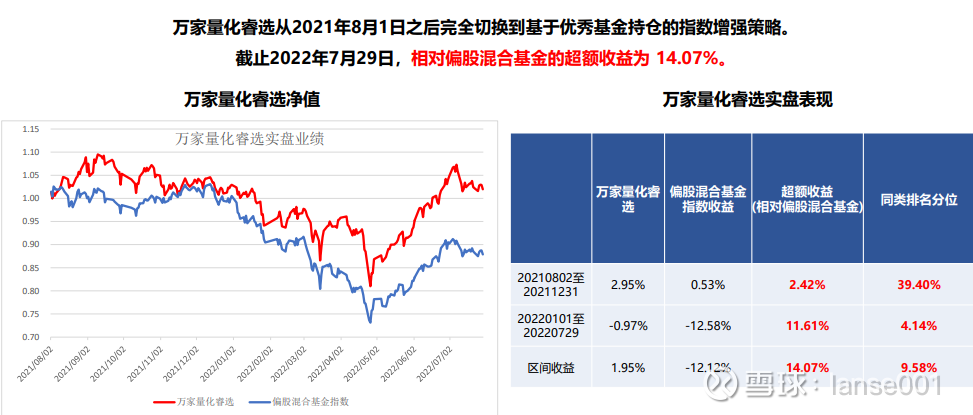
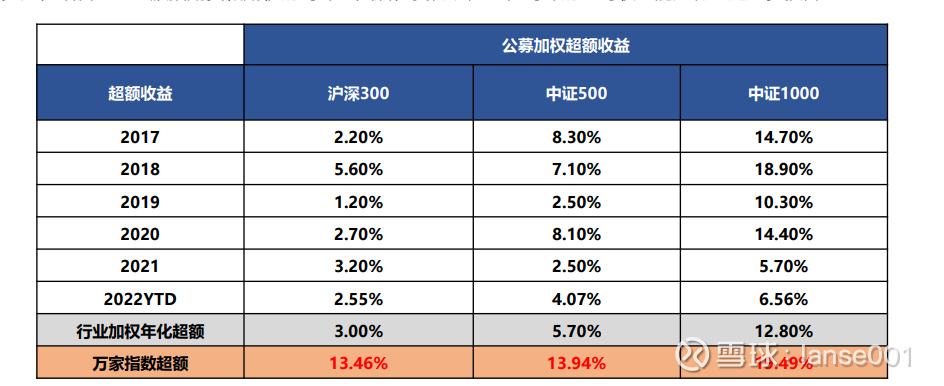
Wanjia Quantitative Smart Selection will completely switch to an index enhancement strategy based on outstanding fund positions after August 1, 2021. As of July 29, 2022, the excess return of the relative partial equity hybrid fund was 14.07%. Outstanding.
Since the time is not long, the follow-up stability of excess returns needs to continue to be observed. In the past 1 year, the retracement is better than the partial stock mixed fund index.
4. Comparison with Tianhe Fuguo:
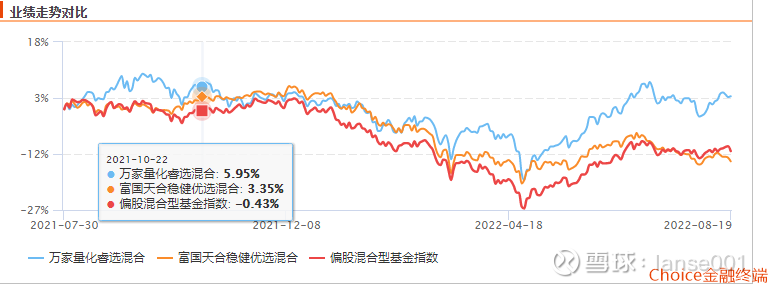
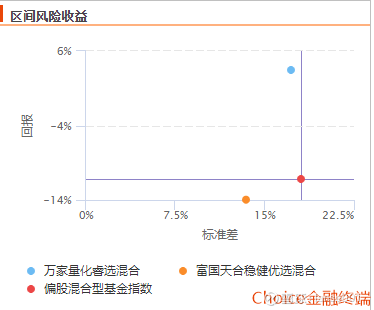
From 2021.8.1 to 2022.8.19, Wanjia Quantitative Smart Selection outperformed Wells Fargo Tianhe.
8. The investment philosophy introduced by the fund managers in this survey:
Manager Qiao mentioned many times in the research that he is optimistic about the enhancement of the CSI 1000 Index and Wanjia’s quantitative smart selection, and has strong confidence in the quantitative strength of Wanjia. At the same time, he has repeatedly pointed out that long-term investment, only long-term investment can reap better investment. Income, too short-term trading is difficult to have good income, I personally think this is more reasonable.
Risk warning: Wanjia CSI 1000 Index Enhanced A (005313) is a stock-enhanced index type, and Wanjia Quantitative Ruixuan (004641) is a flexible allocation type, with risk levels of r5 and r4 respectively, which are medium and high-risk products, with higher risks than bond funds And currency funds, the CSI 1000 Index fluctuates greatly, and the historical performance of the fund cannot predict the future. This article is a personal opinion, not an investment recommendation. Entering the market based on this is at your own risk.
Summarize
Wanjia CSI 1000 Index has enhanced performance and strong ability to control drawdown and volatility. At any time, the Wanjia quantitative investment research team has years of quantitative multi-factor stock selection theory and practice foundation. It is the first in the market to apply linear and non-linear algorithms. One of the actual investment teams, it has been at the leading level in the industry for a long time, with excess industry allocation capabilities, outstanding stock selection capabilities and trading capabilities. Wanjia Quantitative Smart Selection has performed well, with good drawdown control, and several funds under which Qiao Liang, the fund manager, have performed well. Wanjia CSI 1000 Index Enhancement, Wanjia Quantitative Smart Selection and Fund Manager Qiao Liang deserve the attention of investors who are optimistic about the CSI 1000 Index Enhancement Fund and Quantitative Fund.
#Snowball Public Raising Talent Plan# #Laosiji Hardcore Evaluation#
@Today’s topic @雪ball fund@雪ball number through train @snowball creator center @安信fund, @xindaaoyin essence configuration @xinaocycle power @ golfer welfare
@万家基金@万家fund Zhang Jun @万家中正分利利
@ETF Star Push Official @ETF Hot List Chasing Base , $Wanjia CSI 1000 Index Enhanced A(F005313)$ , $Leike Defense(SZ002413)$ , $Navtuxin(SZ002405)$
This topic has 13 discussions in Snowball, click to view.
Snowball is an investor’s social network, and smart investors are here.
Click to download Snowball mobile client http://xueqiu.com/xz ]]>
This article is reproduced from: http://xueqiu.com/2443086428/228623629
This site is for inclusion only, and the copyright belongs to the original author.