1. Observation of freight rates in the current shipping market
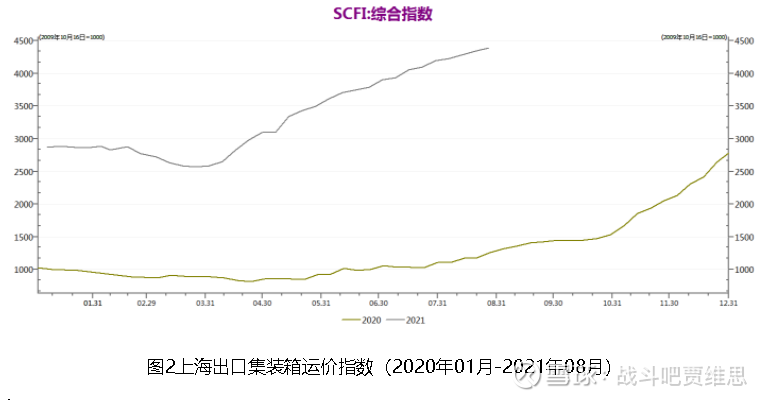
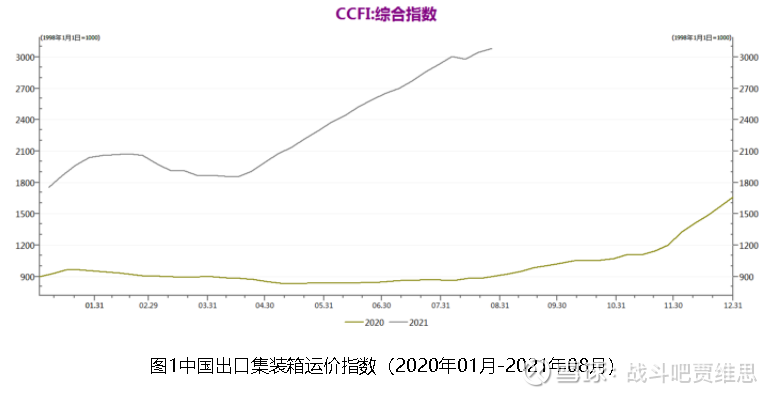
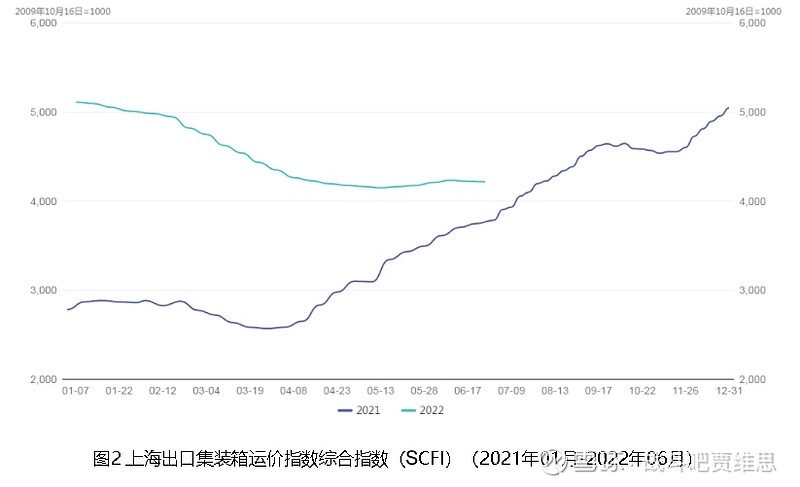
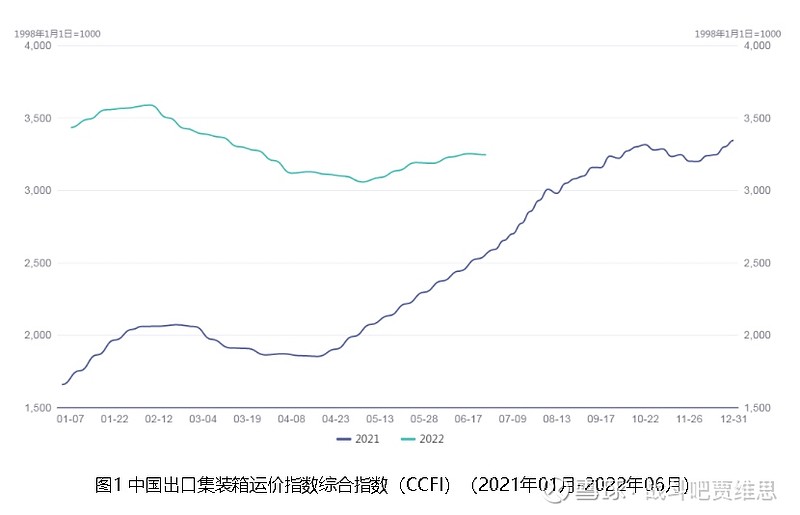
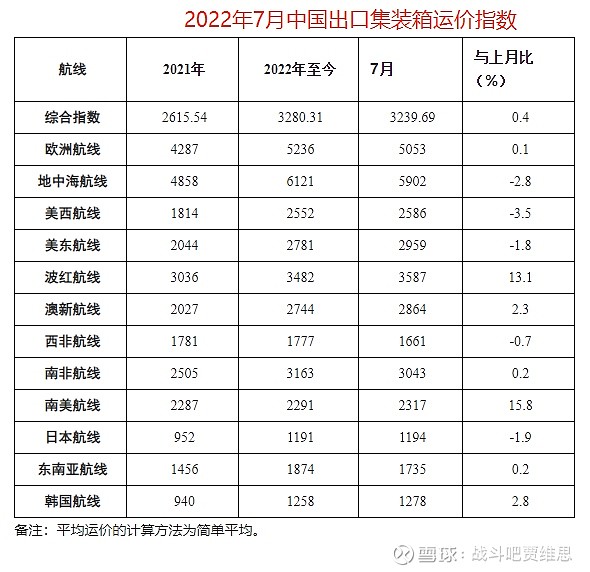
The current container freight rate continues to decline. The latest Shanghai Container Freight Index (SCFI) is 3429.83 points, down 132.84 points from last week, or 3.73%, and has been declining for ten consecutive weeks. Of course, if you extend the freight rate chart to the range of a year ago and take a closer look, you will find that the SCFI index and freight rates of major routes such as North America and Europe are only slightly lower than the level of the same period last year, and the U.S. line is far from the same period last year. It is better than the same period in August last year. I think the market has over-interpreted the current drop in freight rates, and the current freight rates are still running at a relatively high level. Of course, in the long run, the major trend conditions are bound to fall. We all know this, but I believe it will fall to a reasonable range that is acceptable to both the shipping company and the cargo owner.
2. Observation of demand and effective capacity
1. The demand side of the US line: strong and strong
In the first half of this year, major U.S. ports handled 26.4 million TEU, compared to 25.1 million TEU in the same period in 2021.
U.S. container throughput surged in 2021, with its nine largest container ports handling a total of 50.5 million containers, compared with 43.4 million in 2020 and 43.7 million in 2019.
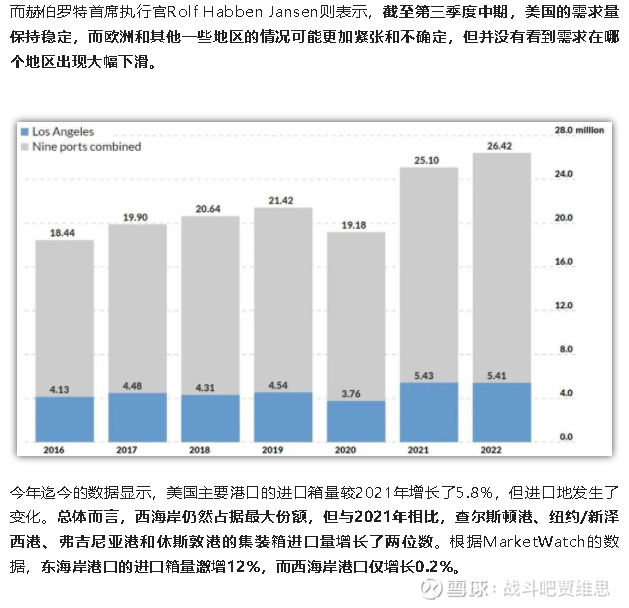
According to the latest analysis data released by American research firm Descartes Datamyne, the total number of imported containers handled by the United States in July was 2.53 million TEU, an increase of 3% year-on-year and a 15% increase compared to before the epidemic. It was the country’s highest July import volume on record, up 2% from June.

The Descartes analysis report shows that imports from China rebounded last month. Container shipments from China totaled 994,927TEU in July, up 6.3% year-on-year and up 6.9% from June, the company said. Factors such as a slowing economy, inflation and high fuel costs did not have the expected impact of a slowdown in U.S. containerized imports. With consumption levels and imports still well above pre-pandemic levels, the U.S. port system continues to operate at maximum throughput. Monthly imports appear to have rebounded near port capacity caps. Starting in March 2021, U.S. imports continue to exceed 2.4 million TEU per month, and port congestion has become a significant problem. As long as U.S. ports have more than 2.4 million TEU of containerized imports per month, port congestion will continue until infrastructure changes are made.
The McCown report analyzes the throughput of the top ten U.S. ports. Imports at these ports rose 0.7% in July from a year earlier, it found. Imports at major U.S. East Coast and Gulf Coast ports rose 6.6%, while imports at West Coast ports fell 4.9% (West Eastward). U.S. imports continued to remain strong in mid-August. So far, U.S. customs data shows that August imports have barely budged compared to July, although some ports may see a small pullback. Gene Seroka, executive director of the Port of Los Angeles, predicted that “imports will start to ease” in August in Los Angeles. For ports with large ship queues, New York/New Jersey, Savannah and Houston will all see strong import volumes for at least this month. The reason is simple, the backlog of cargo at sea. (As of last Thursday morning on 8.18, there were still 130 container ships waiting for berths outside North American ports.) While the U.S. ushered in a back-to-school shopping peak in August, the boost in demand was limited to some categories of goods; with the continued easing of port congestion in China , this week, the average space utilization rate of ships in Shanghai Port is around 90% for the US-West route and 95% for the US-East route.
2. European line demand side: Since no specific data has been found, it cannot be detailed. However, from the descriptions of various media sources: “In the context of the deteriorating economic situation, energy prices are expected to rise and overall consumption expectations are weakened.” The demand for the entire European line is sluggish, compared to the strong demand for the US line. worse.
3. The release of effective capacity increases
From November 2020 to January 2022, global container shipping demand has been 10% higher than capacity supply, according to the latest weekly report from shipping research firm Sea-Intelligence. However, this gap between demand and supply has been narrowing, with the latest figures in June showing the gap has narrowed to 2% compared to pre-COVID-19 pandemic levels. “ All in all, the extreme surge in container freight rates in 2021 is indeed driven by a sudden surge in global demand outpacing capacity – but it is also clear that this is largely driven by structural shortages and unavailability related to capacity such as COVID-19 The resulting port congestion and a massive backlog of containers in major ports around the world.”
As of August 18, the 7-day moving average of container ships in East Asia ports increased by 6% month-on-month to 2.5 million TEU; according to the Clarkson Port Congestion Index, the global container ships’ in-port capacity accounted for 35.3%, a slight increase from the previous month. Down but still above the pre-pandemic average of 31.5%. According to data released by Alphaliner in early 2022, the Asia-Europe and trans-Pacific routes currently account for 43.7% of the total global container capacity, up from 38.1% in the same period in 2021.
Let’s use the data of Clarkson and Alphaliner to calculate how much the increase in effective capacity has been released?
Total global container capacity: 25.906 million TEU
The Asia-Europe route and the trans-Pacific route accounted for 43.7% of the total global container capacity at the beginning of the year, or 11.3209 million TEU (there will definitely be an increase in the follow-up)
The global container ship capacity in the port accounted for 35.3%, compared with 31.5% before the epidemic, and the release increased by 3.8%
The global effective capacity release has increased: 2590.6*3.8%=984,400 TEU (should be only a few)
3. Observation of new ships in hand orders and ship age
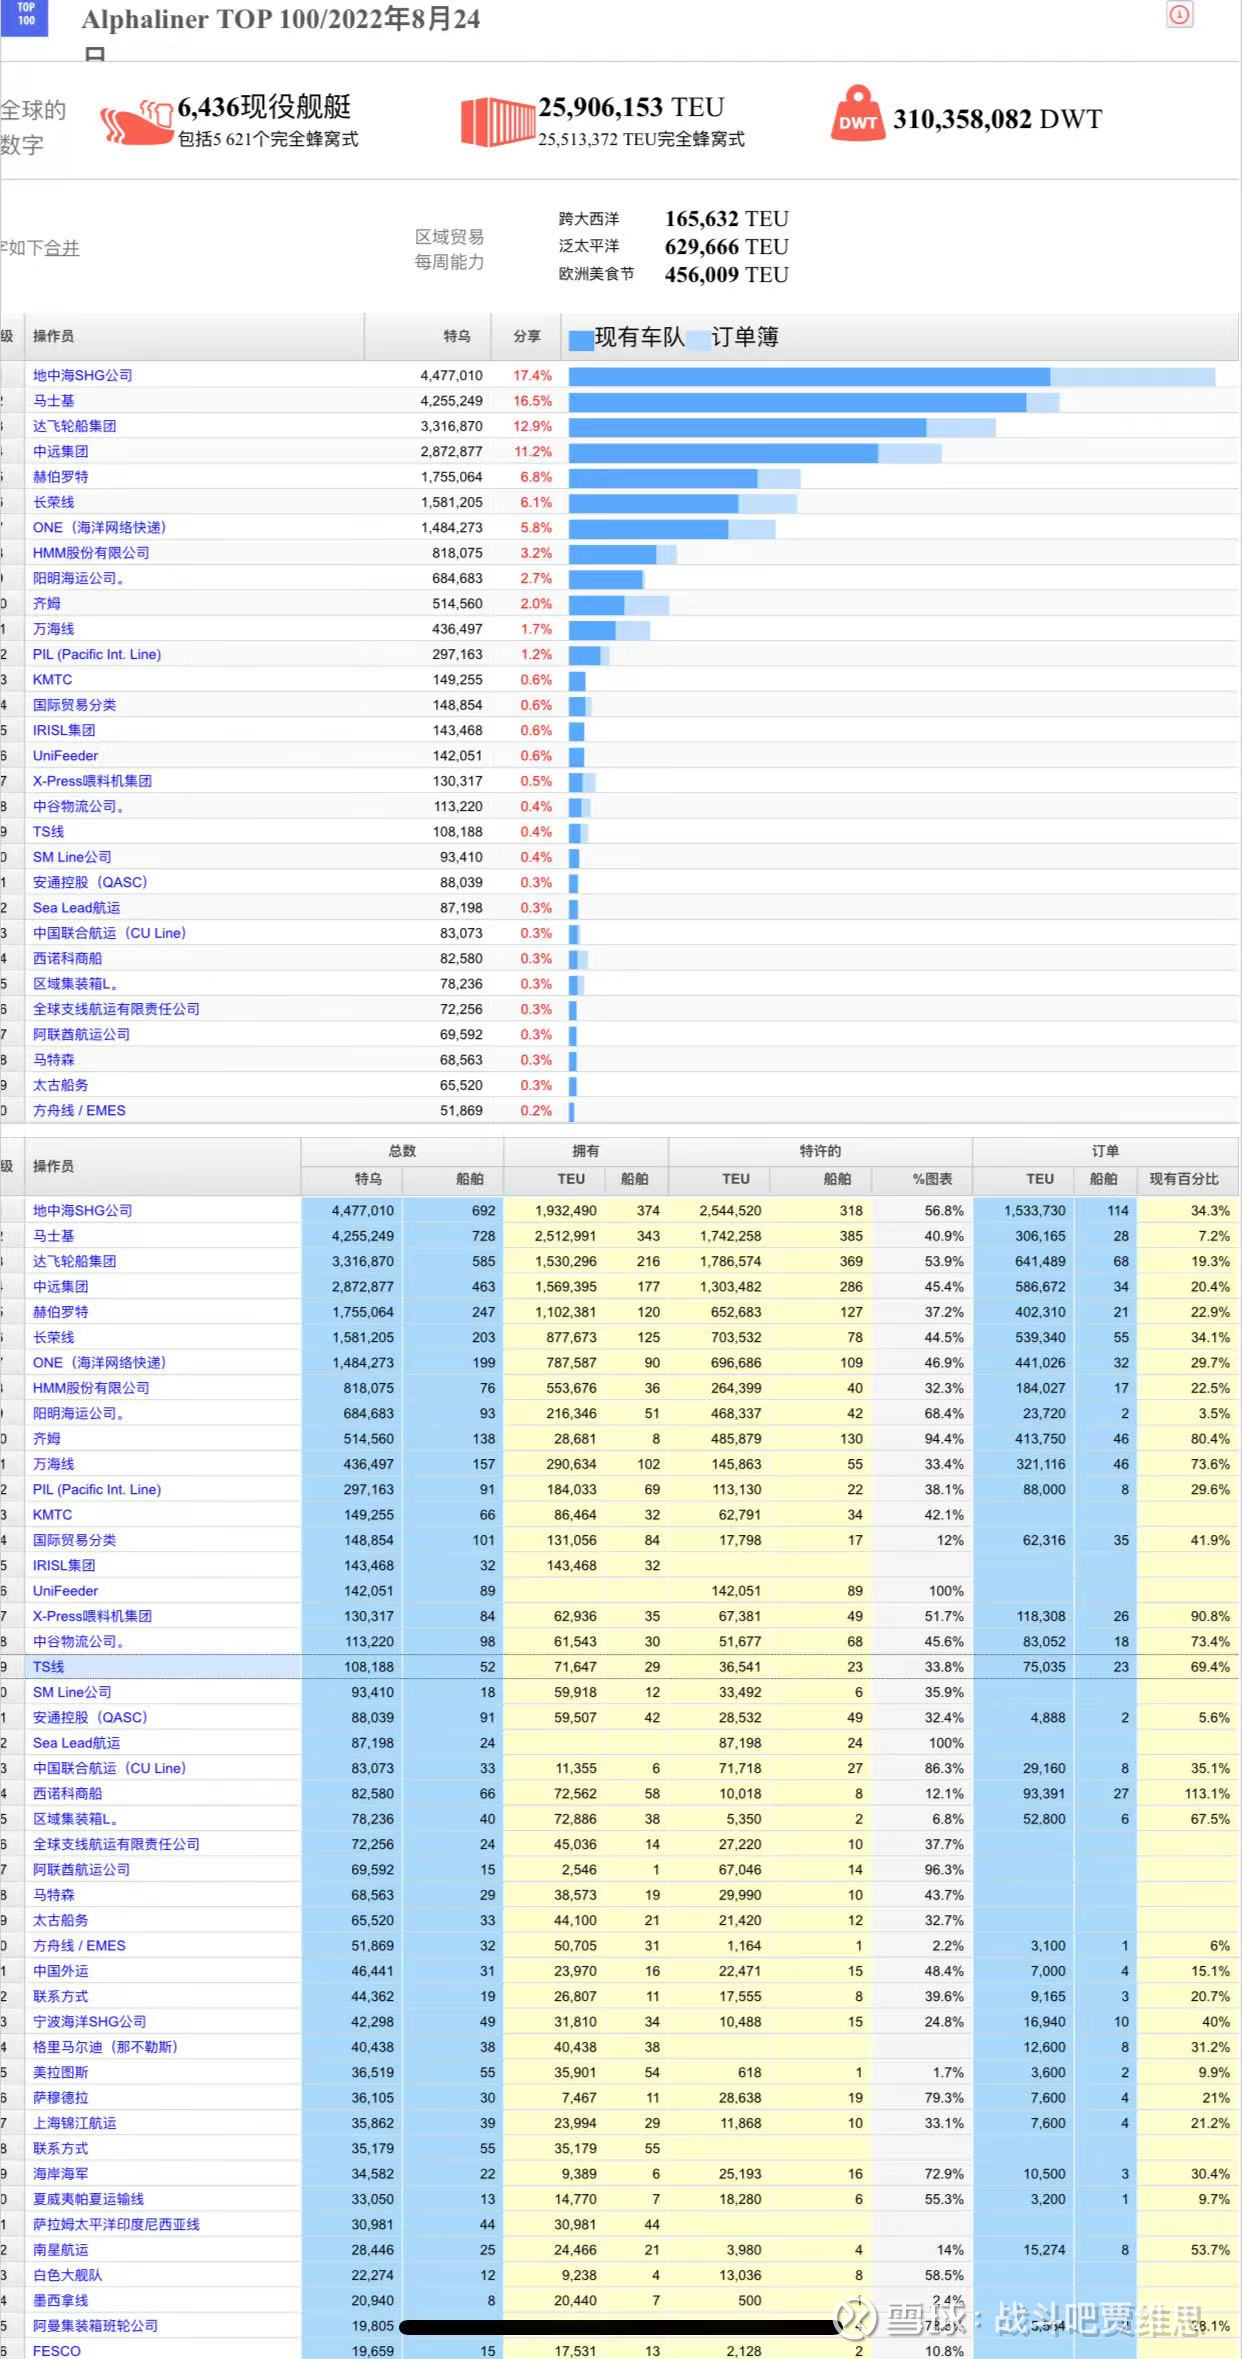
According to the comprehensive estimation of Alhpaliner and wind value in May, the proportion of global airlines’ orders in hand is 28.21% (Tianfengge’s estimation method) is about 7.308 million TEU
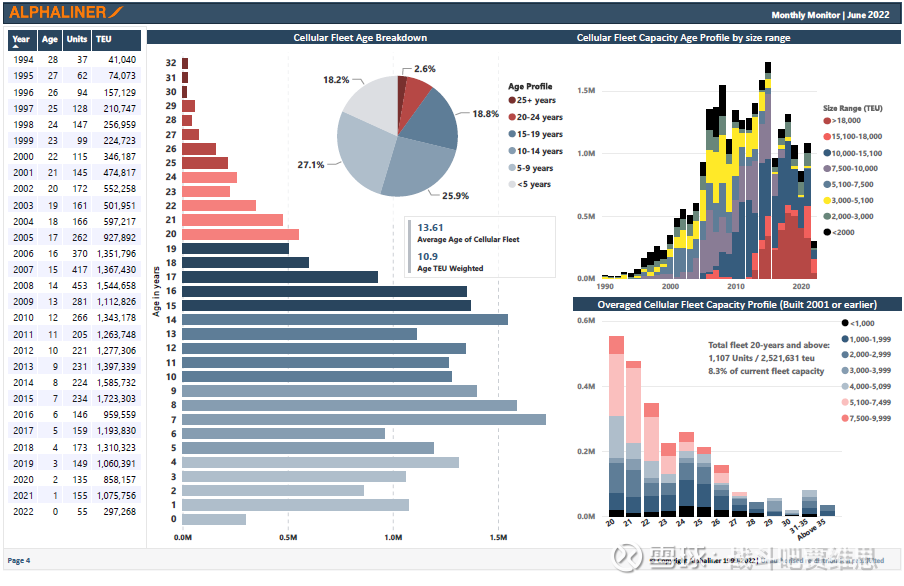
According to Alhpaliner’s June 2022 Paid Report:
15-19 years of age 4.746 million TEU accounted for 18.8%;
20-24 years of age 1.855 million TEU accounted for 7.4%;
>24 years of age 666,600 TEU accounted for 2.6% (of which 25-28 years of age 482,000 TEU accounted for 1.9%);
The total proportion of old ships over 15 years is 28.8%, and the proportion of old ships over 20 years old is 10% (there are basically no old ships dismantled and scrapped in the past year);
Old ships over 15 years old accounted for 28.06% of the existing capacity;
Old ships over 20 years old accounted for 9.76%;
The global average age of ships should be more than 13 years and close to 14 years.
The capacity of old ships with more than 15 years is basically the same as the number of new ships in hand. On January 1, 2023, the global shipping market will implement the new IMO regulations to reduce carbon emissions. Most of the new ship orders added by shipping companies are In response to the old-for-new strategy adopted in response to ship compliance, the market has over-interpreted it as the shipping company’s aggressive new capacity. This interpretation is far from the reality; especially, there will be ships over 15 years old next year. 28.06%, these old ships no longer meet the new carbon reduction regulations, and they have lost their full competitiveness after the freight rate fell, so they can only slow down or withdraw one after another. In addition, when the freight rate gradually cools down, the shipping company will no longer adopt the aggressive high-priced chartering method.

4. Observation of global port strikes
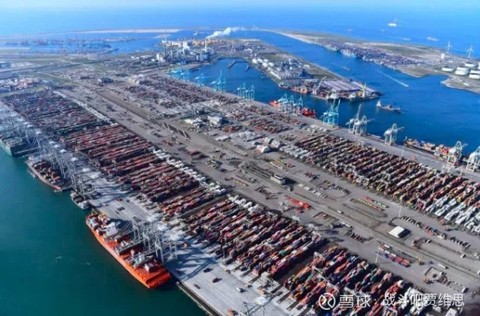
1. On August 21, the Port of Felixstowe, the largest container port in the United Kingdom, started an eight-day strike, involving more than 1,900 workers due to wage issues. It is reported that the port handles more than 4 million TEUs per year. In response, container liner companies have cancelled regular calls at the port and have rerouted their routes to other ports in Northern Europe and the UK. The strike action will exacerbate pressure on the logistics supply chain in the Port of Felixstowe and the UK. For the past two years, the Port of Felixstowe has suffered from congestion and a glut of containers. According to Container xChange’s Container Availability Index (CAx), the average CAx index for the Port of Felixstowe has hovered around 0.9 for most of 2022, one of the highest in the European region. A CAx above 0.5 indicates a surplus of containers, while a CAx below 0.5 indicates a shortage of containers.
2. Dockworkers in Liverpool , UK, are also voting for a strike to raise wages, and union representatives have not yet confirmed when the strike will take place. If Germany follows suit and goes on strike, Europe’s logistics network could be even more chaotic. Earlier this summer, German ports including the ports of Hamburg, Bremerhaven and Wilhelmshaven were hit by a strike by thousands of dockworkers. Negotiations between the union and the Central Association of German Seaport Companies (ZDS) are ongoing. The court-ordered moratorium on strike action expires on August 26. Roeloffs pointed out that earlier this year, inflation ripped through Europe and port workers in northern Germany were on strike for higher wages. The strikes, which have piled up containers at docks and yards, exacerbated logistical blockages across Europe this summer, while falling water levels on the Rhine made it difficult to transport by barge, forcing many containers to be transported by rail and truck, figures show. Since the strike, Bremerhaven’s CAx has jumped from 0.6 in June to above 0.8 now . The index has remained above 0.7 since mid-July. And since 2019, the only time the port’s CAx has breached 0.7 was in early 2021. After the strike, the Port of Hamburg’s CAx index has also remained above 0.8 .
3. Congestion at U.S. Gulf Coast and East Coast ports, as well as inland and rail terminals, continues to increase, which is affecting liquidity across the supply chain. This congestion can be extremely exacerbated during peak shipping seasons due to the high number of import containers available at the terminal, the increasing number of empty containers hindering operations, and the long wait times to access inland rail and other transportation resources. Congestion in the U.S. East has been driven by a combination of transpacific market activity and strong transatlantic trade over the past few months. Looking ahead to September, we still see strong demand in the U.S. East relative to the U.S. West. Therefore, port congestion in the eastern United States will remain unrelieved.
4. The progress of the negotiations between the U.S. and Western unions: The Wall Street Journal report on Friday revealed a bad news: the two sides disagreed over the issue of job ownership at the T5 Pier in Seattle, and the negotiations were deadlocked. (The ILWU and IAM, another union at Seattle’s T5 dock, are rushing to repair and maintain dock equipment. The ILWU believes they agreed to automate the dock in their 2008 contract, and in return, if the ILWU and other unions fight over the issue of job classification, The PMA, which represents the docks and shipping companies, should be on the side of the ILWU. The NLRB (the National Labor Relations Board) in the dispute over Seattle’s T5 dock work was finally ruled by the National Labor Relations Board (NLRB), and the maintenance and repair of dock equipment was awarded to IAM. ILWU was naturally very dissatisfied and felt that PMA did not stand by them and violated the agreement. PMA said that since the NLRB had awarded the job to IAM, they could do nothing. At that time, the industry judged that it would be negotiated by the union later. A mine was planted in advance. The source who broke the news to The Wall Street Journal further said that the union did not want to discuss other important topics, such as worker compensation and terminal automation, until the job issue at Seattle’s T5 terminal was resolved.)

The economic inflation situation in major consumer regions such as Europe and the United States is severe. The high inventory of retailers and the low consumption enthusiasm of the market may lead to the peak season of the shipping market transportation demand in the second half of the year will not be too strong. The already congested ports overseas may deteriorate due to the frequent strikes since the second half of the year, which may become a major supporting factor for the freight rates of some routes to maintain a high level or temporarily increase sharply. At the same time, shipping companies’ business strategies, IMO carbon emission reduction requirements, supply chain layouts of multinational companies, and unexpected severe weather will still bring more uncertainty to the shipping market.

The second half of the year is generally the traditional peak season for the shipping market. In previous years, European and American buyers would step up stocking for the back-to-school season, Black Friday, Christmas, etc., but on the one hand, the high inventory of overseas large retailers has brought cost pressure to them, and the supply chain has been interrupted The risk is greatly reduced, making retailers less worried about running out of stock; on the other hand, the weakening of the impact of the epidemic and the rise of economic inflation have caused consumers to reduce consumer demand for common goods such as laptops and furniture. The International Monetary Fund (IMF) predicts that the global GDP growth rate in 2022 is expected to be 3.6%, a decrease of 2.5 percentage points from 2021 and a decrease of 0.8 percentage points from the forecast value in January, reflecting the lack of confidence in the future economic trend. At the same time, the consumer confidence index in the two major markets of the euro area and the United States continued to decline. In July, the Eurozone consumer confidence index was -27.0 points, the lowest since June 2009; the US consumer confidence index was 51.1 points, a slight increase from June, but still at a historically low level. In the second half of the year, there is a big upward resistance in seaborne demand. Maersk (MSK) expects its container freight volume to fall in the range of 1% to 1% this year, while the previous expectation is to increase by 2% to 4%.
#Today’s topic# #雪ball star plan# #COSCO SHIPPING Holdings: When the autumn comes on September 8th, I will kill a hundred flowers after the flowers bloom! # $COSCO SHIPPING Holdings(SH601919)$ $COSCO SHIPPING Holdings(01919)$ $Orient Overseas International(00316)$
This topic has 149 discussions in Snowball, click to view.
Snowball is an investor’s social network, and smart investors are here.
Click to download Snowball mobile client http://xueqiu.com/xz ]]>
This article is reproduced from: http://xueqiu.com/8611009509/228991717
This site is for inclusion only, and the copyright belongs to the original author.