
Net worth analysis is also an important part of quantitative analysis of funds, because net worth data is easier to obtain than position data. When holding position data is not available, we have to rely on net worth data to do some quantitative analysis. There are many methods of net worth analysis, various indicators, and various analysis methods. Today I will only talk about some of the methods that I use more frequently.
The following is an example of a fund investment advisory excursion, combined with some of the analysis methods I introduced before, to introduce how to analyze a fund product through net worth data.
Net worth analysis
The simplest net worth analysis is to observe the trend of net worth and the trend of some broad-based indices. If the trend is consistent, it means that the styles of the two are very consistent. (China Post Wealth Management Steady and Balanced Index is introduced by default as the performance benchmark for fixed income + and equity-debt balanced funds. This fund is a partial equity fund portfolio, so these two performance benchmarks are not suitable.)
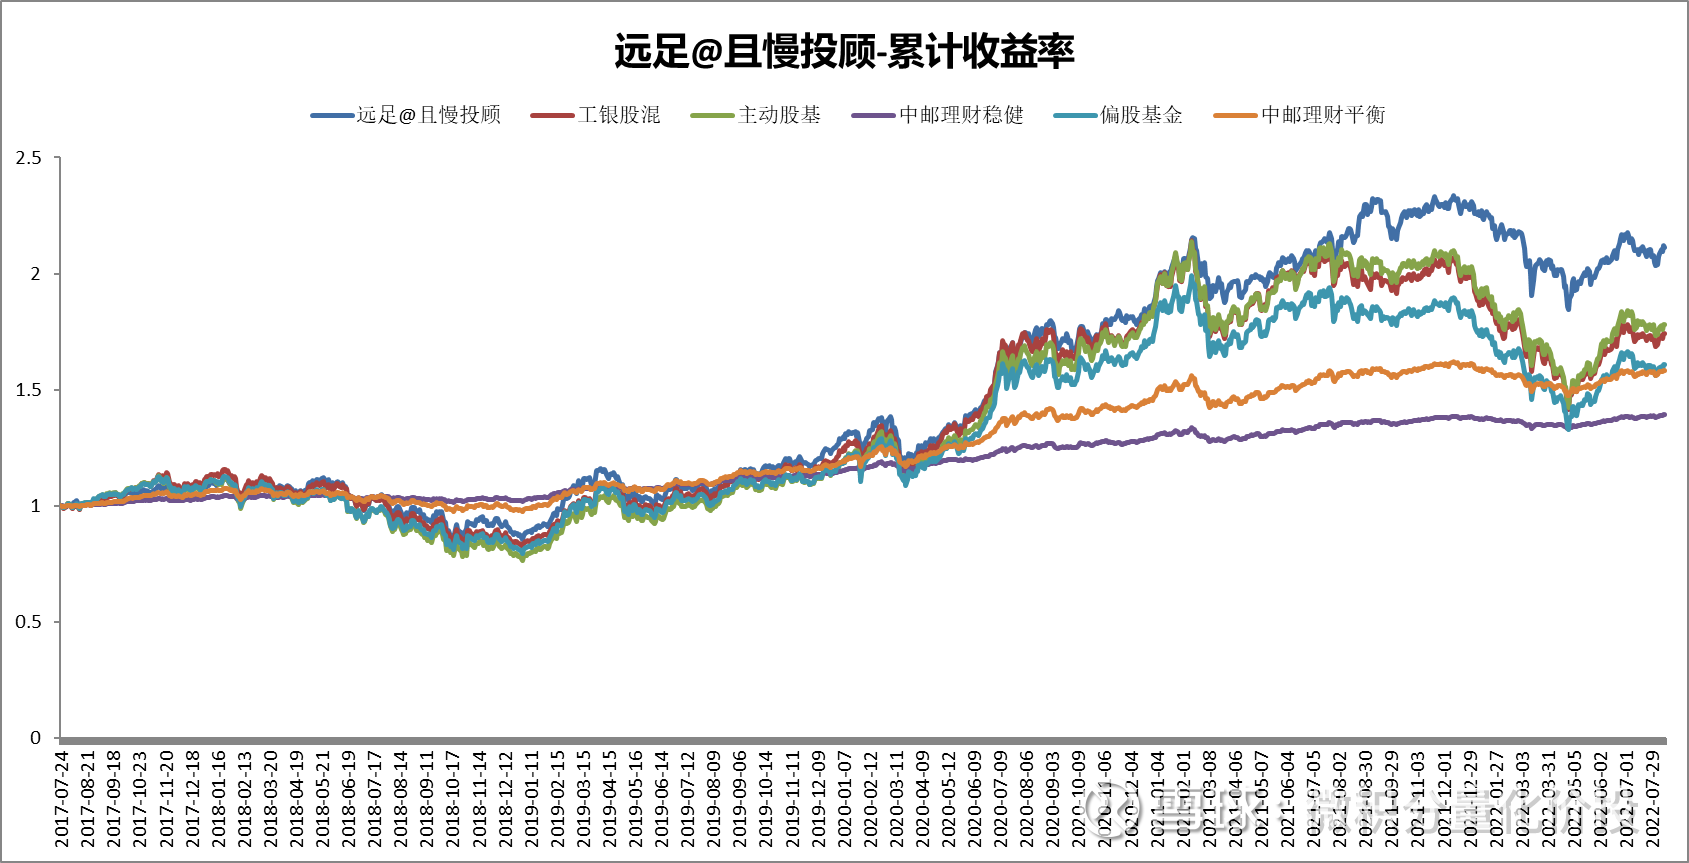
Judging from the trend of Hiking’s net worth, the overall trend is consistent with ICBC’s mixed stocks and active stocks, but the overall return is slightly higher than that of the broad-based index, and the volatility and maximum drawdown are slightly smaller. For a detailed introduction to the performance evaluation indicators, you can refer to the previous article: ” On Fund Net Value Analysis “
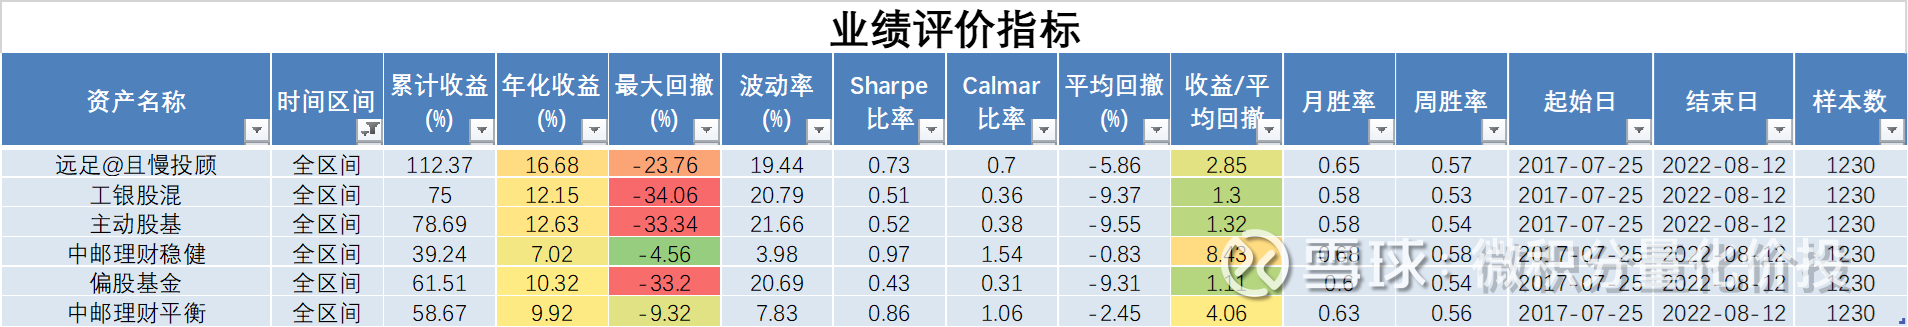
On this basis, relevant performance evaluation indicators can also be calculated. From the perspective of the whole range, compared with ICBC stocks, active stocks, and partial stocks have higher returns, and the volatility and maximum drawdown are also relatively small, so the risk-return ratio is relatively high.
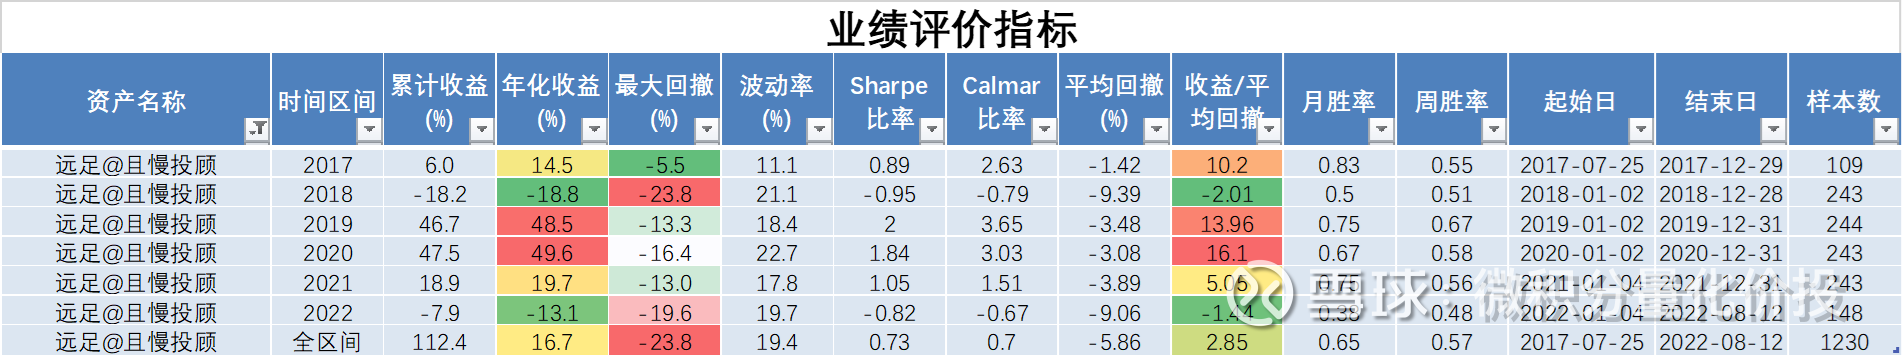
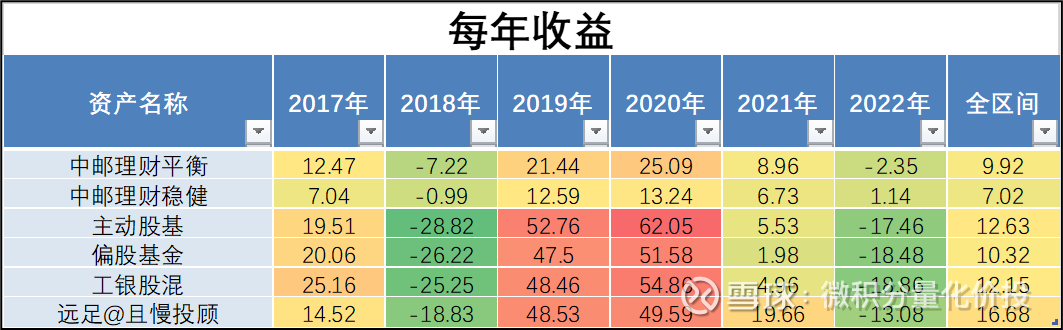
In addition to the performance comparison of the whole range, you can also observe the performance of each year. From the perspective of annual income, the victory is stable. Although there is no significant increase in 2020, it has also achieved good performance in 21 years. Although there is a slight loss this year, the loss is relatively small. The biggest drawdown occurred in 2018, but this year is already close to the biggest drawdown of 2018.
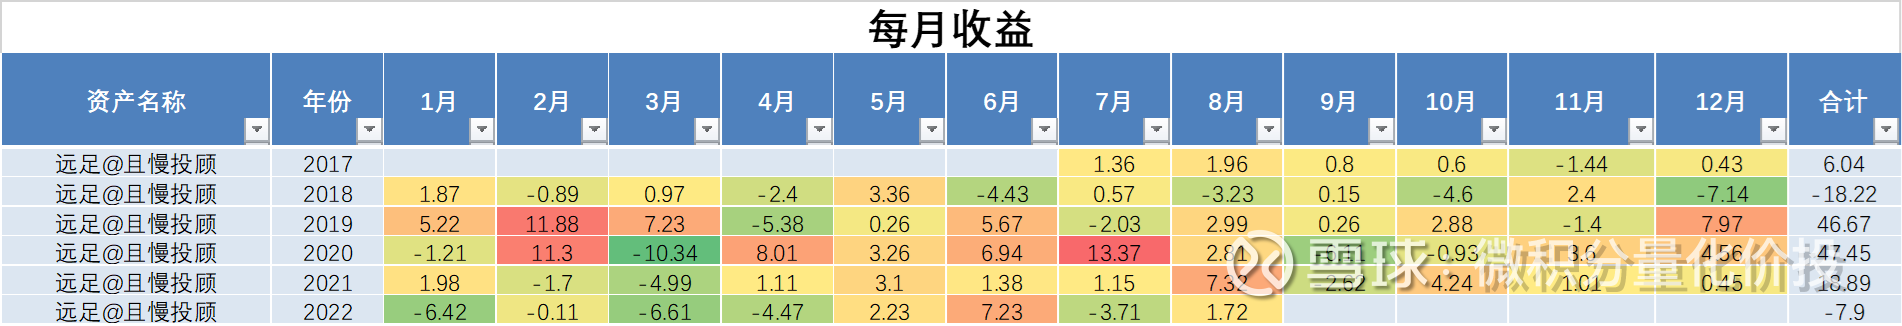
It can also be extended to monthly earnings observations. From the intuitive observation of the graph below, the monthly income distribution is very uneven, and the income mainly depends on the income contribution of several months. Because this investment advisory portfolio is a stock-biased portfolio, this situation is understandable.
At the same time, you can also compare the annual income. In this way, it is very intuitive. In 2017, it slightly underperformed indexes such as active stock bases, but the drawdown in 2018 was relatively small, and the gap was mainly opened in 2021. The reason behind this is actually observable.
Retracement Analysis
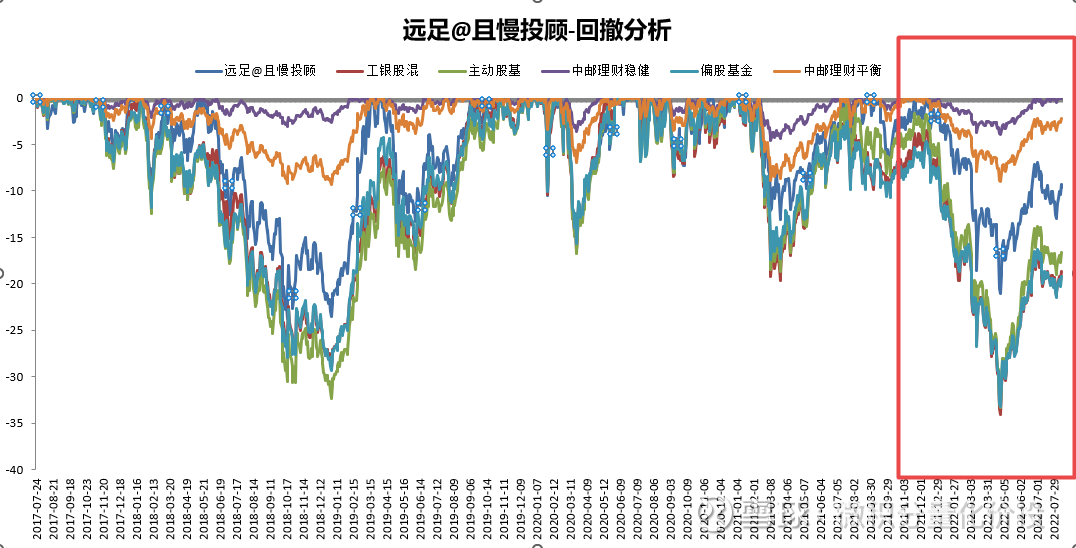
The drawdown analysis mainly depends on the risk management ability. The performance curve we hope to see must be that the absolute magnitude of the drawdown is small, and the drawdown can also be quickly repaired. In addition, whether the observation and drawdown are consistent with the broad-based index can also roughly see whether the net value is exposed to the same risk point as the index.
Judging from the statistical data, the retracement trend of hiking and related indexes is highly consistent, and the magnitude is slightly smaller than that of ICBC stock mix, active stock base and partial stock fund.
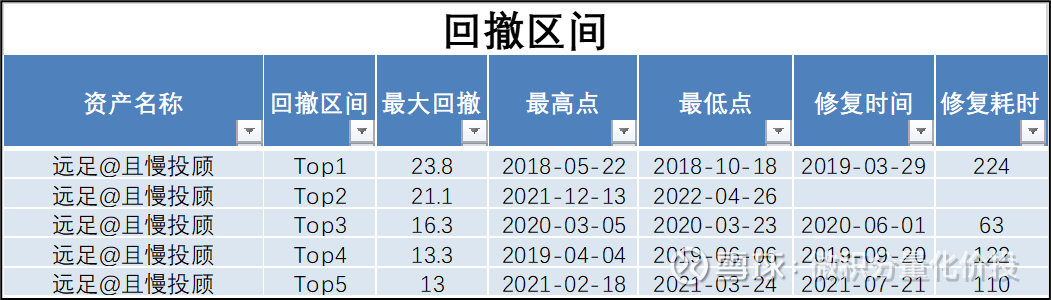
From the perspective of the largest retracement range, the largest retracement was encountered in 2018, and it took 224 days to repair the retracement. The current retracement is close to the largest retracement in history and is still being repaired.
Correlation analysis
Correlation analysis is mainly used to observe the correlation between net value and broad-based index and style index. For details, please refer to the document:
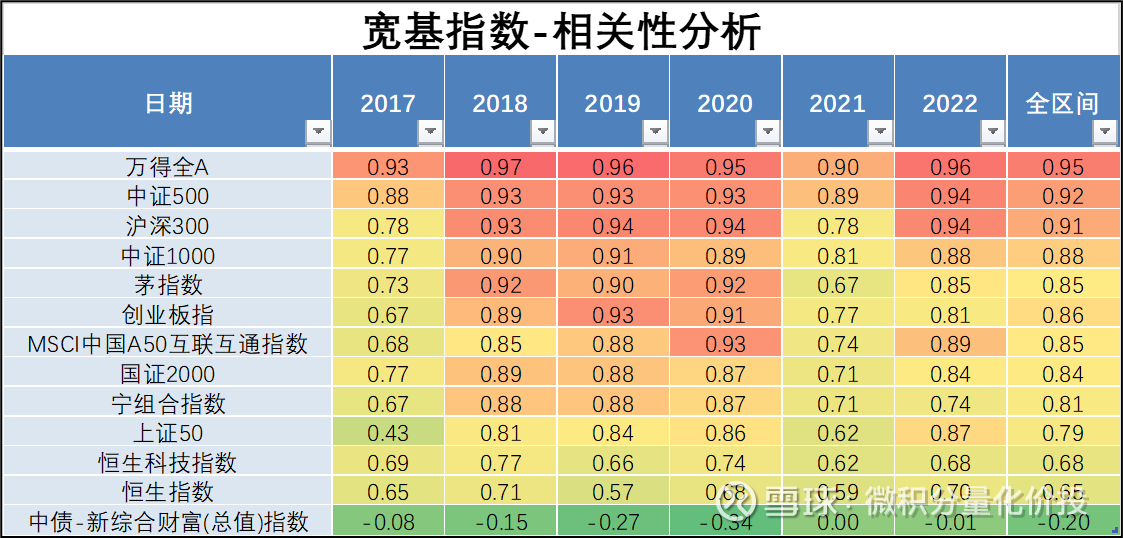
Judging from the results, Hiking is more inclined to Wind All-A, CSI 500 and small and medium-cap growth. Therefore, when the big blue chips are very popular in 2020, the income is not high, but when the market is differentiated in 2021, because there are more exposures in the style of small and medium-sized caps, the income is higher than that of active stock bases.
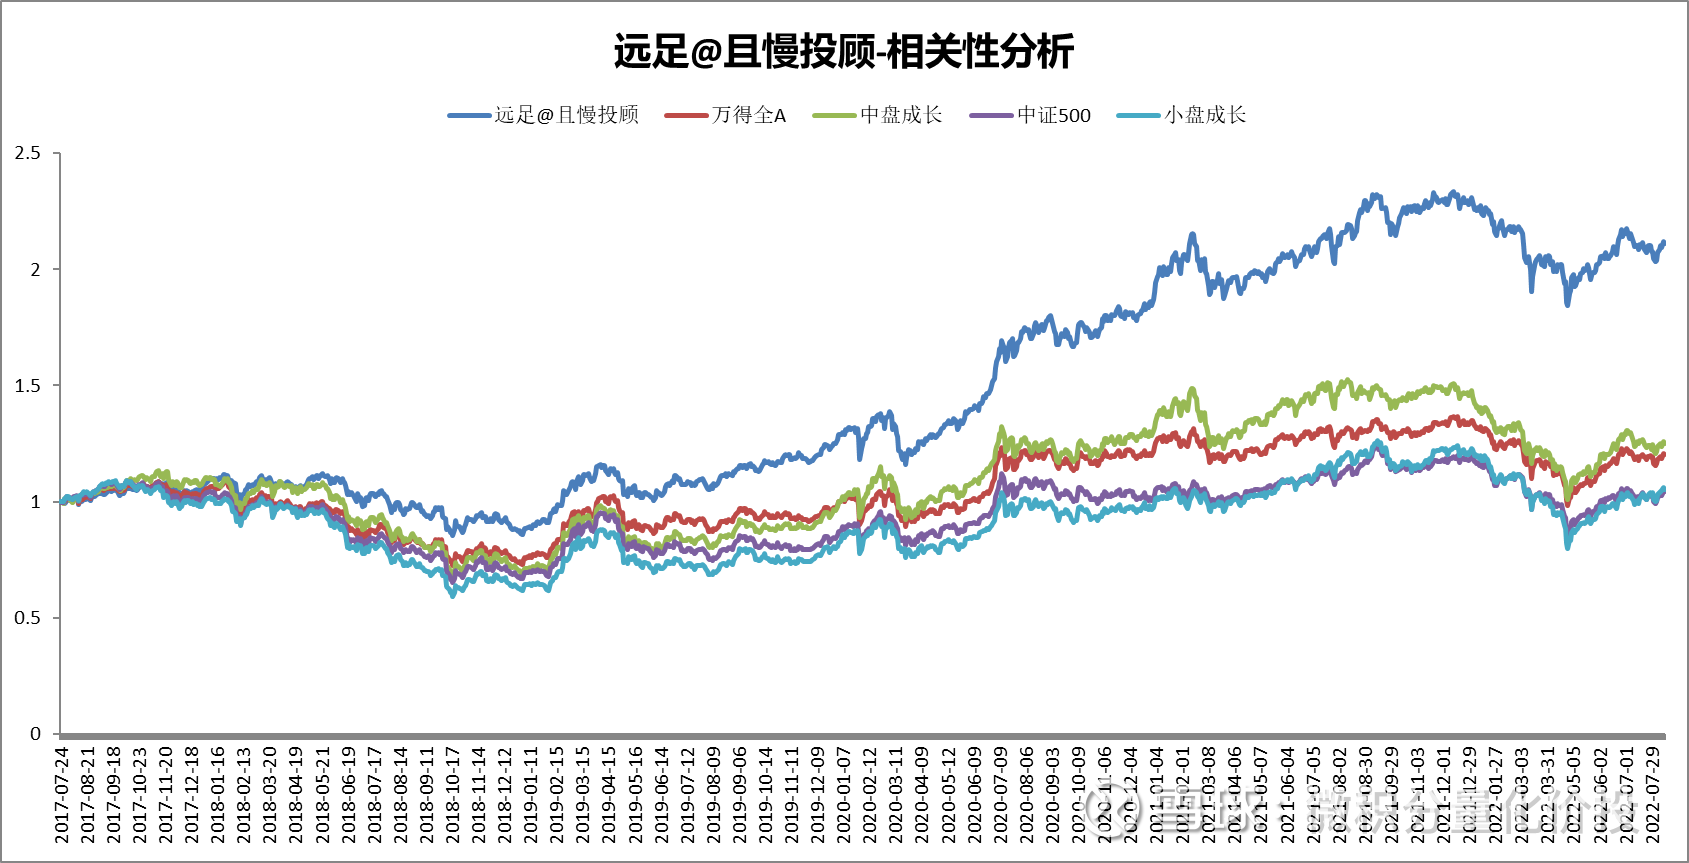
From the perspective of the whole range, the overall correlation with Wind Quan A is the highest, followed by CSI 500 and CSI 300. If you look at 2021, you will find that the highest correlation is between CSI 500 and CSI 300. A sharp drop, so at this point, the equity is showing a little bit of style drift. The overall Hong Kong stock-related index has a low correlation, so the selected fund should basically not include Hong Kong stock positions, which can be considered to have escaped the plummet of Hong Kong stocks.
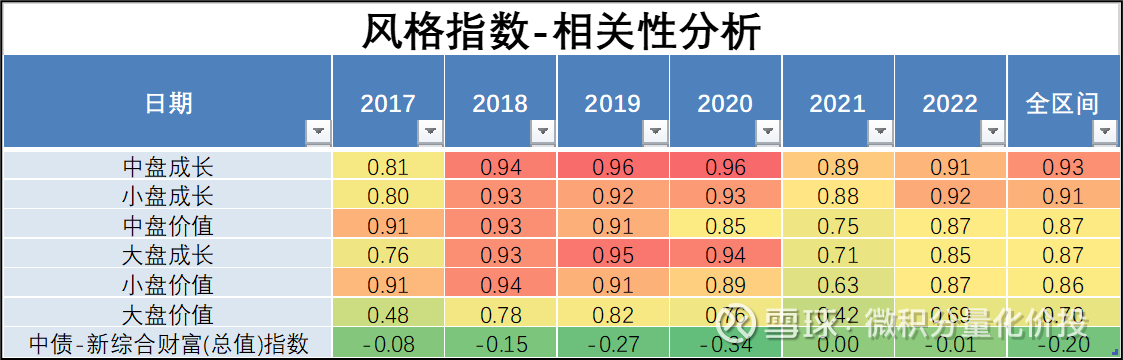
Let’s look at the correlation analysis with the style index. On the whole, it has the highest similarity with the styles of mid-cap growth and small-cap growth. In fact, it is understandable why the hiking fund portfolio has achieved relatively high excess returns in the past two years. You can say that he bet on the right wind, but he can bet It is also an ability to the wind.
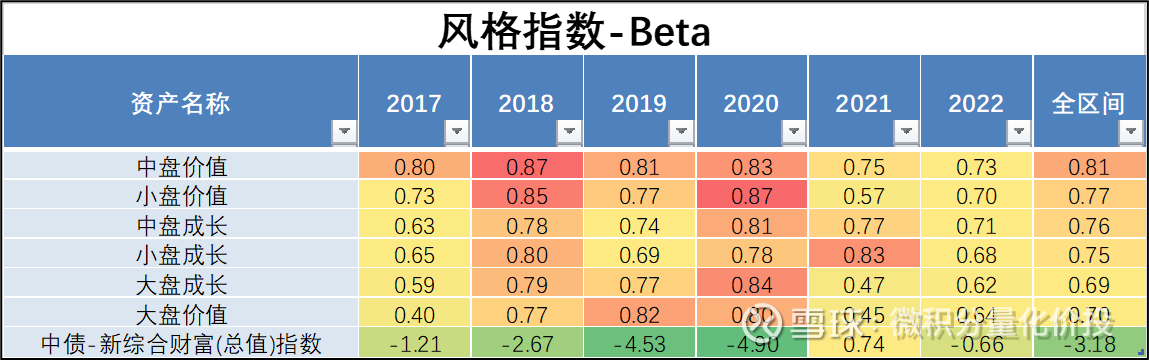
Back to Beta
Correlation analysis, which is mainly used to observe the exposure of equity to broad-based indices and style indices, can be used to infer approximate position levels.
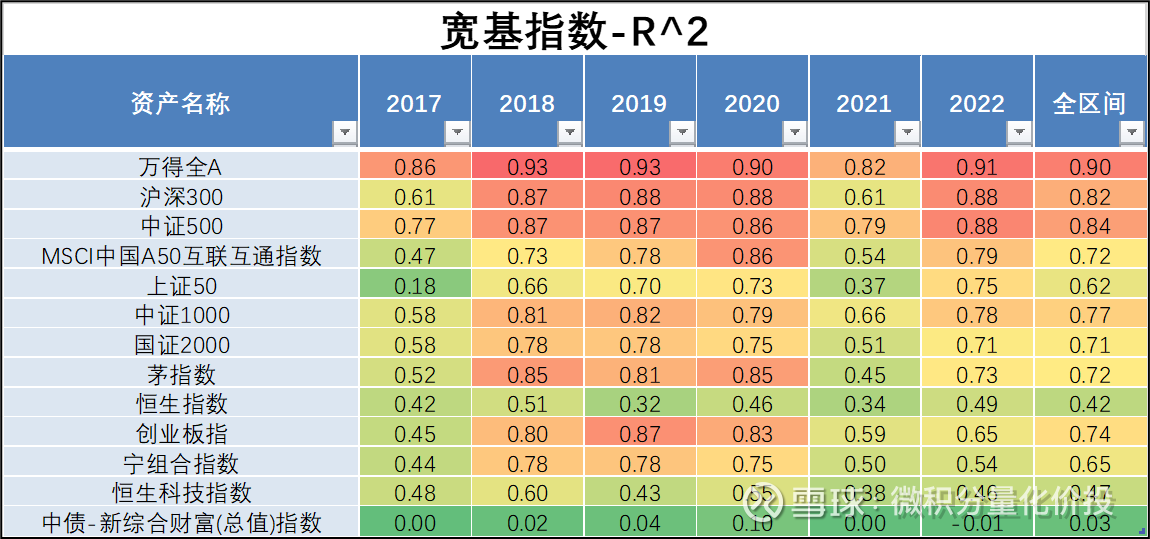
Judging from the R^2 of the regression analysis, it is relatively reliable compared with the results of the regression analysis of Wind All A, CSI 300, and CSI 500.
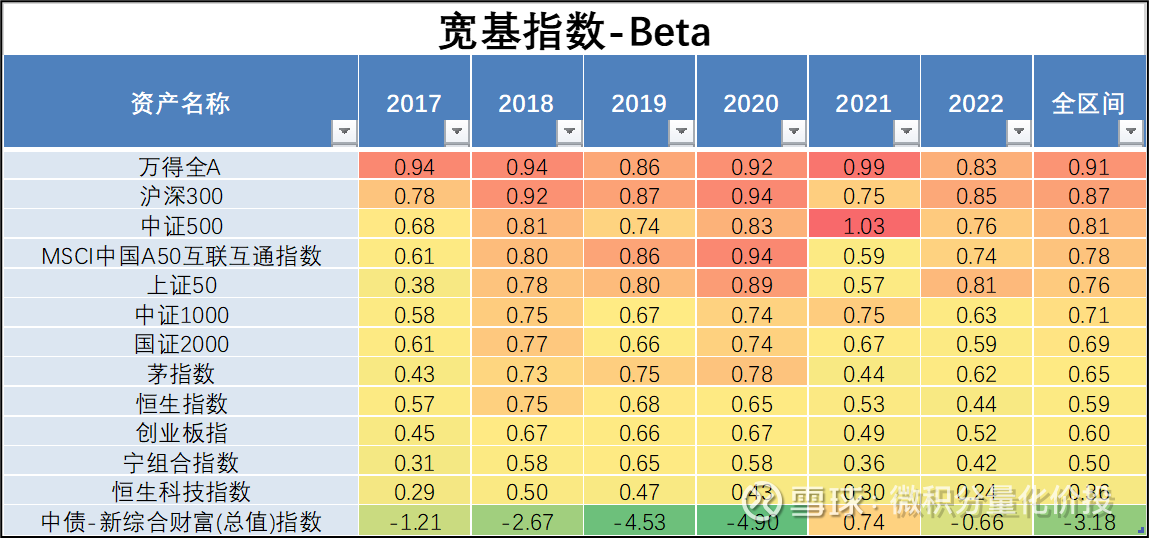
From the results of the regression analysis, the full warehouse operation is basically maintained.
The interpretability of the regression analysis with the style index is a little weaker,
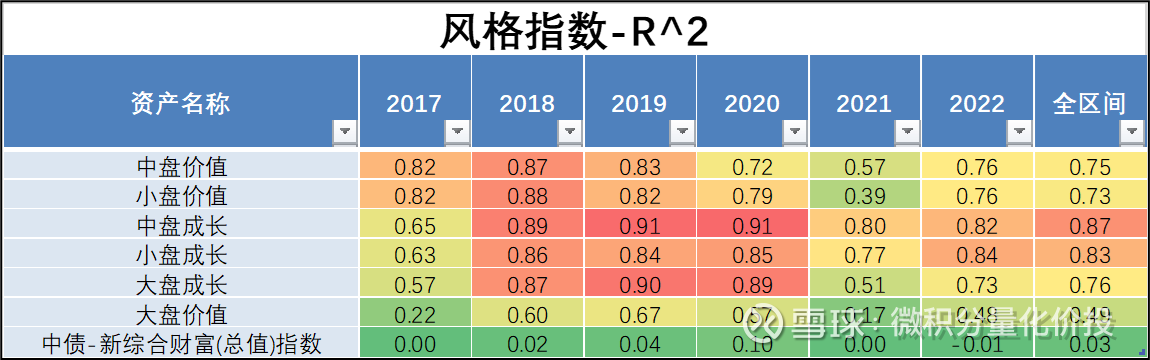
Relatively speaking, it is exposed a little more in mid-cap value and small-cap value.
I don’t know if you have observed that the explanatory power of the regression results, if you analyze a single fund, the explanatory power is not so good, but for the fund portfolio of multiple funds, the explanatory power is much improved. As we often say, multiple measurements are averaged to reduce errors. The fund can be regarded as a combination of individual stocks, and the income does not depend more on individual stocks. The fund portfolio is equivalent to the combination of funds, which further offsets the impact of individual stocks, so the return performance will be more similar to the overall style of the market index. (Market indices are made up of hundreds of stocks).
Similarity Index Analysis
For the principle of similarity index analysis, you can refer to ” How to Find a “Spare Tire” Fund . The purpose of analysing similar indices is to dig deeper into whether there is a specific style exposure to the net value, and even whether a similar index fund can be found to replace the product.
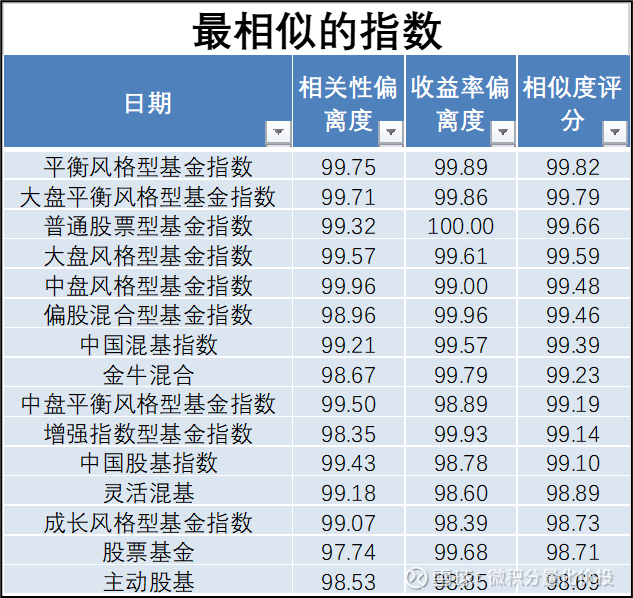
Here are just a few indexes with relatively high similarity, including Yinhua stock base, balanced style fund index, and the manufacturing industry of the China Securities Regulatory Commission.
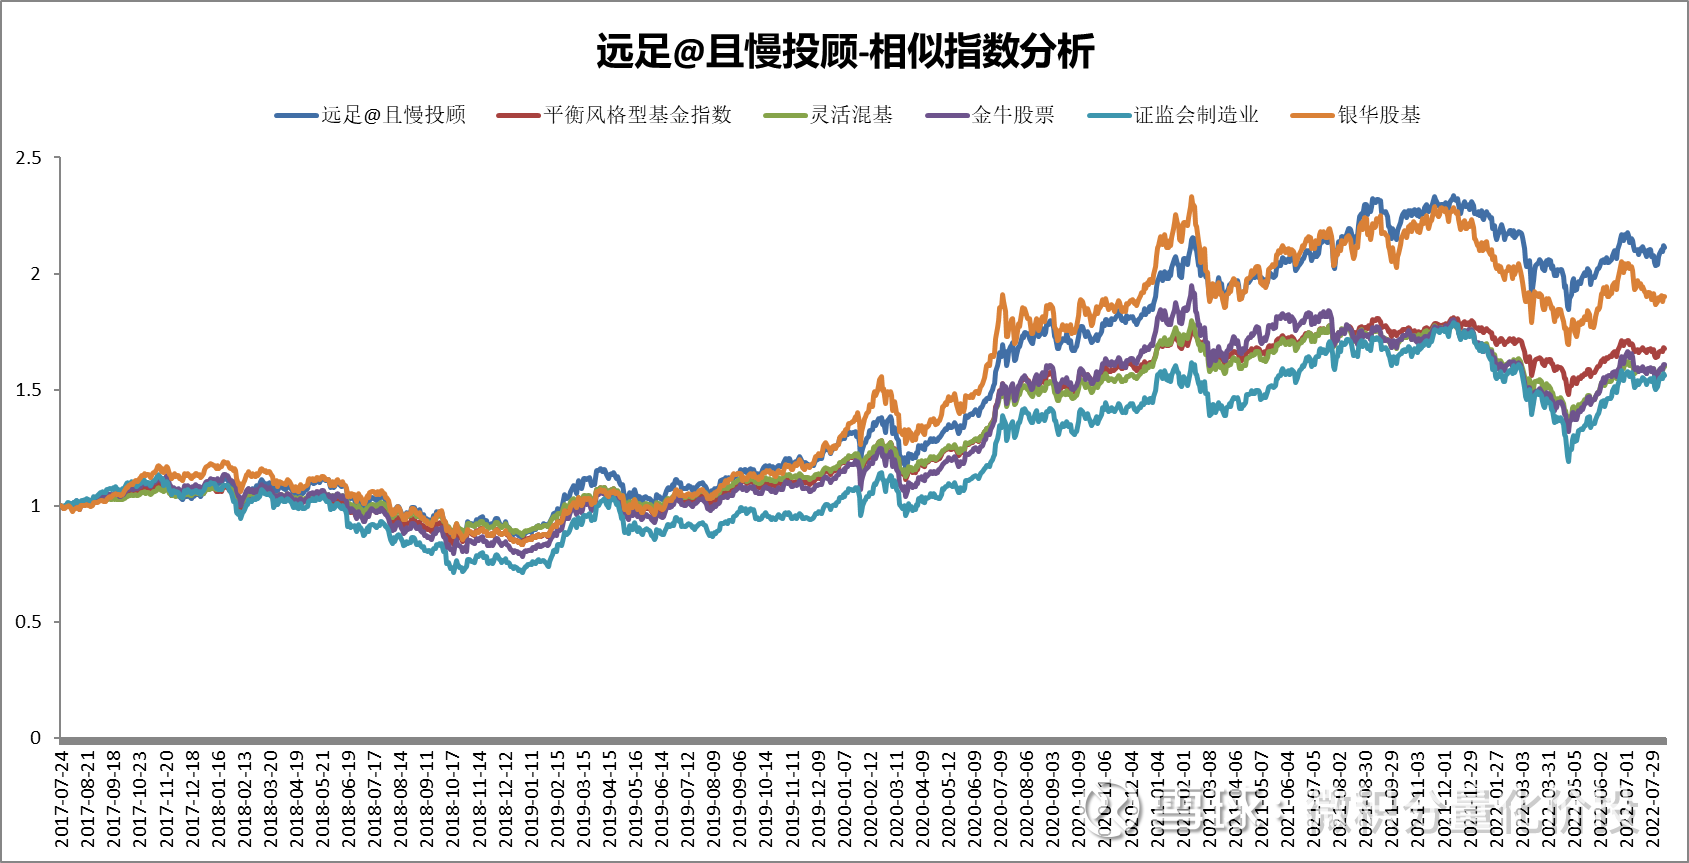
Especially compared with the Yinhua stock base, the previous trend was highly consistent, but there was a clear deviation recently. Hiking rose against the trend, but the Yinhua stock base went down.
The following is a list of specific indicators that can be further observed and analyzed.
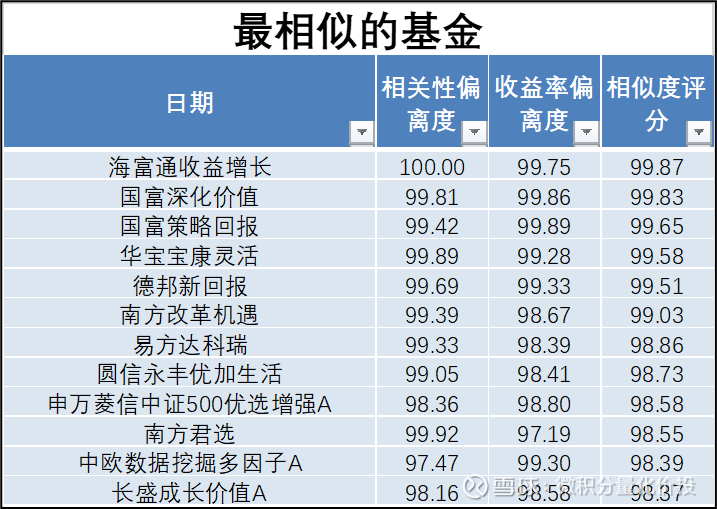
Similar Fund Analysis
For the analysis principle of similar funds, please refer to ” How to Find a “Spare Tire” Fund . The main role here is to see if there is a spare tire fund.
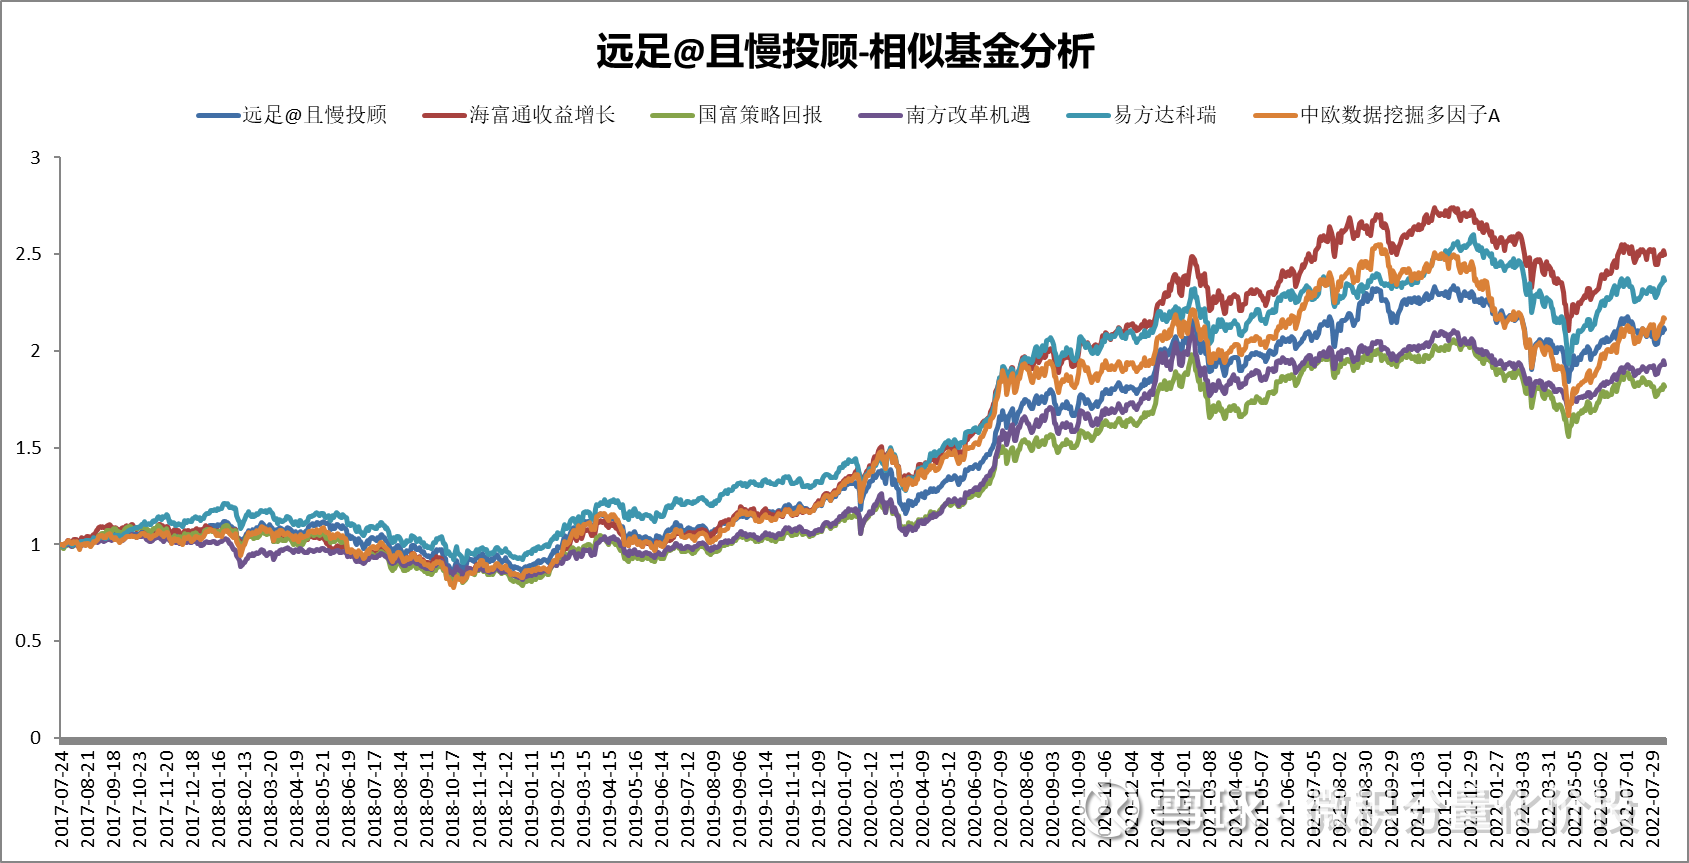
From the analysis results, Haifutong’s revenue growth is highly similar to that of hiking, but the overall performance will be higher than that of hiking.
Below is a list of similar funds for further analysis.
Fund like-for-like comparison
Ideally, we want to find the most cost-effective product in the market, that is, the highest return under the same risk conditions, or the lowest risk under the same income conditions. Especially for a compound strategy, or a compound portfolio, because the advantage of a compound strategy is to improve the risk-return cost-effectiveness of the portfolio. If this is not possible, then this compound strategy has no meaning in existence.
The previous analysis was based only on the analysis of a single fund, and now we compare the net worth to be analyzed with the performance evaluation indicators of the public funds in the whole market to observe the relative performance of the products to be analyzed in the whole market.
Because the risk evaluation indicators have volatility, maximum drawdown and average drawdown, there will be scatter plots under different risk evaluation indicators.
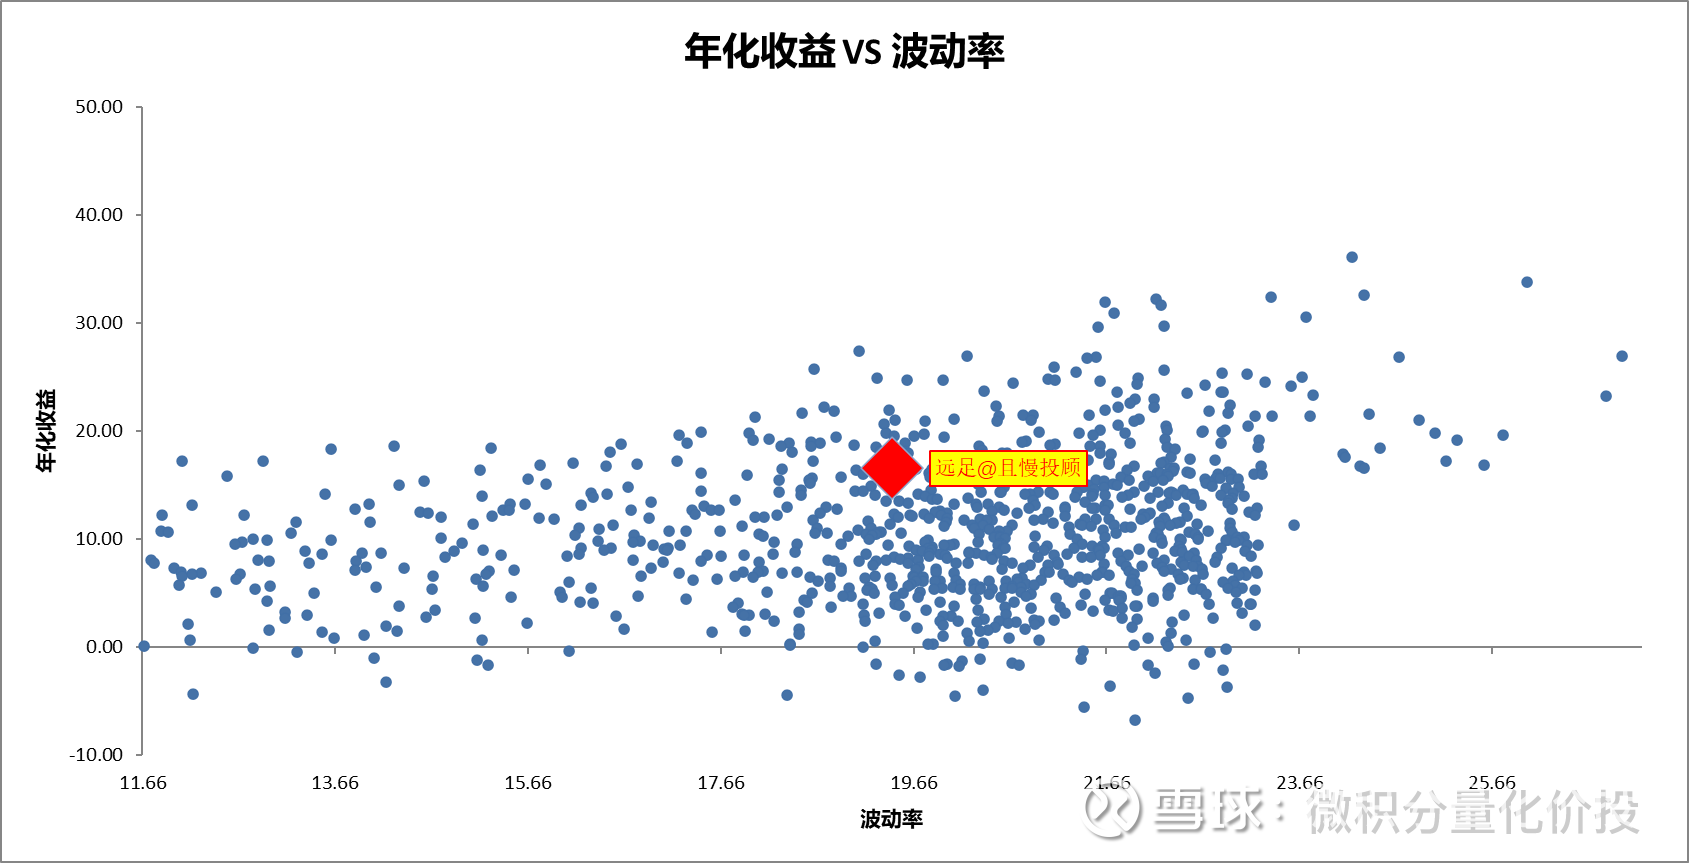
Judging from the annualized return vs volatility scatter plot, Hiking is basically in a relatively good position in the entire market. In the actual selection, it is not required to choose the best choice, because some products may contribute to new income, and the income is not real, and some products may be the right style bet, so the income risk is very cost-effective, in practice , I choose the standard is not too bad, in the upper level on it. If the performance is very low, then I may not consider this product at all, because there are other better funds to explore.
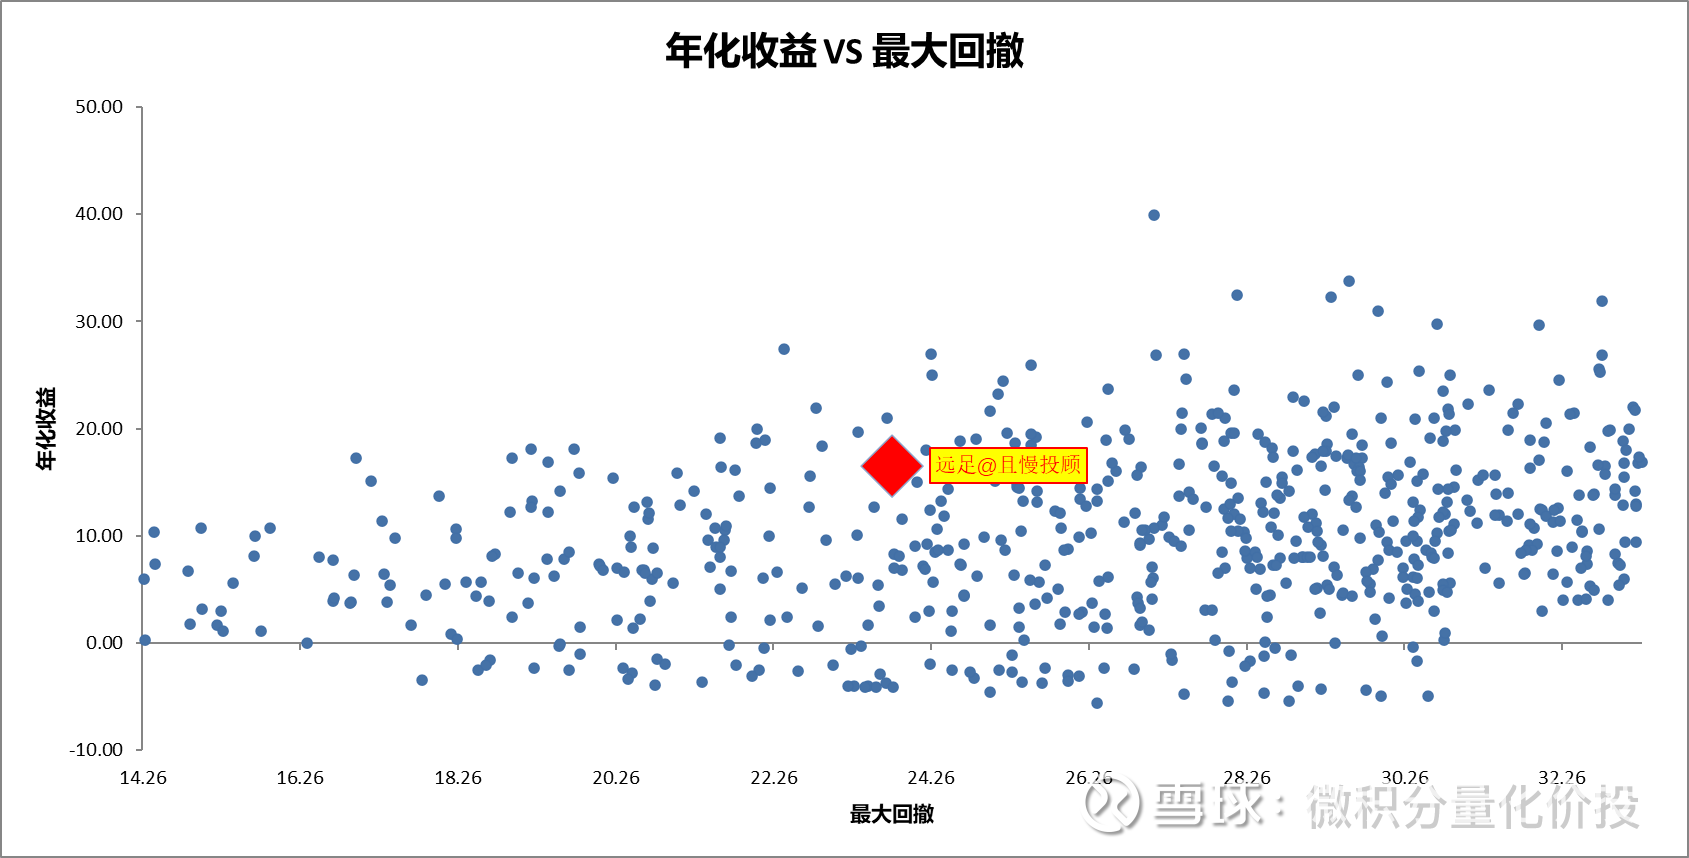
The overall performance of the hike is also relatively good in terms of maximum drawdown and average drawdown.
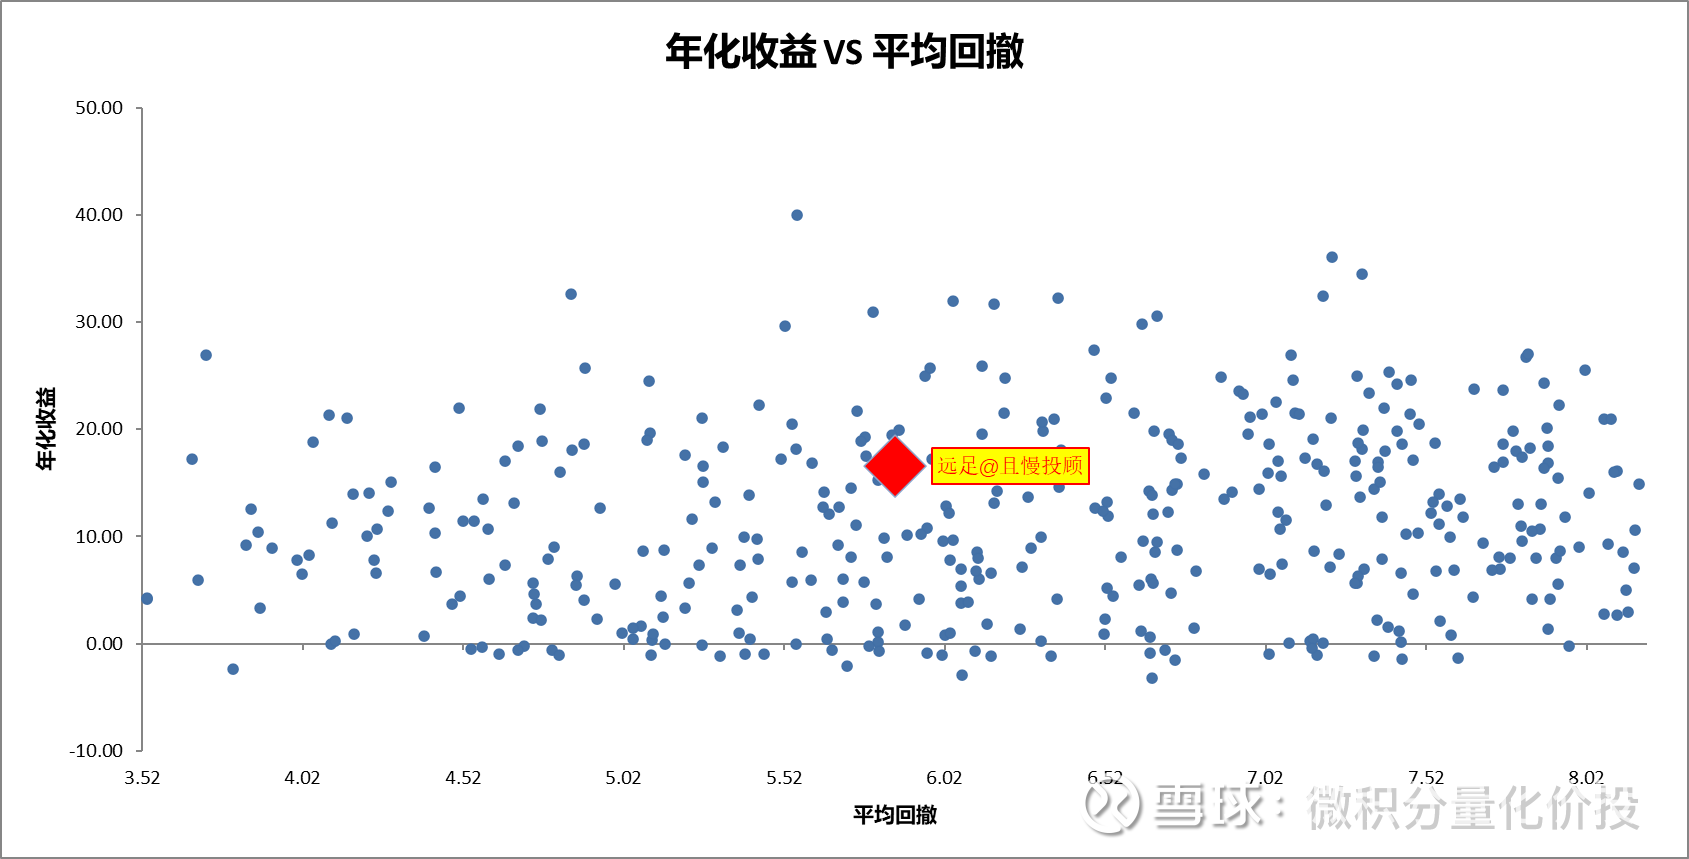
However, it should be noted that this is a market-wide comparison of the same type, and sometimes the comparison of funds of the same type is more accurate, such as the same type of funds for consumption and the same type of funds for manufacturing.
regression analysis
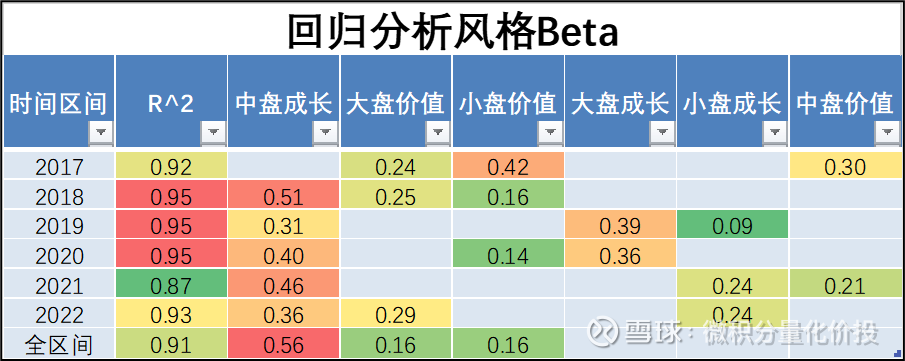
For the specific principles of regression analysis, please refer to the document: ” Talking about regression analysis in net worth analysis “.
From the results, the interpretability of the regression is ok, but from the perspective of style exposure, the overall growth style is exposed in the mid-cap, but there will be an obvious style switch in 2021. The exposure of the large-cap growth style is basically not, and the corresponding small Plate growth style increased. Large-cap value-style exposure has also increased in 2022. It is uncertain whether this switch is completed by the active adjustment of the investment advisor portfolio manager, or by the active management of the selected fund manager.
From the perspective of yield splitting, the overall portfolio will have a certain α, but it should be noted that the α of each time interval cannot be compared vertically, because the β of each time interval is different. Leaving β and talking about α are all hooligans.
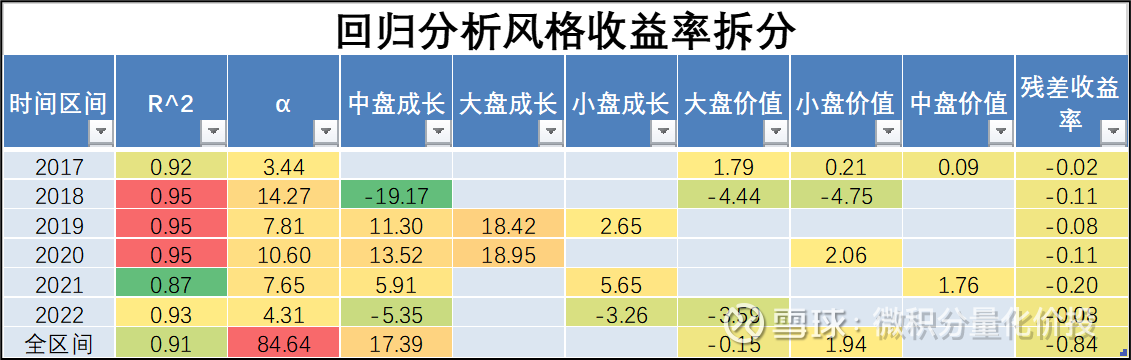
From the perspective of income splitting, most of the income is the exposed contribution of excess alpha and mid-cap growth style. In the early stage, there was also a large-cap growth contribution. Later, there was a little style switch, switching to small-cap growth and mid-cap value.
summary
Judging from historical performance, Hiking outperformed the common broad-based index, not only with high yields, but also in risk evaluation indicators such as maximum drawdown and volatility. Judging from the comparison of the public fund industry in the whole market, the overall performance of the portfolio is at a relatively excellent level.
If you look further, the hike is mostly a nice outsized return relative to the broad-based index in 2021. Judging from the style exposure obtained from the regression analysis, mainly in 2021, the exposure of the growth of the large market was reduced, and the exposure of the growth of the small market was increased, but this is uncertain whether it is the active switching of the fund’s investment advisor or its subsidiary. The fund manager actively manages the switch, which requires the position data to be verified before it can be obtained.
In addition, it is also found that some single public funds can achieve the replication of hiking income, and there are corresponding excess returns.
I hope that through the above examples, you can learn how to analyze based on net worth.
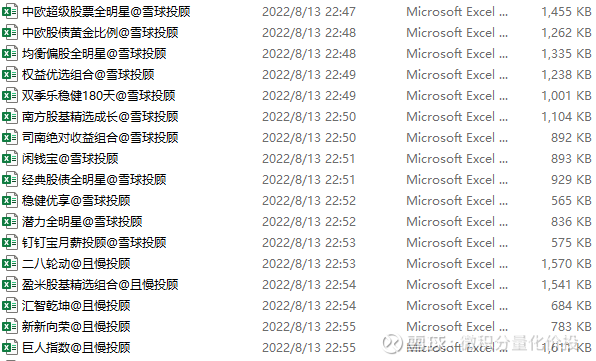
In addition, I have processed the underlying data files of the net worth analysis of more than 150 fund investment advisors FOF. Based on these data, you can also refer to my method above to do a similar analysis. If you are interested, you can PM me (WJFLHJT) to get all the files.
At this point, the full text is over, thank you for reading.
If you find any mistakes or omissions in my analysis, your corrections and additions are welcome.
The above content is only used as a personal investment analysis record, and only represents personal opinions. The analysis content is based on historical data. Historical performance does not indicate its future performance. It does not serve as a basis for buying and selling, and does not constitute investment advice.

Like and watch, investment makes more ¥
#雪ball star plan public offering talent# #ETF star push officer# #calculus quantitative price investment#
@ Egg Roll Index Fund Research Institute @ Today’s topic @ Snow Ball Creator Center @ Egg Roll Fund @ ETF Star Push Officer @ Ball Friends Welfare @ Ricky @吉民lemming
Quickly retrieve historical articles
$ Screw Golden Tail Bao Active Selection (TIA06020)$ $ Screw Golden Tail Treasure Index Enhancement (TIA06028)$ $ Screw Silver Tail Bao 90 Days (TIA06018)$
This topic has 6 discussions in Snowball, click to view.
Snowball is an investor’s social network, and smart investors are here.
Click to download Snowball mobile client http://xueqiu.com/xz ]]>
This article is reproduced from: http://xueqiu.com/4778574435/228614830
This site is for inclusion only, and the copyright belongs to the original author.