I have been troubled by the percentage of 36% for the past few days. Taking advantage of the free time on the weekend, I can finally solve the confusion.
Probably since last Wednesday (June 8), suddenly many people in the industry are citing a ratio: 36%, which means that the import volume of the United States has dropped by as much as 36%. Many media and investment analysis reports have cited this data and wailed: the US import volume has fallen off a cliff, and the US line has ended this year.
When I first heard this number, I was full of question marks: 36%? Where is the data source? What is the statistical caliber? Compared to what period? If you do not understand the source of the data and the calculation method, the data will be meaningless and even misleading.
It is a pity that various reports just quoted this conclusion directly, without specifying the source of the data, nor providing more background information.
With an attitude of seeking truth from facts, you can only find out the truth yourself.
The 36% figure first appeared in a June 7 Freightwaves report: US import demand is dropping off a cliff ( web link ). The article is very long, I read it carefully. The key 36% appears in the following paragraph: Compared to May 24, US container imports fell by 36%. The article also includes a picture. Let’s take a look at how this ratio is calculated.

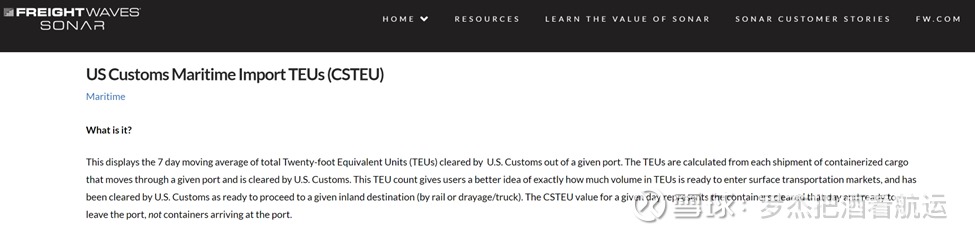
To understand this index, here is a key word: CSTEU (US Customs Maritime Import TEUs), that is, US Customs Maritime Import TEUs. Simply put, CSTEU is the 7-day moving average of the volume of goods (TEU) cleared through U.S. customs at a certain point in time. Friends who do investment or statistics must be familiar with this moving average (MA). The CSTEU of a certain day is the volume of goods cleared through customs on that day, and does not represent the actual volume of goods arriving in the United States (ETA). General customers will clear customs 4-5 days in advance. This index can see the volume of goods that are about to arrive in the United States in advance, and relevant companies on land can make a prediction about the market.
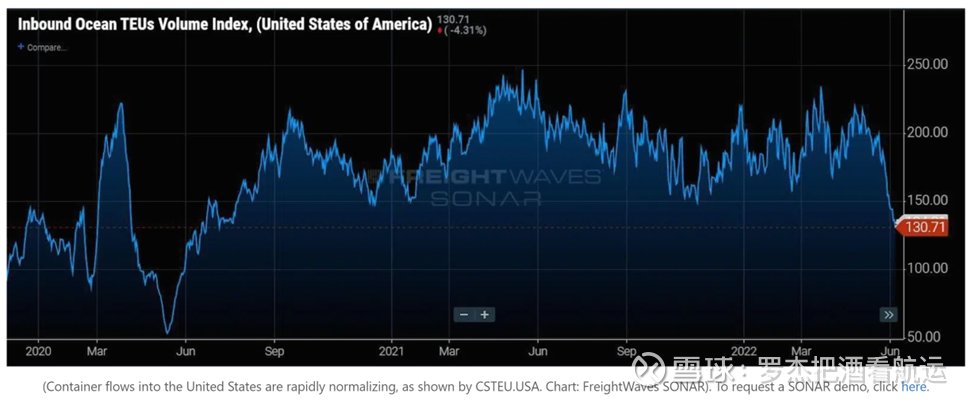
The image below is from Freightwaves SONAR. SONAR is an industry data analysis service provided by Freightwaves. They use the Inbound Ocean TEUs Volume Index to monitor changes in the volume of U.S. imports.
Based on the context and the graph below, 36% means this: On June 7th this year (the day the author published the article) compared to May 24th last month, the CSTEU index dropped by 36%.
Finally figured out the source of the data, let’s take a look at what does this ratio mean?
Let me go straight to the conclusion: it doesn’t make much sense.
Why do you say that? There are many factors that affect the volume of the US line in a period of time: factory production, customer orders, seasonal factors, shipping schedule and space changes. Daily, weekly, and monthly volumes fluctuate greatly. Just choosing the average value of two days in a year that are very close to each other for volume comparison cannot fully and truly reflect the overall picture of the US line. I cannot verify the authenticity of the CSTEU figures themselves, I tend to believe they are accurate. The problem, however, is the method used to arrive at this percentage. Comparing the ratio of June 7 with that of May 24, the time range of the data is too small, and the conclusions drawn are therefore meaningless.
Do not believe? Prove it to you right now.
It doesn’t matter if there is no CSTEU data, we can use Datamyne for horizontal comparison. Datamyne is based on the US customs ETA volume (that is, the actual volume of goods arriving in the United States), which is widely used in the industry, and is different from CSTEU (customs clearance volume). The statistical caliber is different, and the values are of course different. However, generally speaking, the customs clearance is 4-5 days before the ship arrives at the port. The data of CSTEU and Datamyne are the same, but there is a time difference. Although it is not easy to compare two data on the same day, if we stretch the time period long enough, the final data is actually the same.
Using the concept of a 7-day moving average, I calculated the values for the two days of May 24th and June 7th, based on data from Datamyne. The 7-day moving average of US import volume on May 24 was 82,671TEU, and the 7-day MA on June 7 was 80,406TEU, down only 3% year-on-year. If you compare the volume of goods arriving in the week from May 30 to June 5 with the previous week (May 23 to May 29), the actual volume also increased by 3%. This weekly data comparison is obviously not very meaningful.
From this, it can be seen that the conclusions drawn from the comparison of data of different statistical calibers and different time periods vary widely, although these data may be correct. No matter what statistical method is used, the time period of the data should not be too short, otherwise it is easy to draw misleading conclusions. In the case of the US line, the shortest time dimension must be monthly, and comparisons by day or week are almost meaningless.
So what is the change in the US line volume this year?
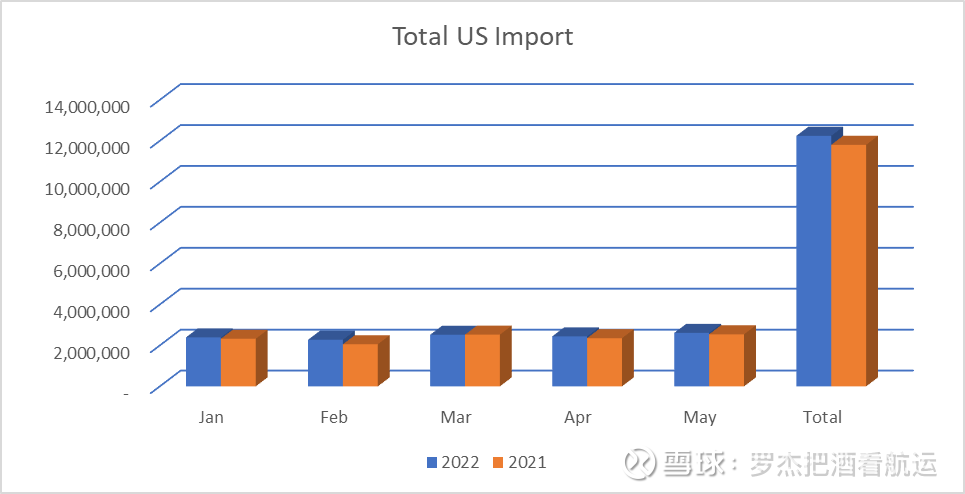
According to data from Datamyne, in the first five months of this year (according to the date of arrival), the total imports of the US line increased by 4% over the same period last year, and each month from January to May increased month-on-month.
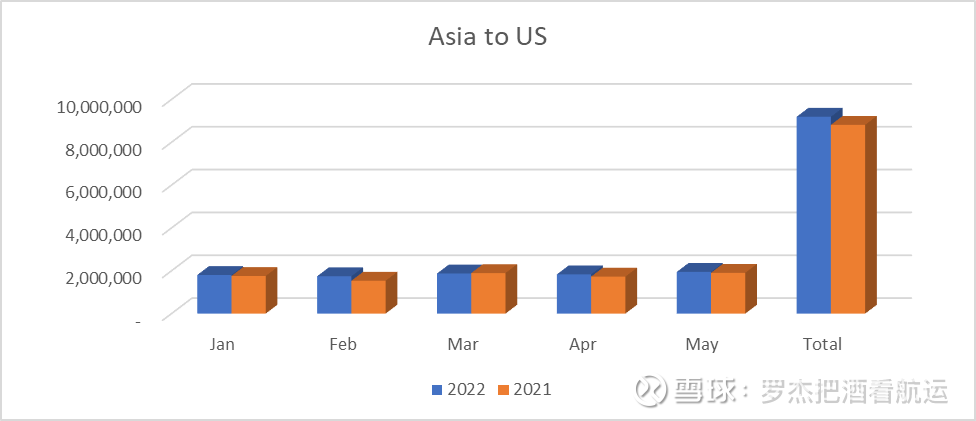
Asia, which occupies the main shipping area of the US line, maintained the same growth trend, recording a 4% increase from January to May.
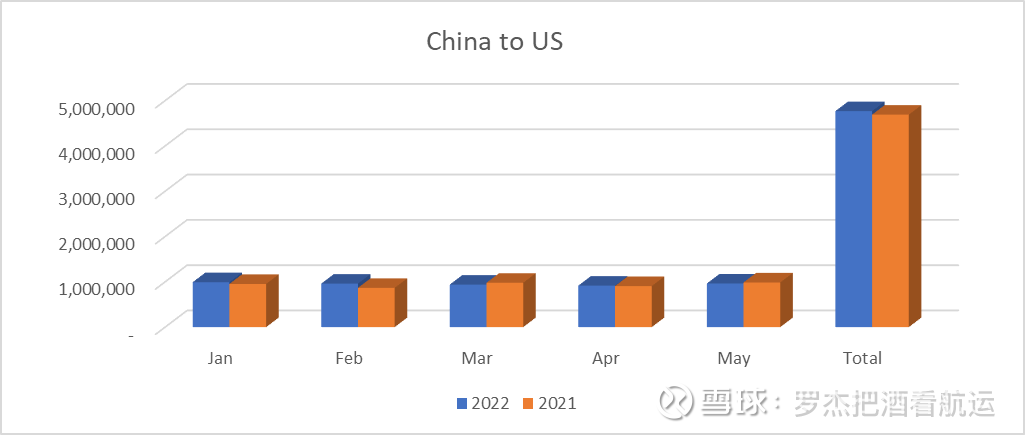
Let’s take a look at the volume of China’s exports to the United States that everyone is most concerned about. From January to May, China’s overall US exports increased by 2%. Yes, it is an increase, not a decline. From January to April, it maintained a growth of 3%, and fell by 2% in May. It arrived in Hong Kong in May and shipped in April. At that time, it was during the epidemic lockdown period. The decline in shipment volume was predictable and no surprise. It needs to be mentioned again here that Datamyne is based on the arrival date, and the data lags behind everyone’s actual feelings by at least one month. It is estimated that the full impact of the epidemic closure and control on the shipment volume will not be seen more clearly until the data at the end of June is released, that is, the data of the entire shipments in May will not be seen from Datamyne until the end of June. The data I see now is a partial impact, but there is no “cliff fall” that some media like to cite.
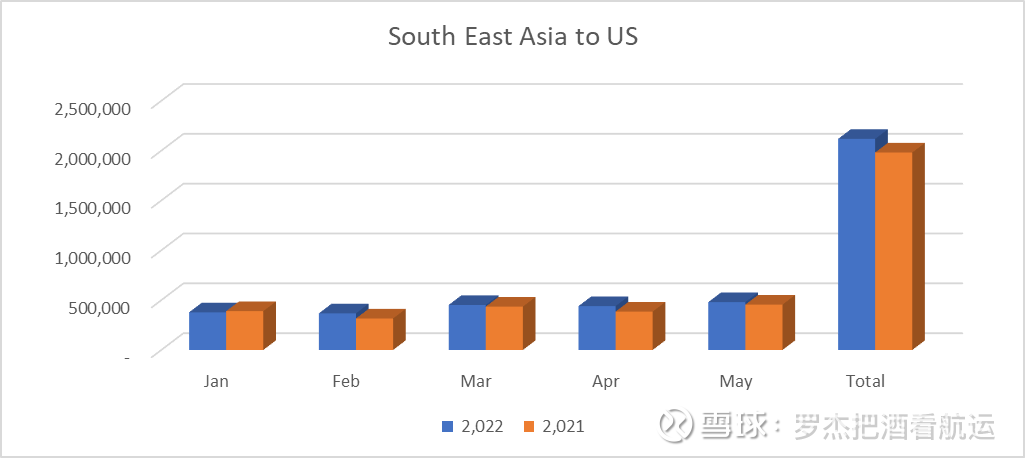
After reading China, look at Southeast Asia. Unsurprisingly, Southeast Asia to the United States increased by 7% in the same period from January to May, which is higher than that of China, which is also in line with the industry’s expectations.
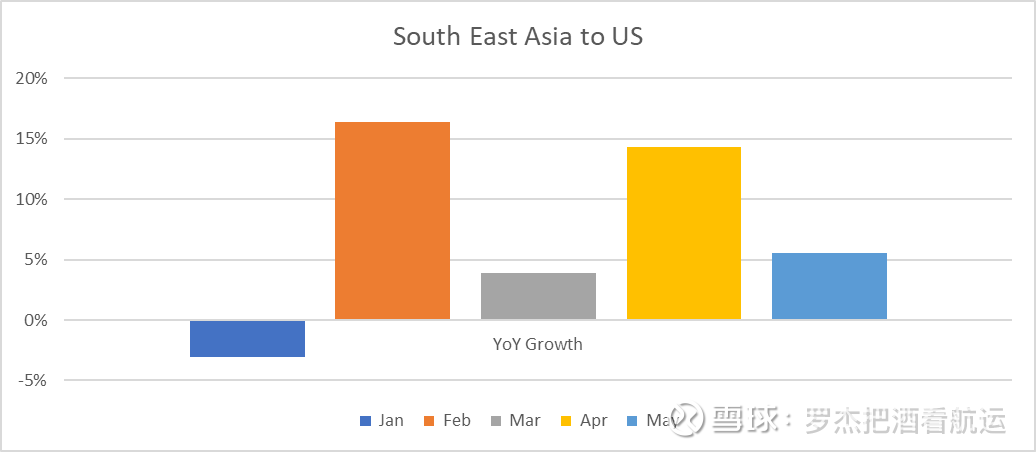
Just looking at the year over year change from month to month, there is an interesting number. It fell 3% year-on-year in January, rose 16% in February, fell back to 4% in March, and rose to 14% in April. Interesting is the year-on-year data for May. If some orders are lost to Southeast Asia due to the outbreak in China, then Southeast Asia’s May data should increase significantly. Again, the time here is the arrival day. However, Southeast Asia to the U.S. recorded a modest 6% increase in May from a year earlier. There may be two reasons for this: The data does not yet fully reflect the true picture. The sailing time from Southeast Asia to the United States is longer than that from China to the United States. Not all goods arriving in May are shipped in April, and some will not arrive in Hong Kong until June. If there are orders transferred to Southeast Asia, this impact has not been clearly seen from the data. Another possible reason is that order churn is not as severe as imagined. The specific situation will be seen when the data comes out in early July.
Due to well-known reasons, it is difficult for the US line to maintain the rapid growth of last year this year, which is an indisputable market consensus. During the epidemic last year, the abnormal consumption in the United States cannot and will not continue forever. Many variables on the demand side have changed (such as the gradual normalization of physical consumption to service consumption), which is bound to affect the import volume of the US line. At present, the bearish sentiment of the US line market is prevalent. At this time, the news that the volume of goods has plummeted by 36% has further “confirmed” the judgment of the bearish market. The problem is that, as mentioned above, the data obtained by intercepting a very short period of time for comparison cannot fully reflect the whole picture of the market, and the conclusions drawn may even seriously deviate from reality. The source of data, the selection of statistical caliber and time period are the basic criteria for judging the accuracy and validity of a data. In a volatile and downward market, various data will magnify the market’s uneasy mood, and it is particularly important to rationally identify and judge the source of the data.
As for how the US line will develop next this year, I will share my shallow knowledge in another article.
This topic has 0 discussions in Snowball, click to view.
Snowball is an investor’s social network, and smart investors are here.
Click to download Snowball mobile client http://xueqiu.com/xz ]]>
This article is reproduced from: http://xueqiu.com/3949159638/222412843
This site is for inclusion only, and the copyright belongs to the original author.